Loading…
UN DESA Population Division · Net Migration Rate
Net migration rate by country
Do more people move into each country than leave it?
Of the 222 countries compared in 2023, South Sudan had the highest reading, 39.622, and Saint Martin had the lowest reading, -61.677. In the middle country the figure was -0.133. Among the 222 countries measured in every edition since 1950, the middle one moved from 0.000 to -0.133.
Net migration rate · 2023
Context statistic

Highest of 222South Sudan
39.622012023 · values only
The highest and the lowest
The three countries with the highest values of 222 compared, the three with the lowest, and the highest on each continent. This statistic has no better end, so no country is shown as leading.
- 1
- 2

- 3

Lowest in 2023
 Saint Martin-61.677
 Marshall Islands-47.184
 Cook Islands-39.235
This statistic has no better end: the two ends describe size, not success.
Highest on each continent
- AfricaSouth Sudan39.622
- Americas
 British Virgin Islands15.057
 - AsiaSyria32.097
- Europe
 Montenegro18.941
 - Oceania
 Australia5.302
 - Every region
02Every measured country
Net migration rate on a map
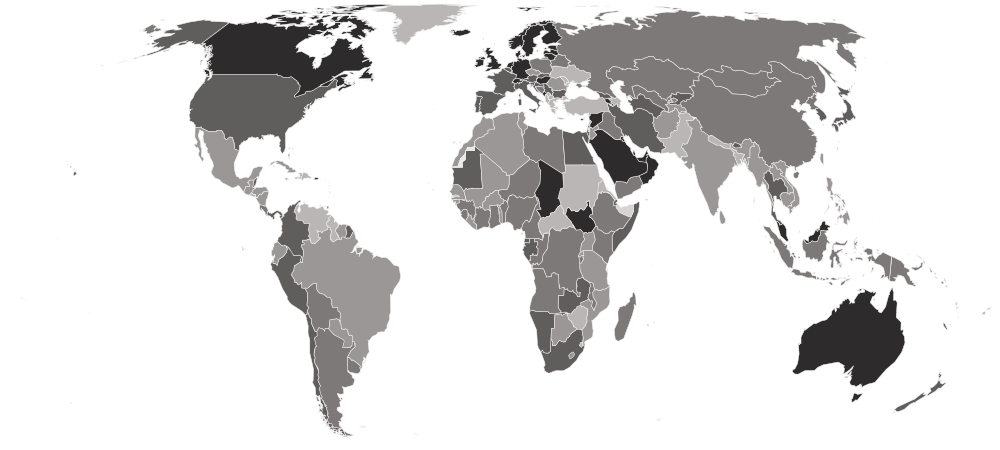
Each country is shaded by its value, in five groups holding the same number of countries. Hover a country for its value, or select it to open its profile. Below the map, each continent’s middle country.
Darker is a higher value. This statistic has no better end, so the shades describe size, not success.
- -61.677–-2.731
- -2.715–-0.474
- -0.473–0.195
- 0.274–4.138
- 4.178–39.622
- No reading in 2023
- Europe
2.572
the middle country, of 48 measured · 49 members
Montenegro18.941 Kosovo-16.914
Highest and lowest reading in Europe.
- Asia
-0.133
the middle country, of 51 measured · 52 members
Syria32.097 Nepal-13.800
Highest and lowest reading in Asia.
- Americas
-0.264
the middle country, of 48 measured · 48 members
British Virgin Islands15.057Saint Martin-61.677Highest and lowest reading in Americas.
- Africa
-0.287
the middle country, of 54 measured · 55 members
South Sudan39.622 Sudan-26.977
Highest and lowest reading in Africa.
- Oceania
-3.660
the middle country, of 21 measured · 21 members
Australia5.302Marshall Islands-47.184Highest and lowest reading in Oceania.
- Every region
22 sub-regions, highest middle country first
- Northern Europe
6.650
the middle country, of 12 measured · 13 members
 Lithuania15.744
 Isle of Man2.329
Highest and lowest reading in Northern Europe.
- Western Europe
5.084
the middle country, of 9 measured · 9 members
 Luxembourg8.878
 Austria0.528
Highest and lowest reading in Western Europe.
- Western Asia
3.773
the middle country, of 18 measured · 19 members
Syria32.097 Azerbaijan-8.153
Highest and lowest reading in Western Asia.
- Southern Europe
2.486
the middle country, of 17 measured · 17 members
Montenegro18.941Kosovo-16.914Highest and lowest reading in Southern Europe.
- Caribbean
0.000
the middle country, of 24 measured · 24 members
British Virgin Islands15.057Saint Martin-61.677Highest and lowest reading in Caribbean.
- Melanesia
0.000
the middle country, of 5 measured · 5 members
 Solomon Islands2.045
 Fiji-3.559
Highest and lowest reading in Melanesia.
- Eastern Asia
-0.038
the middle country, of 8 measured · 8 members
 Macau12.336
 Taiwan-1.406
Highest and lowest reading in Eastern Asia.
- Middle Africa
-0.142
the middle country, of 9 measured · 9 members
 Chad25.717
 Central African Republic-2.849
Highest and lowest reading in Middle Africa.
- Central Asia
-0.168
the middle country, of 5 measured · 5 members
 Turkmenistan2.037
 Tajikistan-1.925
Highest and lowest reading in Central Asia.
- Eastern Africa
-0.228
the middle country, of 18 measured · 19 members
South Sudan39.622 Zimbabwe-5.959
Highest and lowest reading in Eastern Africa.
- Eastern Europe
-0.268
the middle country, of 10 measured · 10 members
 Hungary5.081
 Ukraine-7.950
Highest and lowest reading in Eastern Europe.
- Central America
-0.484
the middle country, of 8 measured · 8 members
 Panama1.629
 El Salvador-3.685
Highest and lowest reading in Central America.
- Western Africa
-0.513
the middle country, of 16 measured · 16 members
 Mauritania0.597
 Cabo Verde-2.347
Highest and lowest reading in Western Africa.
- South-eastern Asia
-0.646
the middle country, of 11 measured · 11 members
 Malaysia5.155
 Timor-Leste-4.060
Highest and lowest reading in South-eastern Asia.
- South America
-0.790
the middle country, of 12 measured · 12 members
 Chile3.188
 Guyana-7.456
Highest and lowest reading in South America.
- Northern Africa
-0.807
the middle country, of 6 measured · 6 members
 Egypt2.663Sudan-26.977
Highest and lowest reading in Northern Africa.
- Southern Asia
-1.219
the middle country, of 9 measured · 9 members
 Iran2.892Nepal-13.800
Highest and lowest reading in Southern Asia.
- Southern Africa
-2.236
the middle country, of 5 measured · 5 members
 Namibia3.940
 Eswatini-6.948
Highest and lowest reading in Southern Africa.
- Micronesia
-10.069
the middle country, of 7 measured · 7 members
 Palau-1.072Marshall Islands-47.184
Highest and lowest reading in Micronesia.
- Polynesia
-20.775
the middle country, of 7 measured · 7 members
 Niue0.000Cook Islands-39.235
Highest and lowest reading in Polynesia.
- Australia and New Zealand
2 of 2 measured — too few for a middle: Australia, New Zealand.
Australia5.302 New Zealand4.138
Highest and lowest reading in Australia and New Zealand.
- Northern America
4 of 4 measured — too few for a middle: Bermuda, Canada, Greenland, United States.
 Canada11.039
 Greenland-5.686
Highest and lowest reading in Northern America.
03The whole field at once
The spread
222 countries, one dot each, on one scale — further right is a higher value. Half the countries are above -0.133; a quarter are above 2.595, and a quarter below -1.862. The bar in each row marks that continent’s middle country.
04All 222 ever measured
Every country
In order, highest value first. No rank or position is shown: too many countries share the same value for an order to mean anything. Neither end is better, and the ends of this table are usually crises rather than choices: the largest outflows and inflows in any year tend to be people fleeing conflict or returning after it. A reading of exactly zero is usually the UN's assumption for a country with little migration data, not evidence that nobody moved.
Showing 25 of 222 countries















































































































































































Values for 2023. The change column compares 2023 with 2022 only; the sparkline covers the recent editions.
051950–2023 · 74 reference years
Over time
Each point is one year's estimate, 1950 to 2023, as restated by the 2024 revision. Migration is the least predictable part of population change, and the line can jump in a single year when a war drives people out or brings refugees home.
- the middle country
- the middle half of countries
- the middle of the 222 countries measured every time
- each continent’s middle country
The same, year by year
| Year | Countries | Middle country | Middle half | Measured every time |
|---|---|---|---|---|
| 2023 | 222 | -0.133 | -1.862 – 2.595 | -0.133 |
| 2022 | 222 | -0.039 | -1.800 – 4.611 | -0.039 |
| 2021 | 222 | -0.257 | -1.900 – 2.251 | -0.257 |
| 2020 | 222 | -0.013 | -1.624 – 2.095 | -0.013 |
| 2019 | 222 | -0.266 | -3.350 – 2.885 | -0.266 |
| 2018 | 222 | -0.132 | -3.229 – 3.336 | -0.132 |
| 2017 | 222 | -0.145 | -3.448 – 2.709 | -0.145 |
| 2016 | 222 | -0.106 | -4.082 – 2.502 | -0.106 |
| 2015 | 222 | -0.472 | -3.756 – 2.770 | -0.472 |
| 2014 | 222 | -0.466 | -3.732 – 2.602 | -0.466 |
| 2013 | 222 | -0.229 | -3.700 – 2.635 | -0.229 |
| 2012 | 222 | -0.652 | -4.261 – 2.229 | -0.652 |
| 2011 | 222 | -0.424 | -4.268 – 2.338 | -0.424 |
| 2010 | 222 | -0.441 | -4.732 – 1.947 | -0.441 |
| 2009 | 222 | -0.265 | -4.856 – 2.759 | -0.265 |
| 2008 | 222 | -0.265 | -4.539 – 3.145 | -0.265 |
| 2007 | 222 | -0.621 | -4.547 – 3.137 | -0.621 |
| 2006 | 222 | -0.708 | -4.867 – 3.007 | -0.708 |
| 2005 | 222 | -0.671 | -4.502 – 2.464 | -0.671 |
| 2004 | 222 | -0.491 | -4.226 – 2.873 | -0.491 |
| 2003 | 222 | -0.698 | -4.934 – 3.195 | -0.698 |
| 2002 | 222 | -0.676 | -4.491 – 3.416 | -0.676 |
| 2001 | 222 | -0.441 | -4.718 – 3.309 | -0.441 |
| 2000 | 222 | -0.658 | -4.621 – 3.238 | -0.658 |
| 1999 | 222 | -0.556 | -4.609 – 2.939 | -0.556 |
| 1998 | 222 | -0.470 | -4.310 – 3.163 | -0.470 |
| 1997 | 222 | -0.645 | -4.738 – 2.870 | -0.645 |
| 1996 | 222 | -0.867 | -4.385 – 2.894 | -0.867 |
| 1995 | 222 | -0.948 | -5.143 – 3.378 | -0.948 |
| 1994 | 222 | -1.147 | -6.411 – 2.879 | -1.147 |
| 1993 | 222 | -0.619 | -6.396 – 3.721 | -0.619 |
| 1992 | 222 | -0.421 | -5.871 – 3.460 | -0.421 |
| 1991 | 222 | -0.516 | -5.498 – 2.847 | -0.516 |
| 1990 | 222 | -0.830 | -5.681 – 2.297 | -0.830 |
| 1989 | 222 | -0.683 | -4.447 – 1.661 | -0.683 |
| 1988 | 222 | -0.510 | -3.871 – 2.075 | -0.510 |
| 1987 | 222 | -0.308 | -3.767 – 2.530 | -0.308 |
| 1986 | 222 | -0.358 | -3.430 – 2.196 | -0.358 |
| 1985 | 222 | -0.449 | -3.396 – 2.084 | -0.449 |
| 1984 | 222 | -0.455 | -3.350 – 1.972 | -0.455 |
| 1983 | 222 | -0.438 | -4.105 – 1.753 | -0.438 |
| 1982 | 222 | -0.728 | -4.231 – 1.954 | -0.728 |
| 1981 | 222 | -0.798 | -4.159 – 1.678 | -0.798 |
| 1980 | 222 | -0.752 | -4.385 – 2.273 | -0.752 |
| 1979 | 222 | -0.950 | -4.998 – 1.731 | -0.950 |
| 1978 | 222 | -0.649 | -4.892 – 1.921 | -0.649 |
| 1977 | 222 | -0.551 | -4.175 – 2.189 | -0.551 |
| 1976 | 222 | -0.678 | -4.728 – 1.517 | -0.678 |
| 1975 | 222 | -0.672 | -4.488 – 1.898 | -0.672 |
| 1974 | 222 | -0.491 | -3.808 – 1.695 | -0.491 |
| 1973 | 222 | -0.569 | -3.850 – 1.806 | -0.569 |
| 1972 | 222 | -0.354 | -3.560 – 1.949 | -0.354 |
| 1971 | 222 | -0.495 | -3.516 – 1.852 | -0.495 |
| 1970 | 222 | -0.638 | -3.570 – 1.996 | -0.638 |
| 1969 | 222 | -0.550 | -3.909 – 2.601 | -0.550 |
| 1968 | 222 | -0.306 | -3.447 – 2.458 | -0.306 |
| 1967 | 222 | -0.444 | -4.028 – 2.071 | -0.444 |
| 1966 | 222 | -0.404 | -3.953 – 2.356 | -0.404 |
| 1965 | 222 | -0.431 | -4.107 – 2.219 | -0.431 |
| 1964 | 222 | -0.193 | -3.875 – 2.362 | -0.193 |
| 1963 | 222 | -0.064 | -4.123 – 2.199 | -0.064 |
| 1962 | 222 | -0.124 | -4.979 – 1.898 | -0.124 |
| 1961 | 222 | -0.020 | -4.461 – 1.735 | -0.020 |
| 1960 | 222 | -0.078 | -4.912 – 1.235 | -0.078 |
| 1959 | 222 | -0.052 | -3.364 – 1.331 | -0.052 |
| 1958 | 222 | -0.304 | -3.323 – 1.167 | -0.304 |
| 1957 | 222 | -0.250 | -3.297 – 1.224 | -0.250 |
| 1956 | 222 | -0.331 | -3.188 – 1.219 | -0.331 |
| 1955 | 222 | -0.323 | -3.360 – 0.888 | -0.323 |
| 1954 | 222 | -0.302 | -3.193 – 0.680 | -0.302 |
| 1953 | 222 | -0.245 | -2.978 – 0.474 | -0.245 |
| 1952 | 222 | 0.000 | -3.011 – 0.559 | 0.000 |
| 1951 | 222 | 0.000 | -2.870 – 0.595 | 0.000 |
| 1950 | 222 | 0.000 | -2.066 – 1.486 | 0.000 |
062022 → 2023
Who rose and fell
The biggest changes in value between the two newest editions — reference years recalculated in one report, not two separate publications. Places are shown second, because they also move when other countries do.
Rose most
before → after- Ukraine-138.846 → -7.950+130.896
- South Sudan3.653 → 39.622+35.969
- Chad1.987 → 25.717+23.730
 Afghanistan-15.954 → -1.181+14.773
 Armenia13.191 → 25.481+12.290
222 countries were measured in both 2022 and 2023.
07Across every edition
Net migration rate in records
The extremes of the statistic. A record reached by more than one country names none of them.
Highest reading on record
357.140
Net migrants per 1,000 population
Lowest reading on record
-709.899
Net migrants per 1,000 population
Biggest rise between editions
+1,050.752
-709.899 → 340.853
Biggest fall between editions
−725.522
15.623 → -709.899
Biggest change since first measured
+44.785
-26.875 → 17.910
Highest most often
15 of 74
editions, alone at the first-listed end
08The measure
About net migration rate
The net migration rate is the number of people who moved into a country in a year minus the number who left, for every 1,000 people living there. A positive figure means more arrivals than departures; a negative one means more people left than came.
What the number is: Net migrants per 1,000 population.
What it does not measure
It is arrivals minus departures, so it says nothing about how many people moved in total; a country with large flows both ways can read close to zero.
09Where it fits
Connections
Its part in the Country Index, the statistics whose values line up most closely with it across countries, and others on the same subject.
In the Country Index
Context, with no vote
This statistic is published in full under Mobility & Trade and People & Population, but does not help decide any Country Index standing.
Mobility & TradePeople & PopulationWhich statistics vote, and why
Moves with
Where net migration rate is higher, these tend to be higher too.
- Global Innovation IndexWorld Intellectual Property Organization · 139 countries in commonρ 0.55
- Upper Secondary AttainmentUIS · 95 countries in commonρ 0.55
- Account Ownership at a Financial InstitutionKeyWorld Bank Group · 139 countries in commonρ 0.54
Moves against
Where net migration rate is higher, these tend to be lower.
- Youth Not in Education, Employment or TrainingILO · 97 countries in commonρ −0.55
- Informal Employment RateILO · 97 countries in commonρ −0.54
- Agriculture, Forestry and Fishing Value Added (% of GDP)World Bank Group · 158 countries in commonρ −0.52
Rank correlation (ρ, from −1 to 1) across countries, on each statistic’s newest edition, out of 190 statistics sharing at least 80 countries with this one. Two statistics that move together do not cause each other.
10Keep reading
Explore further
The subject
The countries at either end
11Questions
Net migration rate: questions and answers
Which country has the highest net migration rate?
South Sudan, at 39.622, among the 222 countries compared in 2023.
Which country has the lowest net migration rate?
Saint Martin, at -61.677, among the 222 countries compared in 2023.
How many countries does the Net Migration Rate cover?
222 in 2023.
What is the world average net migration rate?
This site does not calculate a world average, which would depend on how countries are weighted. In the middle country of the 222 compared in 2023, the figure was -0.133.
Is this UN DESA Population Division’s own ranking?
No ranking is shown. UN DESA Population Division publishes values only, and too many countries share the same value for an ordering to mean anything, so none is derived.
How often is the Net Migration Rate published?
This site holds 74 reference years, 1950–2023, all recalculated in UN DESA Population Division’s 2024 report on one method — not 74 separate publications.
Where does the data come from, and can I download it?
From UN DESA Population Division, under CC BY 3.0 IGO. From World Population Prospects 2024, read from the Population Division's own CSV download. Migration is the component the UN estimates with least direct evidence, often as the residual between population counts and births and deaths. Projections are excluded. Every edition is on this site’s Datasets pages as a full table, and downloads as a CSV file with every value unrounded.
12Method
Sources, method and citation
Source
Net Migration Rate — UN DESA Population Division
From World Population Prospects 2024, read from the Population Division's own CSV download. Migration is the component the UN estimates with least direct evidence, often as the residual between population counts and births and deaths. Projections are excluded.
Newest edition
Report year 2023Data year 2023
Cite the source as: United Nations, Department of Economic and Social Affairs, Population Division. World Population Prospects 2024. New York: United Nations.
Licence: CC BY 3.0 IGO, checked 2026-09-26.
How this page reads the numbers
- No rank or position is shown: UN DESA Population Division publishes values only, and too many countries share the same value for an ordering to mean anything.
- This statistic has no better end, so the page describes higher and lower values and never calls a country a leader.
- A country is named at an end only when it holds that value alone. Where several share it, the page says how many and names none first.
- Values are stored exactly as published and trimmed only for display. “The middle country” is the median of the countries measured, not a world average.
The file itself, column by column — where it came from, what each column holds, and every edition as a CSV — is on its dataset page.
Cite this page
Nations Inquiry (2026). Net migration rate by country: Net Migration Rate, data from UN DESA Population Division. https://nationsinquiry.com/statistics/net-migration-rate