Loading…
UNHCR, the UN Refugee Agency · Asylum-Seekers by Country of Asylum
Asylum-seekers by country
How many people are waiting for an asylum decision in each country?
Of the 177 countries compared in 2025, United States had the highest reading, 3,718,945, and 20 countries shared the lowest reading, 0. In the middle country the figure was 1,836. Among the 144 countries measured in every edition since 2000, the middle one moved from 198 to 4,109.
Asylum-seekers · 2025
Context statistic

Highest of 177United States
3,718,945012025 · values only
The highest and the lowest
The three countries with the highest values of 177 compared, the three with the lowest, and the highest on each continent. This statistic has no better end, so no country is shown as leading.
- 1
- 2

- 3

Lowest in 2025



This statistic has no better end: the two ends describe size, not success.
02Every measured country
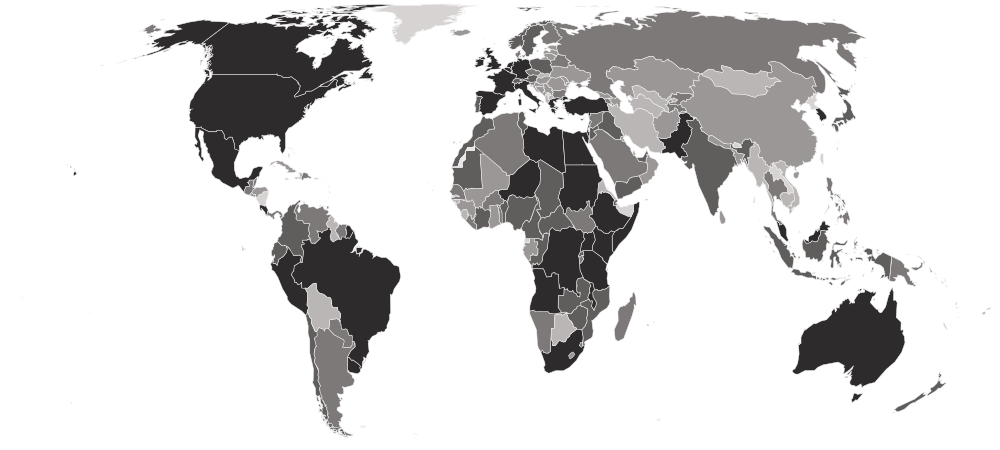
Asylum-seekers on a map
Each country is shaded by its value, in five groups holding the same number of countries. Hover a country for its value, or select it to open its profile. Below the map, each continent’s middle country.
Darker is a higher value. This statistic has no better end, so the shades describe size, not success.
- 0–38
- 40–660
- 722–4,282
- 4,584–23,369
- 25,251–3,718,945
- No reading in 2025 (15 measured in an earlier edition)
- Africa
8,109
the middle country, of 51 measured · 55 members
Egypt878,2683 share 0
Highest and lowest reading in Africa.
- Oceania
1,607
the middle country, of 6 measured · 21 members
 Australia82,925
 Vanuatu7
Highest and lowest reading in Oceania.
- Europe
1,317
the middle country, of 41 measured · 49 members
 Germany297,503
 Monaco0
Highest and lowest reading in Europe.
- Americas
1,303
the middle country, of 36 measured · 48 members
United States3,718,9458 share 0
Highest and lowest reading in Americas.
- Asia
611
the middle country, of 43 measured · 52 members
 Pakistan119,502
8 share 0
Highest and lowest reading in Asia.
- Every region
21 sub-regions, highest middle country first
- Northern Africa
32,590
the middle country, of 6 measured · 6 members
Egypt878,268 Algeria3,690
Highest and lowest reading in Northern Africa.
- Western Europe
22,014
the middle country, of 9 measured · 9 members
Germany297,503Monaco0Highest and lowest reading in Western Europe.
- Eastern Africa
12,906
the middle country, of 17 measured · 19 members
 Kenya218,646
 Eritrea0
Highest and lowest reading in Eastern Africa.
- Middle Africa
9,371
the middle country, of 7 measured · 9 members
 DR Congo100,112
 Gabon86
Highest and lowest reading in Middle Africa.
- South America
6,256
the middle country, of 12 measured · 12 members
Peru556,770 Bolivia0
Highest and lowest reading in South America.
- Western Asia
4,144
the middle country, of 17 measured · 19 members
 Türkiye102,497
 Bahrain122
Highest and lowest reading in Western Asia.
- Central America
4,088
the middle country, of 7 measured · 8 members
 Costa Rica178,212
 El Salvador328
Highest and lowest reading in Central America.
- Northern Europe
2,309
the middle country, of 10 measured · 13 members
 United Kingdom144,747
 Lithuania156
Highest and lowest reading in Northern Europe.
- Southern Africa
1,326
the middle country, of 5 measured · 5 members
 South Africa82,358
 Botswana21
Highest and lowest reading in Southern Africa.
- Western Africa
1,132
the middle country, of 16 measured · 16 members
 Niger50,004
2 share 0
Highest and lowest reading in Western Africa.
- Eastern Europe
785
the middle country, of 10 measured · 10 members
 Poland13,848
 Slovakia16
Highest and lowest reading in Eastern Europe.
- Southern Europe
578
the middle country, of 12 measured · 17 members
 Spain248,715
 Albania11
Highest and lowest reading in Southern Europe.
- Eastern Asia
482
the middle country, of 5 measured · 8 members
 South Korea39,106
 Hong Kong0
Highest and lowest reading in Eastern Asia.
- Southern Asia
302
the middle country, of 7 measured · 9 members
Pakistan119,502 Iran0
Iran0Highest and lowest reading in Southern Asia.
- Central Asia
163
the middle country, of 5 measured · 5 members
 Tajikistan3,238
2 share 0
Highest and lowest reading in Central Asia.
- Caribbean
5
the middle country, of 15 measured · 24 members
 Trinidad and Tobago23,369
7 share 0
Highest and lowest reading in Caribbean.
- South-eastern Asia
5
the middle country, of 9 measured · 11 members
 Malaysia63,011
4 share 0
Highest and lowest reading in South-eastern Asia.
- Australia and New Zealand
2 of 2 measured — too few for a middle: Australia, New Zealand.
Australia82,925 New Zealand4,584
Highest and lowest reading in Australia and New Zealand.
- Melanesia
3 of 5 measured — too few for a middle: Fiji, Papua New Guinea, Vanuatu.
 Papua New Guinea3,121Vanuatu7
Highest and lowest reading in Melanesia.
- Micronesia
1 of 7 measured — too few for a middle: Nauru.
 Nauru92
Highest and lowest reading in Micronesia.
- Northern America
2 of 4 measured — too few for a middle: Canada, United States.
United States3,718,945 Canada314,475
Highest and lowest reading in Northern America.
03The whole field at once
The spread
177 countries, one dot each, on one scale — further right is a higher value. Half the countries are above 1,836; a quarter are above 17,039, and a quarter below 153. The bar in each row marks that continent’s middle country.
04All 192 ever measured
Every country
In order, highest value first. No rank or position is shown: too many countries share the same value for an order to mean anything. Neither end is better. This is a stock of undecided claims, not the number of new applications, so a country that decides claims slowly carries a larger figure than one that decides them quickly. A 0 is UNHCR's published figure, but it does not separate a country with no pending claims from one with no functioning asylum procedure.
Showing 25 of 192 countries




















































































































































Values for 2025. The change column compares 2025 with 2024 only; the sparkline covers the recent editions.
052000–2025 · 26 editions
Over time
Each point is one end-of-year count from 2000, the first year UNHCR collected asylum-seeker figures. Because it is a backlog, a rise can mean more arrivals or slower decisions.
- the middle country
- the middle half of countries
- the middle of the 144 countries measured every time
- each continent’s middle country
The same, year by year
| Year | Countries | Middle country | Middle half | Measured every time |
|---|---|---|---|---|
| 2025 | 177 | 1,836 | 153 – 17,039 | 4,109 |
| 2024 | 180 | 1,578 | 113 – 16,246 | 4,336 |
| 2023 | 177 | 1,839 | 122 – 17,695 | 4,077 |
| 2022 | 177 | 1,172 | 122 – 12,473 | 2,695 |
| 2021 | 179 | 1,085 | 62 – 11,791 | 2,330 |
| 2020 | 177 | 1,104 | 80 – 10,693 | 2,169 |
| 2019 | 176 | 1,043 | 90 – 11,665 | 1,662 |
| 2018 | 176 | 831 | 84 – 10,222 | 1,764 |
| 2017 | 174 | 663 | 58 – 7,393 | 1,505 |
| 2016 | 175 | 529 | 51 – 6,547 | 1,515 |
| 2015 | 175 | 422 | 47 – 5,932 | 941 |
| 2014 | 172 | 443 | 68 – 4,912 | 914 |
| 2013 | 171 | 416 | 46 – 3,578 | 900 |
| 2012 | 170 | 407 | 34 – 2,749 | 775 |
| 2011 | 169 | 544 | 42 – 3,008 | 794 |
| 2010 | 167 | 323 | 32 – 2,618 | 677 |
| 2009 | 161 | 490 | 36 – 2,792 | 616 |
| 2008 | 155 | 440 | 34 – 2,581 | 496 |
| 2007 | 154 | 516 | 38 – 2,508 | 558 |
| 2006 | 152 | 375 | 28 – 2,642 | 496 |
| 2005 | 150 | 275 | 42 – 1,933 | 300 |
| 2004 | 148 | 314 | 28 – 2,056 | 336 |
| 2003 | 147 | 318 | 36 – 2,284 | 328 |
| 2002 | 149 | 278 | 15 – 1,574 | 313 |
| 2001 | 151 | 299 | 14 – 1,836 | 349 |
| 2000 | 153 | 143 | 5 – 1,304 | 198 |
062024 → 2025
Who rose and fell
The biggest changes in value between the two newest editions. Places are shown second, because they also move when other countries do.
Rose most
before → after- United States3,184,162 → 3,718,945+534,783
- Egypt638,948 → 878,268+239,320
- DR Congo1,041 → 100,112+99,071
 Ethiopia63,055 → 112,987+49,932
 Brazil74,018 → 119,651+45,633
Fell most
before → after Mexico266,710 → 173,532−93,178
- Pakistan198,852 → 119,502−79,350
 Côte d’Ivoire66,799 → 8,177−58,622
- Türkiye154,083 → 102,497−51,586
- Germany348,903 → 297,503−51,400
176 countries were measured in both 2024 and 2025. The field changed from 180 to 177 countries, so a place can move for reasons that have nothing to do with the country itself.
07Across every edition
Asylum-seekers in records
The extremes of the statistic. A record reached by more than one country names none of them.
Highest reading on record
3,718,945
Asylum-seekers awaiting a decision, end of year (people)
Lowest reading on record
Reached 499 times by 95 countries — shared, so no holder is named
0
Asylum-seekers awaiting a decision, end of year (people)
Biggest rise between editions
+802,678
1,798,790 → 2,601,468
Biggest fall between editions
−877,746
1,096,021 → 218,275
Biggest change since first measured
+3,332,642
386,303 → 3,718,945
Highest most often
15 of 26
editions, alone at the first-listed end
08The measure
About asylum-seekers
How many asylum-seekers were waiting for a decision on their claim for protection in each country at the end of the year. UNHCR, the UN Refugee Agency, compiles it alongside its refugee figures; an asylum-seeker whose claim is accepted becomes a refugee, so the two are read together.
What the number is: Asylum-seekers awaiting a decision, end of year (people).
What it does not measure
It is the number of claims still undecided at the end of the year, not the number of new applications, so it reflects how fast a country decides claims as well as how many people arrive.
09Where it fits
Connections
Its part in the Country Index, the statistics whose values line up most closely with it across countries, and others on the same subject.
In the Country Index
Context, with no vote
This statistic is published in full under Risk & Resilience and Mobility & Trade, but does not help decide any Country Index standing.
Risk & ResilienceMobility & TradeWhich statistics vote, and why
Moves with
Where asylum-seekers is higher, these tend to be higher too.
- Refugee Population by Country of AsylumUNHCR, the UN Refugee Agency · 177 countries in commonρ 0.71
- Liner Shipping Connectivity IndexKeyUNCTAD · 136 countries in commonρ 0.56
- Total PopulationUN DESA Population Division · 177 countries in commonρ 0.55
Moves against
Where asylum-seekers is higher, these tend to be lower.
- Outbound Mobility Ratio, TertiaryUIS · 103 countries in commonρ −0.52
Rank correlation (ρ, from −1 to 1) across countries, on each statistic’s newest edition, out of 187 statistics sharing at least 80 countries with this one. Two statistics that move together do not cause each other.
10Keep reading
Explore further
The subject
The countries at either end
More from UNHCR, the UN Refugee Agency
11Questions
Asylum-seekers: questions and answers
Which country has the highest asylum-seekers?
United States, at 3,718,945, among the 177 countries compared in 2025.
Which country has the lowest asylum-seekers?
20 countries share the lowest reading, 0, among the 177 compared in 2025, so no single country is named.
How many countries does the Asylum-Seekers by Country of Asylum cover?
177 in 2025, and 192 at least once across all editions. The number measured varies from 147 to 180 between editions.
What is the world average asylum-seekers?
This site does not calculate a world average, which would depend on how countries are weighted. In the middle country of the 177 compared in 2025, the figure was 1,836.
Is this UNHCR, the UN Refugee Agency’s own ranking?
No ranking is shown. UNHCR, the UN Refugee Agency publishes values only, and too many countries share the same value for an ordering to mean anything, so none is derived.
How often is the Asylum-Seekers by Country of Asylum published?
This site holds 26 editions, describing 2000 to 2025.
Where does the data come from, and can I download it?
From UNHCR, the UN Refugee Agency, under CC BY 4.0. Read from the UNHCR Refugee Population Statistics Database through UNHCR's own API, grouped by country of asylum. UNHCR rounds figures below five to the nearest multiple of five to protect confidentiality. Serbia's figure includes Kosovo, as UNHCR publishes it. Every edition is on this site’s Datasets pages as a full table, and downloads as a CSV file with every value unrounded.
12Method
Sources, method and citation
Source
Asylum-Seekers by Country of Asylum — UNHCR, the UN Refugee Agency
Read from the UNHCR Refugee Population Statistics Database through UNHCR's own API, grouped by country of asylum. UNHCR rounds figures below five to the nearest multiple of five to protect confidentiality. Serbia's figure includes Kosovo, as UNHCR publishes it.
Newest edition
Report year 2025Data year 2025
Cite the source as: UNHCR Refugee Population Statistics Database. Geneva: United Nations High Commissioner for Refugees.
Licence: CC BY 4.0, checked 2026-09-26.
How this page reads the numbers
- No rank or position is shown: UNHCR, the UN Refugee Agency publishes values only, and too many countries share the same value for an ordering to mean anything.
- This statistic has no better end, so the page describes higher and lower values and never calls a country a leader.
- A country is named at an end only when it holds that value alone. Where several share it, the page says how many and names none first.
- Values are stored exactly as published and trimmed only for display. “The middle country” is the median of the countries measured, not a world average.
The file itself, column by column — where it came from, what each column holds, and every edition as a CSV — is on its dataset page.
Cite this page
Nations Inquiry (2026). Asylum-seekers by country: Asylum-Seekers by Country of Asylum, data from UNHCR, the UN Refugee Agency. https://nationsinquiry.com/statistics/asylum-seekers-hosted