UNHCR, the UN Refugee Agency · Internally Displaced People of Concern to UNHCR
Internally displaced people by country
How many people uprooted by conflict inside their own country does UNHCR protect or assist?
Of the 38 countries compared in 2025, Sudan had the highest reading, 9,139,309, and Sri Lanka had the lowest reading, 4,099. In the middle country the figure was 489,650.
Share
Internally displaced people · 2025
Context statistic

Highest of 38Sudan
9,139,309012025 · values only
The highest and the lowest
The three countries with the highest values of 38 compared, the three with the lowest, and the highest on each continent. This statistic has no better end, so no country is shown as leading.
- 1
- 2

- 3

02Every measured country
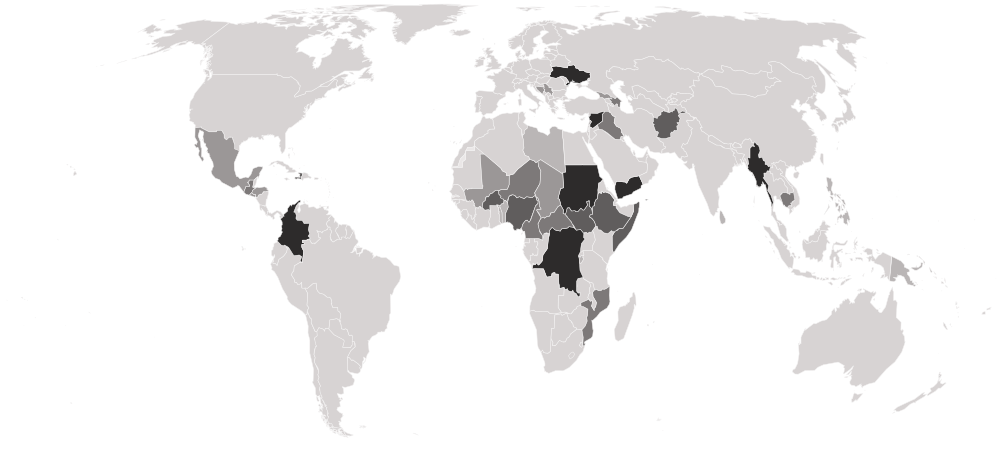
Internally displaced people on a map
Each country is shaded by its value, in five groups holding the same number of countries. Hover a country for its value, or select it to open its profile. Below the map, each continent’s middle country.
Darker is a higher value. This statistic has no better end, so the shades describe size, not success.
- 4,099–70,124
- 71,500–423,845
- 427,479–1,004,257
- 1,277,527–3,544,519
- 3,628,840–9,139,309
- No reading in 2025 (25 measured in an earlier edition)
- Asia
657,155
the middle country, of 11 measured · 52 members
 Syria5,542,227
 Sri Lanka4,099
Highest and lowest reading in Asia.
- Americas
498,423
the middle country, of 6 measured · 48 members
Colombia7,157,716 El Salvador71,500
Highest and lowest reading in Americas.
- Africa
461,745
the middle country, of 17 measured · 55 members
Sudan9,139,309 Burundi6,815
Highest and lowest reading in Africa.
- Europe
3 of 49 measured — too few for a middle: Bosnia and Herzegovina, Serbia, Ukraine.
 Ukraine3,712,000
 Bosnia and Herzegovina94,796
Highest and lowest reading in Europe.
- Oceania
1 of 21 measured — too few for a middle: Papua New Guinea.
 Papua New Guinea70,124
Highest and lowest reading in Oceania.
- Every region
13 sub-regions, highest middle country first
- Eastern Africa
1,277,527
the middle country, of 5 measured · 19 members
 Somalia3,347,408Burundi6,815
Highest and lowest reading in Eastern Africa.
- Western Asia
827,245
the middle country, of 6 measured · 19 members
Syria5,542,227 Lebanon64,417
Highest and lowest reading in Western Asia.
- Western Africa
437,055
the middle country, of 6 measured · 16 members
 Nigeria3,544,519
 Togo10,171
Highest and lowest reading in Western Africa.
- Caribbean
1 of 24 measured — too few for a middle: Haiti.
 Haiti1,430,903
Highest and lowest reading in Caribbean.
- Central America
4 of 8 measured — too few for a middle: El Salvador, Guatemala, Honduras, Mexico.
 Guatemala573,000El Salvador71,500
Highest and lowest reading in Central America.
- Eastern Europe
1 of 10 measured — too few for a middle: Ukraine.
Ukraine3,712,000Highest and lowest reading in Eastern Europe.
- Melanesia
1 of 5 measured — too few for a middle: Papua New Guinea.
Papua New Guinea70,124Highest and lowest reading in Melanesia.
- Middle Africa
4 of 9 measured — too few for a middle: Cameroon, Central African Republic, Chad, DR Congo.
DR Congo5,669,479 Chad219,595
Highest and lowest reading in Middle Africa.
- Northern Africa
2 of 6 measured — too few for a middle: Libya, Sudan.
Sudan9,139,309 Libya32,791
Highest and lowest reading in Northern Africa.
- South America
1 of 12 measured — too few for a middle: Colombia.
Colombia7,157,716Highest and lowest reading in South America.
- South-eastern Asia
3 of 11 measured — too few for a middle: Cambodia, Myanmar, Philippines.
 Myanmar3,628,840
 Philippines43,500
Highest and lowest reading in South-eastern Asia.
- Southern Asia
2 of 9 measured — too few for a middle: Afghanistan, Sri Lanka.
 Afghanistan3,199,023Sri Lanka4,099
Highest and lowest reading in Southern Asia.
- Southern Europe
2 of 17 measured — too few for a middle: Bosnia and Herzegovina, Serbia.
 Serbia209,453Bosnia and Herzegovina94,796
Highest and lowest reading in Southern Europe.
03The whole field at once
The spread
38 countries, one dot each, on one scale — further right is a higher value. Half the countries are above 489,650; a quarter are above 2,993,767, and a quarter below 123,460. The bar in each row marks that continent’s middle country.
Log scale: each gridline is ten times the one before, so countries of very different sizes can be seen on one line.
04All 63 ever measured
Every country
In order, highest value first. No rank or position is shown: too many countries share the same value for an order to mean anything. Only countries where UNHCR counts internally displaced people are listed, so a country missing from the table may still have many — people displaced by disasters are never included, nor those in countries without a UNHCR operation. Neither end is better: the largest figures mark the largest conflict crises, and a fall can mean people went home or simply moved beyond UNHCR's reach.
Showing 25 of 63 countries






































Values for 2025. The change column compares 2025 with 2024 only; the sparkline covers the recent editions.
051993–2025 · 33 editions
Over time
Each point is one end-of-year count from 1993, as UNHCR's database currently holds it. The world total nearly doubled between 2005 and 2006, partly because UNHCR took on a wider role for internally displaced people that year, so early and later years are not strictly comparable. A country can also enter or leave the series when UNHCR starts or ends its work there.
- the middle country
- the middle half of countries
- each continent’s middle country
The same, year by year
| Year | Countries | Middle country | Middle half |
|---|---|---|---|
| 2025 | 38 | 489,650 | 123,460 – 2,993,767 |
| 2024 | 38 | 488,390 | 101,491 – 2,967,916 |
| 2023 | 36 | 433,271 | 121,411 – 2,761,333 |
| 2022 | 34 | 587,229 | 173,787 – 2,908,125 |
| 2021 | 35 | 654,839 | 119,822 – 2,492,368 |
| 2020 | 34 | 512,121 | 166,031 – 2,314,194 |
| 2019 | 33 | 355,672 | 180,516 – 1,733,628 |
| 2018 | 31 | 370,306 | 129,149 – 1,992,524 |
| 2017 | 32 | 295,023 | 105,867 – 1,853,798 |
| 2016 | 29 | 375,016 | 124,342 – 1,853,924 |
| 2015 | 28 | 442,979 | 127,584 – 1,647,607 |
| 2014 | 24 | 530,715 | 202,962 – 1,443,276 |
| 2013 | 24 | 318,856 | 83,112 – 909,348 |
| 2012 | 26 | 312,724 | 90,871 – 718,581 |
| 2011 | 26 | 251,106 | 115,750 – 533,354 |
| 2010 | 24 | 251,107 | 129,650 – 682,654 |
| 2009 | 22 | 375,820 | 177,148 – 922,108 |
| 2008 | 23 | 230,670 | 112,265 – 768,478 |
| 2007 | 23 | 197,000 | 73,500 – 854,524 |
| 2006 | 24 | 179,453 | 109,515 – 692,247 |
| 2005 | 16 | 236,036 | 116,389 – 444,636 |
| 2004 | 13 | 309,240 | 159,549 – 498,566 |
| 2003 | 12 | 293,702 | 147,712 – 422,482 |
| 2002 | 16 | 261,705 | 79,275 – 394,103 |
| 2001 | 15 | 263,600 | 21,701 – 508,122 |
| 2000 | 17 | 272,101 | 56,000 – 525,000 |
| 1999 | 13 | 258,625 | 52,390 – 500,000 |
| 1998 | 16 | 245,000 | 121,219 – 582,997 |
| 1997 | 18 | 200,000 | 44,291 – 326,949 |
| 1996 | 18 | 200,000 | 42,000 – 308,460 |
| 1995 | 16 | 199,100 | 66,425 – 284,300 |
| 1994 | 19 | 220,000 | 80,950 – 305,400 |
| 1993 | 11 | 265,000 | 82,500 – 526,000 |
062024 → 2025
Who rose and fell
The biggest changes in value between the two newest editions. Places are shown second, because they also move when other countries do.
Rose most
before → after- Haiti1,037,463 → 1,430,903+393,440
 South Sudan944,631 → 1,277,527+332,896
 Honduras247,090 → 423,845+176,755
- Colombia7,031,498 → 7,157,716+126,218
- Myanmar3,513,867 → 3,628,840+114,973
Fell most
before → after- Sudan11,559,970 → 9,139,309−2,420,661
- Syria7,408,909 → 5,542,227−1,866,682
- DR Congo6,905,511 → 5,669,479−1,236,032
- Somalia3,861,643 → 3,347,408−514,235
 Mozambique577,545 → 461,745−115,800
36 countries were measured in both 2024 and 2025.
07Across every edition
Internally displaced people in records
The extremes of the statistic. A record reached by more than one country names none of them.
Highest reading on record
11,559,970
Internally displaced people protected or assisted by UNHCR, end of year (people)
Lowest reading on record
11
Internally displaced people protected or assisted by UNHCR, end of year (people)
Biggest rise between editions
+5,500,105
3,552,717 → 9,052,822
Biggest fall between editions
−2,420,661
11,559,970 → 9,139,309
Biggest change since first measured
+8,477,007
662,302 → 9,139,309
Highest most often
18 of 33
editions, alone at the first-listed end
08The measure
About internally displaced people
How many people forced from their homes by conflict, but still inside their own country, UNHCR, the UN Refugee Agency, protects or assists at the end of each year. It is UNHCR's own count of internally displaced people, which covers only the crises where UNHCR works, not every displaced person in the world.
What the number is: Internally displaced people protected or assisted by UNHCR, end of year (people).
What it does not measure
It counts only conflict-displaced people whom UNHCR protects or assists, so people displaced by disasters, and those in countries without a UNHCR operation, are left out; a country with no figure is not a country without displaced people.
09Where it fits
Connections
Its part in the Country Index, the statistics whose values line up most closely with it across countries, and others on the same subject.
In the Country Index
Context, with no vote
This statistic is published in full under Peace & Security and Risk & Resilience, but does not help decide any Country Index standing.
Peace & SecurityRisk & ResilienceWhich statistics vote, and why
Moves with
Where internally displaced people is higher, these tend to be higher too.
No statistic lines up this closely.
Moves against
Where internally displaced people is higher, these tend to be lower.
No statistic lines up this closely.
Rank correlation (ρ, from −1 to 1) across countries, on each statistic’s newest edition, out of 0 statistics sharing at least 80 countries with this one. Two statistics that move together do not cause each other.
10Keep reading
Explore further
The subject
11Questions
Internally displaced people: questions and answers
Which country has the highest internally displaced people?
Sudan, at 9,139,309, among the 38 countries compared in 2025.
Which country has the lowest internally displaced people?
Sri Lanka, at 4,099, among the 38 countries compared in 2025.
How many countries does the Internally Displaced People of Concern to UNHCR cover?
38 in 2025, and 63 at least once across all editions. The number measured varies from 11 to 38 between editions.
What is the world average internally displaced people?
This site does not calculate a world average, which would depend on how countries are weighted. In the middle country of the 38 compared in 2025, the figure was 489,650.
Is this UNHCR, the UN Refugee Agency’s own ranking?
No ranking is shown. UNHCR, the UN Refugee Agency publishes values only, and too many countries share the same value for an ordering to mean anything, so none is derived.
How often is the Internally Displaced People of Concern to UNHCR published?
This site holds 33 editions, describing 1993 to 2025.
Where does the data come from, and can I download it?
From UNHCR, the UN Refugee Agency, under CC BY 4.0. Read from the UNHCR Refugee Population Statistics Database through UNHCR's own API. Only UNHCR's own figures are used: the separate figures of the Internal Displacement Monitoring Centre, which UNHCR also serves, are not. UNHCR records a zero for every country where it counts no internally displaced people; those zeros are left out rather than printed as none. UNHCR rounds figures below five to the nearest multiple of five. Every edition is on this site’s Datasets pages as a full table, and downloads as a CSV file with every value unrounded.
12Method
Sources, method and citation
Source
Internally Displaced People of Concern to UNHCR — UNHCR, the UN Refugee Agency
Read from the UNHCR Refugee Population Statistics Database through UNHCR's own API. Only UNHCR's own figures are used: the separate figures of the Internal Displacement Monitoring Centre, which UNHCR also serves, are not. UNHCR records a zero for every country where it counts no internally displaced people; those zeros are left out rather than printed as none. UNHCR rounds figures below five to the nearest multiple of five.
Newest edition
Report year 2025Data year 2025
Cite the source as: UNHCR Refugee Population Statistics Database. Geneva: United Nations High Commissioner for Refugees.
Licence: CC BY 4.0, checked 2026-10-03.
How this page reads the numbers
- No rank or position is shown: UNHCR, the UN Refugee Agency publishes values only, and too many countries share the same value for an ordering to mean anything.
- This statistic has no better end, so the page describes higher and lower values and never calls a country a leader.
- A country is named at an end only when it holds that value alone. Where several share it, the page says how many and names none first.
- Values are stored exactly as published and trimmed only for display. “The middle country” is the median of the countries measured, not a world average.
The file itself, column by column — where it came from, what each column holds, and every edition as a CSV — is on its dataset page.
Cite this page
Nations Inquiry (2026). Internally displaced people by country: Internally Displaced People of Concern to UNHCR, data from UNHCR, the UN Refugee Agency. https://nationsinquiry.com/statistics/idps-of-concern