JRC · Tropical Moist Forest Deforestation
Tropical deforestation by country
How much tropical moist forest is cleared or degraded each year?
Of the 100 countries compared in 2025, Brazil had the highest reading, 0.707770, and 3 countries shared the lowest reading, 0.000000. In the middle country the figure was 0.000803. Among the 100 countries measured in every edition since 1990, the middle one moved from 0.002887 to 0.000803.
Share
Part ofEnvironment & Sustainability
Tropical deforestation · 2025
Context statistic

Highest of 100Brazil
0.707770012025 · values only
The highest and the lowest
The three countries with the highest values of 100 compared, the three with the lowest, and the highest on each continent. This statistic has no better end, so no country is shown as leading.
- 1
- 2

- 3

Lowest in 2025
 United States0.000000
 Uruguay0.000000
 Argentina0.000000
This statistic has no better end: the two ends describe size, not success.
Highest on each continent
- AfricaDR Congo0.321233
- AmericasBrazil0.707770
- AsiaIndonesia0.565640
- Oceania
 Papua New Guinea0.022795
 - Every region
02Every measured country
Tropical deforestation on a map
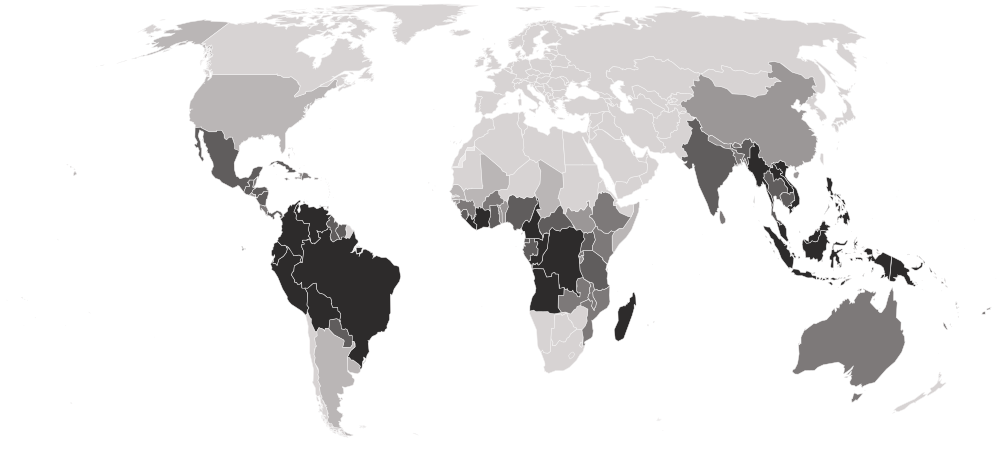
Each country is shaded by its value, in five groups holding the same number of countries. Hover a country for its value, or select it to open its profile. Below the map, each continent’s middle country.
Darker is a higher value. This statistic has no better end, so the shades describe size, not success.
- 0.000000–0.000006
- 0.000007–0.000132
- 0.000191–0.001897
- 0.001947–0.012501
- 0.012677–0.707770
- No reading in 2025 (2 measured in an earlier edition)
- Asia
0.002781
the middle country, of 17 measured · 52 members
Indonesia0.565640 China0.000038
Highest and lowest reading in Asia.
- Africa
0.000998
the middle country, of 36 measured · 55 members
DR Congo0.321233 Seychelles0.000000
Highest and lowest reading in Africa.
- Oceania
0.000538
the middle country, of 6 measured · 21 members
Papua New Guinea0.022795 New Caledonia0.000229
Highest and lowest reading in Oceania.
- Americas
0.000096
the middle country, of 41 measured · 48 members
Brazil0.7077703 share 0.000000
Highest and lowest reading in Americas.
- Every region
12 sub-regions, highest middle country first
- Middle Africa
0.017463
the middle country, of 8 measured · 9 members
DR Congo0.321233 Chad0.000001
Highest and lowest reading in Middle Africa.
- South America
0.014626
the middle country, of 11 measured · 12 members
Brazil0.7077702 share 0.000000
Highest and lowest reading in South America.
- South-eastern Asia
0.012677
the middle country, of 11 measured · 11 members
Indonesia0.565640 Timor-Leste0.000045
Highest and lowest reading in South-eastern Asia.
- Central America
0.002535
the middle country, of 8 measured · 8 members
 Mexico0.005561
 El Salvador0.000025
Highest and lowest reading in Central America.
- Eastern Africa
0.000754
the middle country, of 15 measured · 19 members
 Madagascar0.053990Seychelles0.000000
Highest and lowest reading in Eastern Africa.
- Melanesia
0.000563
the middle country, of 5 measured · 5 members
Papua New Guinea0.022795New Caledonia0.000229Highest and lowest reading in Melanesia.
- Southern Asia
0.000445
the middle country, of 5 measured · 9 members
 India0.009323
 Nepal0.000117
Highest and lowest reading in Southern Asia.
- Western Africa
0.000228
the middle country, of 13 measured · 16 members
 Liberia0.018853
 Mali0.000002
Highest and lowest reading in Western Africa.
- Caribbean
0.000006
the middle country, of 21 measured · 24 members
 Cuba0.001947
 Aruba0.000000
Highest and lowest reading in Caribbean.
- Australia and New Zealand
1 of 2 measured — too few for a middle: Australia.
 Australia0.000336
Highest and lowest reading in Australia and New Zealand.
- Eastern Asia
1 of 8 measured — too few for a middle: China.
China0.000038Highest and lowest reading in Eastern Asia.
- Northern America
1 of 4 measured — too few for a middle: United States.
United States0.000000Highest and lowest reading in Northern America.
03The whole field at once
The spread
100 countries, one dot each, on one scale — further right is a higher value. Half the countries are above 0.000803; a quarter are above 0.007225, and a quarter below 0.000035. The bar in each row marks that continent’s middle country.
04All 102 ever measured
Every country
In order, highest value first. No rank or position is shown: too many countries share the same value for an order to mean anything. Neither end is better: the area cleared grows with the area of forest a country has, so the largest forest countries lead. Read the undisturbed-forest column to see how much forest each figure is set against; many countries on the list hold only a few hectares of this forest type.
Showing 25 of 102 countries















































































Values for 2025. The change column compares 2025 with 2024 only; the sparkline covers the recent editions.
051990–2025 · 36 reference years
Over time
Each point is one year from 1990, all from one release that recalculated the whole series. The newest three years are provisional: until a disturbance has lasted long enough, the maps cannot tell clearing from degradation, so those years move with each release.
- the middle country
- the middle half of countries
- the middle of the 100 countries measured every time
- each continent’s middle country
The same, year by year
| Year | Countries | Middle country | Middle half | Measured every time |
|---|---|---|---|---|
| 2025 | 100 | 0.000803 | 0.000035 – 0.007225 | 0.000803 |
| 2024 | 100 | 0.001114 | 0.000058 – 0.025093 | 0.001114 |
| 2023 | 100 | 0.000853 | 0.000056 – 0.012751 | 0.000853 |
| 2022 | 100 | 0.000517 | 0.000066 – 0.012683 | 0.000517 |
| 2021 | 101 | 0.000928 | 0.000070 – 0.014163 | 0.001046 |
| 2020 | 101 | 0.001430 | 0.000143 – 0.024915 | 0.001488 |
| 2019 | 101 | 0.001657 | 0.000163 – 0.028246 | 0.001696 |
| 2018 | 102 | 0.001422 | 0.000104 – 0.023677 | 0.001892 |
| 2017 | 102 | 0.001920 | 0.000124 – 0.030203 | 0.002036 |
| 2016 | 102 | 0.002596 | 0.000126 – 0.055199 | 0.002843 |
| 2015 | 102 | 0.003690 | 0.000169 – 0.049002 | 0.004015 |
| 2014 | 102 | 0.004204 | 0.000166 – 0.046188 | 0.004497 |
| 2013 | 102 | 0.004995 | 0.000317 – 0.056088 | 0.005566 |
| 2012 | 102 | 0.003167 | 0.000113 – 0.037250 | 0.003231 |
| 2011 | 102 | 0.003824 | 0.000109 – 0.037625 | 0.004464 |
| 2010 | 102 | 0.002911 | 0.000141 – 0.035435 | 0.002946 |
| 2009 | 102 | 0.003236 | 0.000162 – 0.027165 | 0.003661 |
| 2008 | 102 | 0.002569 | 0.000115 – 0.028810 | 0.002917 |
| 2007 | 102 | 0.002128 | 0.000121 – 0.051734 | 0.002331 |
| 2006 | 102 | 0.003311 | 0.000272 – 0.041871 | 0.003766 |
| 2005 | 102 | 0.004876 | 0.000305 – 0.055851 | 0.004913 |
| 2004 | 102 | 0.004249 | 0.000266 – 0.036520 | 0.004704 |
| 2003 | 102 | 0.005595 | 0.000354 – 0.054358 | 0.006211 |
| 2002 | 102 | 0.005850 | 0.000220 – 0.062291 | 0.007104 |
| 2001 | 102 | 0.008343 | 0.000621 – 0.090067 | 0.009010 |
| 2000 | 102 | 0.015889 | 0.000435 – 0.120647 | 0.016039 |
| 1999 | 102 | 0.010641 | 0.000244 – 0.070471 | 0.011565 |
| 1998 | 102 | 0.005100 | 0.000093 – 0.096087 | 0.005220 |
| 1997 | 102 | 0.001922 | 0.000000 – 0.042711 | 0.002236 |
| 1996 | 102 | 0.001599 | 0.000000 – 0.024577 | 0.001827 |
| 1995 | 102 | 0.001259 | 0.000000 – 0.020344 | 0.001372 |
| 1994 | 102 | 0.001205 | 0.000000 – 0.018845 | 0.001357 |
| 1993 | 102 | 0.000715 | 0.000000 – 0.013312 | 0.000800 |
| 1992 | 102 | 0.000661 | 0.000001 – 0.015082 | 0.000845 |
| 1991 | 102 | 0.001937 | 0.000002 – 0.020746 | 0.002266 |
| 1990 | 102 | 0.002750 | 0.000046 – 0.021492 | 0.002887 |
062024 → 2025
Who rose and fell
The biggest changes in value between the two newest editions — reference years recalculated in one report, not two separate publications. Places are shown second, because they also move when other countries do.
Rose most
before → after100 countries were measured in both 2024 and 2025.
07Across every edition
Tropical deforestation in records
The extremes of the statistic. A record reached by more than one country names none of them.
Highest reading on record
4.693765
Tropical moist forest deforested in the year (million hectares)
Lowest reading on record
Reached 310 times by 49 countries — shared, so no holder is named
0.000000
Tropical moist forest deforested in the year (million hectares)
Biggest rise between editions
+2.244290
1.312062 → 3.556352
Biggest fall between editions
−2.170440
4.693765 → 2.523325
Biggest change since first measured
+0.161085
0.061092 → 0.222177
Highest most often
32 of 36
editions, alone at the first-listed end
08The measure
About tropical deforestation
This is the area of tropical moist forest cleared in a country each year, in million hectares, mapped from every Landsat satellite image since 1990 by the European Commission’s Joint Research Centre. Beside it is the forest degraded — logged, burned or thinned but still standing — which the same maps keep separate.
What the number is: Tropical moist forest deforested in the year (million hectares).
09Where it fits
Connections
Its part in the Country Index, the statistics whose values line up most closely with it across countries, and others on the same subject.
In the Country Index
Context, with no vote
This statistic is published in full under Environment & Sustainability, but does not help decide any Country Index standing.
Moves with
Where tropical deforestation is higher, these tend to be higher too.
- Tree Cover LossWorld Resources Institute — Global Forest Watch (data: University of Maryland) · 100 countries in commonρ 0.75
- Hydro Share of Electricity GenerationEmber · 80 countries in commonρ 0.61
- Mangrove AreaGlobal Mangrove Watch (Aberystwyth University, JAXA, soloEO, Wetlands International, The Nature Conservancy) · 81 countries in commonρ 0.60
Moves against
Where tropical deforestation is higher, these tend to be lower.
- Rule of LawKeyWorld Bank Group · 97 countries in commonρ −0.46
- International Migrants as a Share of PopulationUN DESA Population Division · 100 countries in commonρ −0.45
- Control of CorruptionWorld Bank Group · 97 countries in commonρ −0.45
Rank correlation (ρ, from −1 to 1) across countries, on each statistic’s newest edition, out of 219 statistics sharing at least 80 countries with this one. Two statistics that move together do not cause each other.
11Questions
Tropical deforestation: questions and answers
Which country has the highest tropical deforestation?
Brazil, at 0.707770, among the 100 countries compared in 2025.
Which country has the lowest tropical deforestation?
3 countries share the lowest reading, 0.000000, among the 100 compared in 2025, so no single country is named.
How many countries does the Tropical Moist Forest Deforestation cover?
100 in 2025, and 102 at least once across all editions. The number measured varies from 100 to 102 between editions.
What is the world average tropical deforestation?
This site does not calculate a world average, which would depend on how countries are weighted. In the middle country of the 100 compared in 2025, the figure was 0.000803.
Is this European Commission, Joint Research Centre (JRC)’s own ranking?
No ranking is shown. European Commission, Joint Research Centre (JRC) publishes values only, and too many countries share the same value for an ordering to mean anything, so none is derived.
How often is the Tropical Moist Forest Deforestation published?
This site holds 36 reference years, 1990–2025, all recalculated in European Commission, Joint Research Centre (JRC)’s 2026 report on one method — not 36 separate publications.
Where does the data come from, and can I download it?
From European Commission, Joint Research Centre (JRC), under Copernicus free, full and open data (attribution required). From the Joint Research Centre’s own country statistics for its Tropical Moist Forest maps, in million hectares as published. Disputed areas the file lists on their own are not added to any country, and France’s overseas regions are left out. Every edition is on this site’s Datasets pages as a full table, and downloads as a CSV file with every value unrounded.
12Method
Sources, method and citation
Source
Tropical Moist Forest Deforestation — European Commission, Joint Research Centre (JRC)
From the Joint Research Centre’s own country statistics for its Tropical Moist Forest maps, in million hectares as published. Disputed areas the file lists on their own are not added to any country, and France’s overseas regions are left out.
Newest edition
Report year 2025Data year 2025
Cite the source as: Vancutsem, C., Achard, F., Pekel, J.-F., Vieilledent, G., Carboni, S., Simonetti, D., Gallego, J., Aragão, L. E. O. C., Nasi, R. (2021). Long-term (1990–2019) monitoring of forest cover changes in the humid tropics. Science Advances 7: eabe1603. doi:10.1126/sciadv.abe1603. Data: JRC Tropical Moist Forest dataset, vFebruary2026 release.
Licence: Copernicus free, full and open data (attribution required), checked 2026-10-03.
How this page reads the numbers
- No rank or position is shown: European Commission, Joint Research Centre (JRC) publishes values only, and too many countries share the same value for an ordering to mean anything.
- This statistic has no better end, so the page describes higher and lower values and never calls a country a leader.
- A country is named at an end only when it holds that value alone. Where several share it, the page says how many and names none first.
- Values are stored exactly as published and trimmed only for display. “The middle country” is the median of the countries measured, not a world average.
The file itself, column by column — where it came from, what each column holds, and every edition as a CSV — is on its dataset page.
Cite this page
Nations Inquiry (2026). Tropical deforestation by country: Tropical Moist Forest Deforestation, data from European Commission, Joint Research Centre (JRC). https://nationsinquiry.com/statistics/tropical-deforestation