Dataset · JRC
Tropical Moist Forest Deforestation
36 years, 1990–2025 · 100 countries · 5 measures
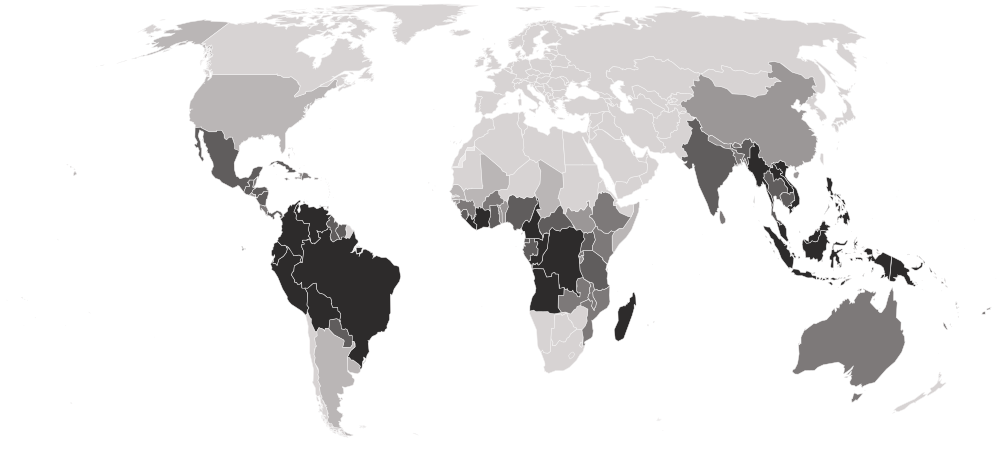
This is the area of tropical moist forest cleared in a country each year, in million hectares, mapped from every Landsat satellite image since 1990 by the European Commission’s Joint Research Centre. Beside it is the forest degraded — logged, burned or thinned but still standing — which the same maps keep separate.
This site holds every year from 1990 to 2025, read from JRC’s own data and stored exactly as published.
Tropical Moist Forest Deforestation · the file
- Newest
- Tropical Moist Forest Deforestation, 2025
- Held
- 36 years · 3,661 rows
- Licence
- Other open terms
0136 years
Every year
Every year comes from JRC’s 2026 release, recalculated on one method. Each opens the full table for that year; each downloads as a CSV.
| Year | Countries | Change | Read | Download |
|---|---|---|---|---|
| Tropical Moist Forest Deforestation, 2025Newest | 100 | ±0 | October 3, 2026 | CSV |
| Tropical Moist Forest Deforestation, 2024 | 100 | ±0 | October 3, 2026 | CSV |
| Tropical Moist Forest Deforestation, 2023 | 100 | ±0 | October 3, 2026 | CSV |
| Tropical Moist Forest Deforestation, 2022 | 100 | −1 | October 3, 2026 | CSV |
| Tropical Moist Forest Deforestation, 2021 | 101 | ±0 | October 3, 2026 | CSV |
| Tropical Moist Forest Deforestation, 2020 | 101 | ±0 | October 3, 2026 | CSV |
| Tropical Moist Forest Deforestation, 2019 | 101 | −1 | October 3, 2026 | CSV |
| Tropical Moist Forest Deforestation, 2018 | 102 | ±0 | October 3, 2026 | CSV |
| Tropical Moist Forest Deforestation, 2017 | 102 | ±0 | October 3, 2026 | CSV |
| Tropical Moist Forest Deforestation, 2016 | 102 | ±0 | October 3, 2026 | CSV |
| Tropical Moist Forest Deforestation, 2015 | 102 | ±0 | October 3, 2026 | CSV |
| Tropical Moist Forest Deforestation, 2014 | 102 | ±0 | October 3, 2026 | CSV |
Show all 36 years
Every year in one file, one row per country per year: tropical-deforestation-all-editions-nations-inquiry.csv
027 columns
What’s in the file
Every column, what it holds, how it is stored and what its values look like — what a reader needs before opening the file.
| Column | What it holds | Stored as | Range, 2025 | Distinct | Empty | Spread |
|---|---|---|---|---|---|---|
CountrycountryName | The country’s name, as this file spells it. | Text | — | 100 | 0 | |
ISO Codecountry_codeIdentifier | The ISO 3166-1 alpha-3 code, added by this site. Every table here joins on it. | Text · 3 letters | — | 100 | 0 | |
Deforested in the year (million hectares)deforestation_mhaHeadline | The headline figure: Tropical moist forest deforested in the year (million hectares). | Number · up to 13 decimals | 0.0000003 share it0.707770 Brazilmiddle 0.000803 Brazilmiddle 0.000803 | 98 | 0 | |
Degraded in the year (million hectares)degradation_mhaMeasure | Area of tropical moist forest newly degraded in the year — logged, burned or thinned but still forest — in million hectares, whether or not it was later cleared. | Number · up to 14 decimals | 0.0000005 share it1.121710Brazilmiddle 0.001738 | 96 | 0 | |
Regrowing forest (million hectares)regrowth_mhaMeasure | Area of previously cleared tropical moist forest growing back, in million hectares; it takes several years to detect, so the newest years read zero. | Number · whole numbers | 0100 share it0100 share itmiddle 0 | 1 | 0 | |
Undisturbed forest (million hectares)undisturbed_mhaMeasure | Area of tropical moist forest with no disturbance detected since 1990, at the end of the year, in million hectares. | Number · up to 13 decimals | 0.000000 Uruguay291.055921Brazilmiddle 0.435131 Uruguay291.055921Brazilmiddle 0.435131 | 100 | 0 | |
Degraded forest (million hectares)degraded_stock_mhaMeasure | Area of tropical moist forest that has been degraded but is still forest, at the end of the year, in million hectares. | Number · up to 13 decimals | 0.000000Uruguay31.914145Brazilmiddle 0.246239 | 100 | 0 |
Profiled from the newest file. Range: the lowest and highest value, with the country holding it when only one does. Spread: countries in ten equal steps from lowest to highest. Neither end is better. The values describe a shape, not a score.
03102 countries across every year
Who is covered
How many countries each year holds, continent by continent, who joined and who left, and which places this site covers that the dataset never has.
| 2014 | 2015 | 2016 | 2017 | 2018 | 2019 | 2020 | 2021 | 2022 | 2023 | 2024 | 2025 | |
|---|---|---|---|---|---|---|---|---|---|---|---|---|
| Africa | 38 | 38 | 38 | 38 | 38 | 37 | 37 | 37 | 36 | 36 | 36 | 36 |
| Americas | 41 | 41 | 41 | 41 | 41 | 41 | 41 | 41 | 41 | 41 | 41 | 41 |
| Asia | 17 | 17 | 17 | 17 | 17 | 17 | 17 | 17 | 17 | 17 | 17 | 17 |
| Europe | 0 | 0 | 0 | 0 | 0 | 0 | 0 | 0 | 0 | 0 | 0 | 0 |
| Oceania | 6 | 6 | 6 | 6 | 6 | 6 | 6 | 6 | 6 | 6 | 6 | 6 |
| All | 102 | 102 | 102 | 102 | 102 | 101 | 101 | 101 | 100 | 100 | 100 | 100 |
The newest 12 of 36 years.
 − São Tomé and Príncipe
 − Sudan
Not in this dataset · 123 places this site covers
JRC gives no figure for these in any year held here. It is the publisher’s choice of scope, and each place’s profile shows what is measured.
 Afghanistan
 Albania
 Algeria
 American Samoa
 Andorra
 Armenia
 Austria
 Azerbaijan
 Bahrain
 Belarus
 Belgium
 Bermuda
 Bosnia and Herzegovina
 Botswana
 Bulgaria
 Cabo Verde
 CanadaChannel Islands
 Chile
Chile Cook Islands
 Croatia
 Curaçao
 Cyprus
 Czechia
 Denmark
 Djibouti
 Egypt
Egypt Eritrea
 Estonia
 Eswatini
 Faroe Islands
 Finland
 France
 French Polynesia
 Georgia
 Germany
 Gibraltar
 Greece
 Greenland
 Guam
Guam Hong Kong
 Hungary
 Iceland
 Iran
Iran Iraq
Iraq Ireland
 Isle of Man
 Israel
 Italy
Italy Japan
Japan Jordan
 Kazakhstan
 Kiribati
 Kosovo
 Kuwait
 Kyrgyzstan
 Latvia
 Lebanon
 Lesotho
 Libya
Libya Liechtenstein
 Lithuania
 Luxembourg
 Macau
Macau Maldives
 Malta
Malta Marshall Islands
 Mauritania
 Micronesia
 Moldova
 Monaco
 Mongolia
 Montenegro
 Morocco
 Namibia
 Nauru
Nauru Netherlands
 New Zealand
 Niger
Niger Niue
Niue North Korea
 North MacedoniaNorthern Cyprus
 Northern Mariana Islands
 Norway
 Oman
Oman Pakistan
 Palau
Palau Palestine
 Poland
 Portugal
 Qatar
Qatar Romania
 Russia
 Saint Martin
 Samoa
Samoa San Marino
 Saudi Arabia
 Serbia
 Sint Maarten
 Slovakia
 SloveniaSomaliland
 South Africa
 South Korea
 Spain
Spain Sweden
 Switzerland
 Syria
Syria Taiwan
 Tajikistan
 Tonga
Tonga Tunisia
 Türkiye
 Turkmenistan
 Tuvalu
 Ukraine
 United Arab Emirates
 United Kingdom
 Uzbekistan
 Vatican City
 Yemen
Yemen Zimbabwe
04Provenance
Where it comes from
The path from the publisher to this page, and what was checked and changed on the way.
1 · Publisher
European Commission, Joint Research Centre (JRC)
2 · Their file
Tropical Moist Forest Deforestation 2025 (JRC TMF, February2026 release)
3 · Read by this site
October 3, 2026
Imported by a script that parses each figure and writes it down unrounded.4 · Stored as
36 files, one per year
Each downloads as a CSV, or every year together as tropical-deforestation-all-editions-nations-inquiry.csv5 · Used on
Its statistic page, and every profile it measures
Precision
The headline is stored to 13 decimals, as published.
Rounded by this site
Never. Tables on screen may show fewer decimals; the files never do.
Changed by this site
Reshaped into one row per country: regional and income-group totals are left out, only the columns listed are kept, each row gets its ISO 3166 code, and some country names are brought to one spelling. No value is recalculated, rescaled or rounded.
From the Joint Research Centre’s own country statistics for its Tropical Moist Forest maps, in million hectares as published. Disputed areas the file lists on their own are not added to any country, and France’s overseas regions are left out.
05Reuse
Licence and credit
What the publisher’s licence lets you do, what it asks of you, and a credit line and citation ready to copy.
Licence · checked October 3, 2026
Copernicus free, full and open data (attribution required)
- Share and redistribute it
- Adapt it and build on it
- Use it commercially
- Credit the publisher
The publisher’s own written permission to reuse, commercial use included. Read the terms before republishing.
In plain words
Free to reuse for any purpose, commercial use included, under the European Union’s open-data rules for its Copernicus programme; the Joint Research Centre asks to be credited and its article cited.
A credit line
Vancutsem, C., Achard, F., Pekel, J.-F., Vieilledent, G., Carboni, S., Simonetti, D., Gallego, J., Aragão, L. E. O. C., Nasi, R. (2021). Long-term (1990–2019) monitoring of forest cover changes in the humid tropics. Science Advances 7: eabe1603. doi:10.1126/sciadv.abe1603. Data: JRC Tropical Moist Forest dataset, vFebruary2026 release.
Cite this dataset
European Commission, Joint Research Centre (JRC). Tropical Moist Forest Deforestation, 1990–2025 [data set]. As held by Nations Inquiry, https://nationsinquiry.com/datasets/tropical-deforestation
The publisher’s own citation: Vancutsem, C., Achard, F., Pekel, J.-F., Vieilledent, G., Carboni, S., Simonetti, D., Gallego, J., Aragão, L. E. O. C., Nasi, R. (2021). Long-term (1990–2019) monitoring of forest cover changes in the humid tropics. Science Advances 7: eabe1603. doi:10.1126/sciadv.abe1603. Data: JRC Tropical Moist Forest dataset, vFebruary2026 release.
Plain-language summary, not legal advice. The licence text is what binds.
06Where it is used
Around the site
Where these numbers appear on this site, and the datasets nearest to it.
Charted
Tropical Moist Forest Deforestation by countryWho is highest, the map, the spread, who rose and fell, and the records.
Subjects
Near neighbours
- CO₂ Emissions per CapitaGlobal Carbon Project · 75 held · 1950–2024
- Ecological FootprintGlobal Footprint Network · 65 held · 1961–2025
- Water StressFAO · 24 held · 2000–2023
07Questions
Tropical Moist Forest Deforestation: questions and answers
What is the Tropical Moist Forest Deforestation?
This is the area of tropical moist forest cleared in a country each year, in million hectares, mapped from every Landsat satellite image since 1990 by the European Commission’s Joint Research Centre. Beside it is the forest degraded — logged, burned or thinned but still standing — which the same maps keep separate.
Which years of the Tropical Moist Forest Deforestation can I download?
All 36, from 1990 to 2025, each as a CSV file, or every year together in one CSV.
Does JRC rank countries on it?
No, and this site does not order it either. The files hold values only.
Can I use it commercially?
Yes, under Copernicus free, full and open data, with credit to JRC. The licence text is linked on this page.