GWIS · Burned Area
Burned area by country
How much land burns in a country each year?
Of the 209 countries compared in 2025, Australia had the highest reading, 50,562,034.820, and 51 countries shared the lowest reading, 0.000. In the middle country the figure was 13,824.019. Among the 209 countries measured in every edition since 2002, the middle one moved from 18,525.048 to 13,824.019.
Burned area · 2025
Context statistic

Highest of 209Australia
50,562,034.820012025 · values only
The highest and the lowest
The three countries with the highest values of 209 compared, the three with the lowest, and the highest on each continent. This statistic has no better end, so no country is shown as leading.
- 1
- 2

- 3

Lowest in 2025
 Samoa0.000
 Vanuatu0.000
 United States Virgin Islands0.000
This statistic has no better end: the two ends describe size, not success.
02Every measured country
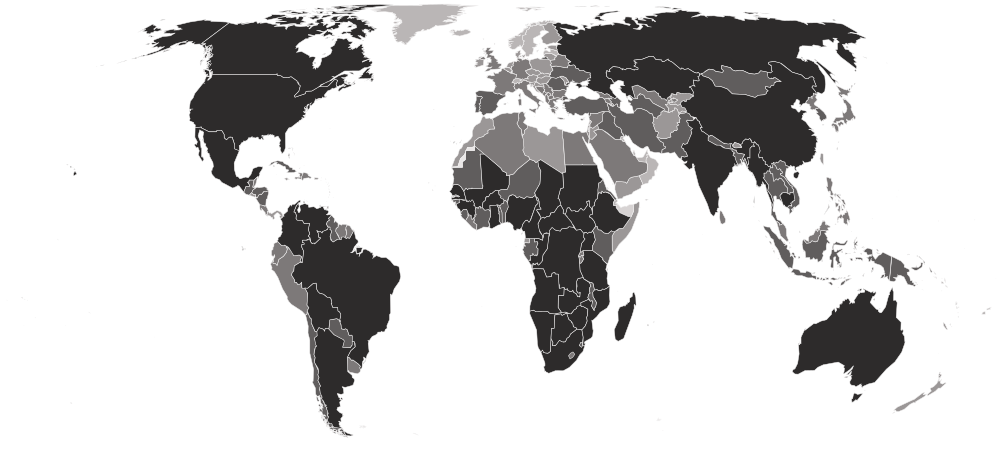
Burned area on a map
Each country is shaded by its value, in five groups holding the same number of countries. Hover a country for its value, or select it to open its profile. Below the map, each continent’s middle country.
Darker is a higher value. This statistic has no better end, so the shades describe size, not success.
- 0.000
- 21.466–4,250.244
- 5,409.400–52,548.445
- 57,485.593–1,193,437.845
- 1,289,733.716–50,562,034.820
- No reading in 2025
- Africa
731,481.631
the middle country, of 54 measured · 55 members
Angola34,832,920.5385 share 0.000
Highest and lowest reading in Africa.
- Asia
12,203.347
the middle country, of 50 measured · 52 members
 India5,299,514.819
8 share 0.000
Highest and lowest reading in Asia.
- Americas
9,681.106
the middle country, of 43 measured · 48 members
 Brazil10,291,659.862
13 share 0.000
Highest and lowest reading in Americas.
- Europe
1,094.760
the middle country, of 45 measured · 49 members
 Russia5,339,033.490
12 share 0.000
Highest and lowest reading in Europe.
- Oceania
0.000
the middle country, of 17 measured · 21 members
Australia50,562,034.82013 share 0.000
Highest and lowest reading in Oceania.
- Every region
22 sub-regions, highest middle country first
- Middle Africa
3,405,516.933
the middle country, of 9 measured · 9 members
Angola34,832,920.538 São Tomé and Príncipe0.000
Highest and lowest reading in Middle Africa.
- Southern Africa
2,151,996.129
the middle country, of 5 measured · 5 members
 Botswana2,590,071.554
 Lesotho33,121.836
Highest and lowest reading in Southern Africa.
- Western Africa
1,010,977.957
the middle country, of 16 measured · 16 members
 Mali7,302,516.341
 Cabo Verde0.000
Highest and lowest reading in Western Africa.
- South America
468,320.845
the middle country, of 12 measured · 12 members
Brazil10,291,659.862 Ecuador7,727.717
Highest and lowest reading in South America.
- Eastern Africa
351,761.179
the middle country, of 18 measured · 19 members
 South Sudan26,577,448.458
3 share 0.000
Highest and lowest reading in Eastern Africa.
- Southern Asia
221,431.157
the middle country, of 8 measured · 9 members
India5,299,514.819 Bhutan1,373.817
Highest and lowest reading in Southern Asia.
- South-eastern Asia
98,721.539
the middle country, of 11 measured · 11 members
 Myanmar4,876,701.622
 Singapore0.000
Highest and lowest reading in South-eastern Asia.
- Central America
62,927.196
the middle country, of 8 measured · 8 members
 Mexico1,377,872.581
 El Salvador2,210.984
Highest and lowest reading in Central America.
- Central Asia
21,165.347
the middle country, of 5 measured · 5 members
 Kazakhstan1,553,184.298
 Tajikistan3,434.541
Highest and lowest reading in Central Asia.
- Southern Europe
13,974.281
the middle country, of 15 measured · 17 members
 Spain369,964.229
3 share 0.000
Highest and lowest reading in Southern Europe.
- Eastern Asia
8,919.071
the middle country, of 8 measured · 8 members
 China2,623,064.620
 Macau0.000
Highest and lowest reading in Eastern Asia.
- Northern Africa
8,876.138
the middle country, of 6 measured · 6 members
 Sudan9,569,032.882
 Libya21.466
Highest and lowest reading in Northern Africa.
- Eastern Europe
8,339.493
the middle country, of 10 measured · 10 members
Russia5,339,033.490 Slovakia1,030.362
Highest and lowest reading in Eastern Europe.
- Western Asia
1,341.617
the middle country, of 18 measured · 19 members
 Türkiye427,965.015
6 share 0.000
Highest and lowest reading in Western Asia.
- Western Europe
42.932
the middle country, of 8 measured · 9 members
 France18,997.298
3 share 0.000
Highest and lowest reading in Western Europe.
- Northern Europe
21.466
the middle country, of 12 measured · 13 members
 United Kingdom18,696.772
6 share 0.000
Highest and lowest reading in Northern Europe.
- Caribbean
0.000
the middle country, of 19 measured · 24 members
 Cuba326,968.107
11 share 0.000
Highest and lowest reading in Caribbean.
- Melanesia
0.000
the middle country, of 5 measured · 5 members
 Papua New Guinea64,247.353
3 share 0.000
Highest and lowest reading in Melanesia.
- Micronesia
0.000
the middle country, of 5 measured · 7 members
5 share 0.000
5 share 0.000
Highest and lowest reading in Micronesia.
- Polynesia
0.000
the middle country, of 5 measured · 7 members
5 share 0.000
5 share 0.000
Highest and lowest reading in Polynesia.
- Australia and New Zealand
2 of 2 measured — too few for a middle: Australia, New Zealand.
Australia50,562,034.820 New Zealand3,413.073
Highest and lowest reading in Australia and New Zealand.
- Northern America
4 of 4 measured — too few for a middle: Bermuda, Canada, Greenland, United States.
 Canada4,420,165.558
2 share 0.000
Highest and lowest reading in Northern America.
03The whole field at once
The spread
209 countries, one dot each, on one scale — further right is a higher value. Half the countries are above 13,824.019; a quarter are above 385,312.328, and a quarter below 21.466. The bar in each row marks that continent’s middle country.
04All 209 ever measured
Every country
In order, highest value first. No rank or position is shown: too many countries share the same value for an order to mean anything. Neither end is better: fire is a natural part of savannas and grasslands, and the figure is a size in hectares, so the largest fire-prone countries lead. A zero does not mean no fires — the satellite misses fires too small to fill its half-kilometre pixels.
Showing 25 of 209 countries











































































































































































Values for 2025. The change column compares 2025 with 2024 only; the sparkline covers the recent editions.
052002–2025 · 24 reference years
Over time
Each point is one year from 2002, all from one consistent satellite record. Fire years swing widely with drought and rainfall, so one bad year is not a trend.
- the middle country
- the middle half of countries
- the middle of the 209 countries measured every time
- each continent’s middle country
The same, year by year
| Year | Countries | Middle country | Middle half | Measured every time |
|---|---|---|---|---|
| 2025 | 209 | 13,824.019 | 21.466 – 385,312.328 | 13,824.019 |
| 2024 | 209 | 10,453.876 | 0.000 – 518,465.089 | 10,453.876 |
| 2023 | 209 | 8,178.495 | 42.932 – 470,338.621 | 8,178.495 |
| 2022 | 209 | 10,711.468 | 0.000 – 286,182.949 | 10,711.468 |
| 2021 | 209 | 9,359.120 | 0.000 – 289,724.817 | 9,359.120 |
| 2020 | 209 | 13,802.553 | 0.000 – 372,218.142 | 13,802.553 |
| 2019 | 209 | 14,661.187 | 21.466 – 429,167.097 | 14,661.187 |
| 2018 | 209 | 7,233.997 | 0.000 – 329,865.986 | 7,233.997 |
| 2017 | 209 | 18,589.444 | 0.000 – 415,600.675 | 18,589.444 |
| 2016 | 209 | 8,006.767 | 0.000 – 406,649.395 | 8,006.767 |
| 2015 | 209 | 16,593.120 | 0.000 – 503,610.728 | 16,593.120 |
| 2014 | 209 | 13,137.115 | 0.000 – 362,257.990 | 13,137.115 |
| 2013 | 209 | 14,231.870 | 0.000 – 476,112.942 | 14,231.870 |
| 2012 | 209 | 18,525.050 | 0.000 – 527,223.170 | 18,525.050 |
| 2011 | 209 | 15,841.810 | 0.000 – 440,737.201 | 15,841.810 |
| 2010 | 209 | 13,416.177 | 0.000 – 404,502.809 | 13,416.177 |
| 2009 | 209 | 14,747.049 | 0.000 – 415,257.216 | 14,747.049 |
| 2008 | 209 | 17,687.878 | 0.000 – 364,018.191 | 17,687.878 |
| 2007 | 209 | 22,667.965 | 42.932 – 566,012.004 | 22,667.965 |
| 2006 | 209 | 22,002.521 | 85.864 – 429,081.225 | 22,002.521 |
| 2005 | 209 | 16,571.649 | 0.000 – 578,011.411 | 16,571.649 |
| 2004 | 209 | 20,585.771 | 0.000 – 509,105.981 | 20,585.771 |
| 2003 | 209 | 24,471.092 | 343.454 – 535,315.811 | 24,471.092 |
| 2002 | 209 | 18,525.048 | 0.000 – 358,050.675 | 18,525.048 |
062024 → 2025
Who rose and fell
The biggest changes in value between the two newest editions — reference years recalculated in one report, not two separate publications. Places are shown second, because they also move when other countries do.
Rose most
before → afterFell most
before → after- Brazil25,085,527.769 → 10,291,659.862−14,793,867.907
 Bolivia11,002,437.628 → 1,590,899.843−9,411,537.785
- Russia9,773,538.226 → 5,339,033.490−4,434,504.736
- South Sudan29,682,314.444 → 26,577,448.458−3,104,865.986
- Angola37,843,057.640 → 34,832,920.538−3,010,137.102
209 countries were measured in both 2024 and 2025.
07Across every edition
Burned area in records
The extremes of the statistic. A record reached by more than one country names none of them.
Highest reading on record
90,050,622.876
Burned area (hectares)
Lowest reading on record
Reached 1291 times by 84 countries — shared, so no holder is named
0.000
Burned area (hectares)
Biggest rise between editions
+69,506,843.364
18,471,250.043 → 87,978,093.407
Biggest fall between editions
−61,615,754.385
90,050,622.876 → 28,434,868.491
Biggest change since first measured
+3,516,409.596
1,360,292.026 → 4,876,701.622
Highest most often
13 of 24
editions, alone at the first-listed end
08The parts of the index
Inside the number
European Commission Joint Research Centre — Global Wildfire Information System (GWIS) publishes the parts the headline is built from. Each part’s highest and lowest country, and its middle value.
| Part | Highest | Lowest | Middle country |
|---|---|---|---|
| Burned forest (hectares)209 countries |  Zambia3,472,812.413 Zambia3,472,812.413 | 99 countries share 0.000 | 64.398 |
| Burned savanna (hectares)209 countries | DR Congo26,068,514.208 | 70 countries share 0.000 | 643.975 |
| Burned shrubland and grassland (hectares)209 countries | Australia46,692,017.980 | 64 countries share 0.000 | 3,219.880 |
| Burned cropland (hectares)209 countries | India3,280,542.652 | 70 countries share 0.000 | 1,459.680 |
| Other burned land (hectares)209 countries | Zambia129,868.497 | 112 countries share 0.000 | 0.000 |
09The measure
About burned area
This is how much land burned in a year — forest, savanna, grassland and farmland — as seen from NASA's MODIS satellites and added up per country by the European Commission's Global Wildfire Information System. It counts wildfires and every other vegetation fire, including fires set to clear fields.
What the number is: Burned area (hectares).
10Where it fits
Connections
Its part in the Country Index, the statistics whose values line up most closely with it across countries, and others on the same subject.
In the Country Index
Context, with no vote
This statistic is published in full under Environment & Sustainability and Risk & Resilience, but does not help decide any Country Index standing.
Environment & SustainabilityRisk & ResilienceWhich statistics vote, and why
Moves with
Where burned area is higher, these tend to be higher too.
- Land AreaFAO · 207 countries in commonρ 0.77
- Total PopulationUN DESA Population Division · 209 countries in commonρ 0.71
- Agricultural EmissionsFAO · 193 countries in commonρ 0.71
Moves against
Where burned area is higher, these tend to be lower.
- Services ExportsUNCTAD · 174 countries in commonρ −0.66
- Political Stability and Absence of ViolenceKeyWorld Bank Group · 203 countries in commonρ −0.65
- Trade (% of GDP)World Bank Group · 137 countries in commonρ −0.58
Rank correlation (ρ, from −1 to 1) across countries, on each statistic’s newest edition, out of 313 statistics sharing at least 80 countries with this one. Two statistics that move together do not cause each other.
11Keep reading
Explore further
12Questions
Burned area: questions and answers
Which country has the highest burned area?
Australia, at 50,562,034.820, among the 209 countries compared in 2025.
Which country has the lowest burned area?
51 countries share the lowest reading, 0.000, among the 209 compared in 2025, so no single country is named.
How many countries does the Burned Area cover?
209 in 2025.
What is the world average burned area?
This site does not calculate a world average, which would depend on how countries are weighted. In the middle country of the 209 compared in 2025, the figure was 13,824.019.
Is this European Commission Joint Research Centre — Global Wildfire Information System (GWIS)’s own ranking?
No ranking is shown. European Commission Joint Research Centre — Global Wildfire Information System (GWIS) publishes values only, and too many countries share the same value for an ordering to mean anything, so none is derived.
How often is the Burned Area published?
This site holds 24 reference years, 2002–2025, all recalculated in European Commission Joint Research Centre — Global Wildfire Information System (GWIS)’s 2026 report on one method — not 24 separate publications.
Where does the data come from, and can I download it?
From European Commission Joint Research Centre — Global Wildfire Information System (GWIS), under CC BY 4.0. From the Global Wildfire Information System's country profiles, which total NASA's MODIS burned-area maps by country and by the kind of land that burned. Every edition is on this site’s Datasets pages as a full table, and downloads as a CSV file with every value unrounded.
13Method
Sources, method and citation
Source
Burned Area — European Commission Joint Research Centre — Global Wildfire Information System (GWIS)
From the Global Wildfire Information System's country profiles, which total NASA's MODIS burned-area maps by country and by the kind of land that burned.
Newest edition
Report year 2025Data year 2025
Cite the source as: Global Wildfire Information System (GWIS), European Commission Joint Research Centre, Copernicus Emergency Management Service — country profiles. Burned area from NASA's MODIS MCD64A1 product: Giglio, L., Boschetti, L., Roy, D. P., Humber, M. L., & Justice, C. O. (2018). The Collection 6 MODIS burned area mapping algorithm and product. Remote Sensing of Environment 217: 72–85.
Licence: CC BY 4.0, checked 2026-09-29.
How this page reads the numbers
- No rank or position is shown: European Commission Joint Research Centre — Global Wildfire Information System (GWIS) publishes values only, and too many countries share the same value for an ordering to mean anything.
- This statistic has no better end, so the page describes higher and lower values and never calls a country a leader.
- A country is named at an end only when it holds that value alone. Where several share it, the page says how many and names none first.
- Values are stored exactly as published and trimmed only for display. “The middle country” is the median of the countries measured, not a world average.
The file itself, column by column — where it came from, what each column holds, and every edition as a CSV — is on its dataset page.
Cite this page
Nations Inquiry (2026). Burned area by country: Burned Area, data from European Commission Joint Research Centre — Global Wildfire Information System (GWIS). https://nationsinquiry.com/statistics/burned-area