UIS · Primary Schools with Electricity
Primary schools with electricity by country
What share of primary schools have access to electricity?
Of the 110 countries compared in 2024, 66 countries shared the highest reading, 100.000%, and Chad had the lowest reading, 1.246%. In the middle country the figure was 100.000%.
Share
Part ofEducation & KnowledgeEnergy
Primary schools with electricity · 2024
Context statistic
66 countries share the highest value, 100.000% — no single country is named first.
012024 · values only
Who leads
The three countries at the highest end of 110 compared, the three at the other end, and the first on each continent.
Highest in 2024 · shared
66 countries share the highest reading, 100.000%
No single country is named first: picking one from a shared value would be a choice the data does not make.
 Aruba
Aruba Anguilla
 Andorra
 United Arab Emirates
 Armenia
 Australia
 Austria
 Azerbaijan
 Bahrain
 Belarus
 Barbados
 Switzerland
 Cook Islands
 Cuba
Cuba Cayman Islands
 Germany
 Denmark
 Spain
Spain Estonia
 Finland
 France
 Georgia
 Gibraltar
 Grenada
 Hong Kong
 Hungary
 Iceland
 Israel
 Jordan
 Saint Kitts and Nevis
 South Korea
 Lebanon
 Lithuania
 Latvia
 Macau
Macau Monaco
 Maldives
 Mongolia
 Montserrat
 Mauritius
- and 26 more — every one is in the list below
Lowest in 2024
 Chad1.246%
 Niger7.524%
 Madagascar11.861%
Where a country sits says how it compares with the others measured, and nothing about why.
02Every measured country
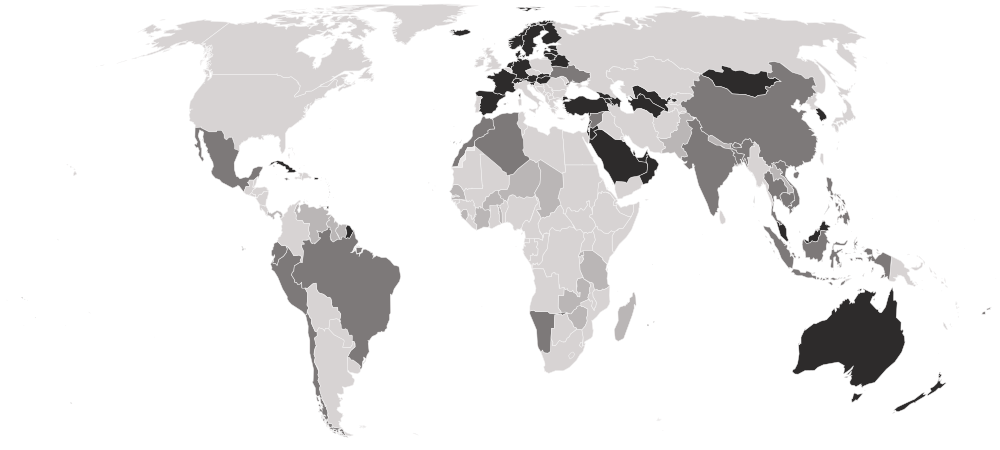
Primary schools with electricity on a map
Each country is shaded by its value, in five groups holding the same number of countries. Hover a country for its value, or select it to open its profile. Below the map, each continent’s middle country.
Darker is a higher value — the better end.
- 1.246–85.220%
- 86.895–99.903%
- 100.000%
- No reading in 2024 (63 measured in an earlier edition)
- Americas
100.000%
the middle country, of 23 measured · 48 members
13 share 100.000%
 Venezuela76.290%
Highest and lowest reading in Americas.
- Asia
100.000%
the middle country, of 33 measured · 52 members
20 share 100.000%
 Pakistan41.265%
Highest and lowest reading in Asia.
- Europe
100.000%
the middle country, of 23 measured · 49 members
22 share 100.000%
 Ukraine99.440%
Highest and lowest reading in Europe.
- Oceania
100.000%
the middle country, of 12 measured · 21 members
9 share 100.000%
 Micronesia81.944%
Highest and lowest reading in Oceania.
- Africa
57.790%
the middle country, of 19 measured · 55 members
2 share 100.000%
Chad1.246%Highest and lowest reading in Africa.
- Every region
21 sub-regions, highest middle country first
- Caribbean
100.000%
the middle country, of 14 measured · 24 members
13 share 100.000%
 Jamaica97.764%
Highest and lowest reading in Caribbean.
- Eastern Asia
100.000%
the middle country, of 5 measured · 8 members
4 share 100.000%
 China99.211%
Highest and lowest reading in Eastern Asia.
- Northern Europe
100.000%
the middle country, of 8 measured · 13 members
8 share 100.000%
8 share 100.000%
Highest and lowest reading in Northern Europe.
- Polynesia
100.000%
the middle country, of 5 measured · 7 members
5 share 100.000%
5 share 100.000%
Highest and lowest reading in Polynesia.
- Southern Europe
100.000%
the middle country, of 5 measured · 17 members
5 share 100.000%
5 share 100.000%
Highest and lowest reading in Southern Europe.
- Western Asia
100.000%
the middle country, of 13 measured · 19 members
12 share 100.000%
 Syria86.895%
Highest and lowest reading in Western Asia.
- Western Europe
100.000%
the middle country, of 6 measured · 9 members
6 share 100.000%
6 share 100.000%
Highest and lowest reading in Western Europe.
- South-eastern Asia
97.894%
the middle country, of 7 measured · 11 members
 Malaysia100.000%
 Laos64.572%
Highest and lowest reading in South-eastern Asia.
- Southern Asia
92.840%
the middle country, of 6 measured · 9 members
Maldives100.000%Pakistan41.265%Highest and lowest reading in Southern Asia.
- South America
91.488%
the middle country, of 7 measured · 12 members
 Chile99.157%Venezuela76.290%
Highest and lowest reading in South America.
- Eastern Africa
71.165%
the middle country, of 8 measured · 19 members
2 share 100.000%
Madagascar11.861%Highest and lowest reading in Eastern Africa.
- Western Africa
38.271%
the middle country, of 7 measured · 16 members
 Côte d’Ivoire66.881%Niger7.524%
Highest and lowest reading in Western Africa.
- Australia and New Zealand
2 of 2 measured — too few for a middle: Australia, New Zealand.
2 share 100.000%
2 share 100.000%
Highest and lowest reading in Australia and New Zealand.
- Central America
2 of 8 measured — too few for a middle: Mexico, Panama.
 Mexico95.528%
 Panama85.220%
Highest and lowest reading in Central America.
- Central Asia
2 of 5 measured — too few for a middle: Turkmenistan, Uzbekistan.
2 share 100.000%
2 share 100.000%
Highest and lowest reading in Central Asia.
- Eastern Europe
4 of 10 measured — too few for a middle: Belarus, Hungary, Slovakia, Ukraine.
3 share 100.000%
Ukraine99.440%Highest and lowest reading in Eastern Europe.
- Melanesia
1 of 5 measured — too few for a middle: Fiji.
 Fiji96.510%
Highest and lowest reading in Melanesia.
- Micronesia
4 of 7 measured — too few for a middle: Kiribati, Micronesia, Nauru, Palau.
2 share 100.000%
Micronesia81.944%Highest and lowest reading in Micronesia.
- Middle Africa
1 of 9 measured — too few for a middle: Chad.
Chad1.246%Highest and lowest reading in Middle Africa.
- Northern Africa
2 of 6 measured — too few for a middle: Algeria, Morocco.
 Algeria99.863%
 Morocco97.752%
Highest and lowest reading in Northern Africa.
- Southern Africa
1 of 5 measured — too few for a middle: Namibia.
 Namibia89.889%
Highest and lowest reading in Southern Africa.
03The whole field at once
The spread
110 countries, one dot each, on one scale — further right is a higher value. Half the countries are above 100.000%; a quarter are above 100.000%, and a quarter below 91.916%. The bar in each row marks that continent’s middle country.
04All 173 ever measured
Every country
In order, highest value first. No rank or position is shown: too many countries share the same value for an order to mean anything. Many countries report every primary school connected, so the top of the table is a long tie at 100% and no position is derived; the differences that matter are at the bottom. A few readings come from learning assessments and give the share of pupils whose school has electricity rather than the share of schools — the source column says which. Access says nothing about how reliable the supply is.
Showing 25 of 173 countries












































































































Values for 2024. The change column compares 2024 with 2023 only; the sparkline covers the recent editions.
052013–2024 · 10 editions
Over time
Each point is one edition. Reporting only became widespread in 2016, so most lines are short.
- the middle country
- the middle half of countries
- the middle of the 23 countries measured every time
- each continent’s middle country
The same, year by year
| Year | Countries | Middle country | Middle half | Measured every time |
|---|---|---|---|---|
| 2024 | 110 | 100.000% | 91.916% – 100.000% | 100.000% |
| 2023 | 124 | 100.000% | 88.301% – 100.000% | 100.000% |
| 2022 | 122 | 100.000% | 87.118% – 100.000% | 100.000% |
| 2021 | 120 | 100.000% | 82.447% – 100.000% | 100.000% |
| 2020 | 118 | 100.000% | 85.475% – 100.000% | 100.000% |
| 2019 | 130 | 100.000% | 82.734% – 100.000% | 100.000% |
| 2018 | 112 | 100.000% | 93.738% – 100.000% | 100.000% |
| 2017 | 108 | 100.000% | 84.596% – 100.000% | 100.000% |
| 2016 | 111 | 100.000% | 80.460% – 100.000% | 100.000% |
| 2013 | 51 | 98.819% | 83.628% – 100.000% | 100.000% |
062023 → 2024
Who rose and fell
The biggest changes in value between the two newest editions. Places are shown second, because they also move when other countries do.
Improved most
before → after Puerto Rico49.661% → 100.000%+50.339
 Nepal46.679% → 59.813%+13.134
- Panama72.742% → 85.220%+12.478
 Tuvalu90.000% → 100.000%+10.000
 Ecuador83.907% → 93.200%+9.293
Declined most
before → after- Chad4.179% → 1.246%−2.933
 Burkina Faso31.150% → 28.500%−2.650
- Jamaica100.000% → 97.764%−2.236
- Pakistan42.367% → 41.265%−1.102
- Namibia90.981% → 89.889%−1.092
103 countries were measured in both 2023 and 2024. The field changed from 124 to 110 countries, so a place can move for reasons that have nothing to do with the country itself.
07Across every edition
Primary schools with electricity in records
The extremes of the statistic. A record reached by more than one country names none of them.
Highest reading on record
Reached 624 times by 93 countries — shared, so no holder is named
100.000%
Primary schools with access to electricity (%)
UIS · 2013, 2016, 2017, 2018, 2019, 2020, 2021, 2022, 2023, 2024
Lowest reading on record
1.246%
Primary schools with access to electricity (%)
Biggest improvement between editions
+54.526
24.953% → 79.480%
Biggest decline between editions
−56.054
85.431% → 29.377%
Most improved since first measured
+50.339
49.661% → 100.000%
08The measure
About primary schools with electricity
This is the share of primary schools with access to electricity — part of SDG indicator 4.a.1 on the basic services a school has. It describes the building a child learns in: light to read by, power for equipment, and the possibility of anything digital.
What the number is: Primary schools with access to electricity (%).
09Where it fits
Connections
Its part in the Country Index, the statistics whose values line up most closely with it across countries, and others on the same subject.
In the Country Index
Context, with no vote
This statistic is published in full under Education & Knowledge and Energy, but does not help decide any Country Index standing.
Moves with
Where primary schools with electricity is higher, these tend to be higher too.
- Access to Electricity, RuralWorld Bank Group · 103 countries in commonρ 0.89
- Access to ElectricityWorld Bank Group · 106 countries in commonρ 0.88
- Inequality-adjusted Human Development IndexUNDP Human Development Report Office · 82 countries in commonρ 0.85
Moves against
Where primary schools with electricity is higher, these tend to be lower.
- Coefficient of Human InequalityUNDP Human Development Report Office · 82 countries in commonρ −0.84
- Gender Inequality IndexUNDP Human Development Report Office · 85 countries in commonρ −0.83
- Vulnerable EmploymentKeyILO · 88 countries in commonρ −0.81
Rank correlation (ρ, from −1 to 1) across countries, on each statistic’s newest edition, out of 246 statistics sharing at least 80 countries with this one. Two statistics that move together do not cause each other.
10Keep reading
Explore further
The subject
The countries at either end
11Questions
Primary schools with electricity: questions and answers
Which country has the highest primary schools with electricity?
66 countries share the highest reading, 100.000%, among the 110 compared in 2024, so no single country is named.
Which country has the lowest primary schools with electricity?
Chad, at 1.246%, among the 110 countries compared in 2024.
How many countries does the Primary Schools with Electricity cover?
110 in 2024, and 173 at least once across all editions. The number measured varies from 51 to 130 between editions.
What is the world average primary schools with electricity?
This site does not calculate a world average, which would depend on how countries are weighted. In the middle country of the 110 compared in 2024, the figure was 100.000%.
Is this UNESCO Institute for Statistics (UIS)’s own ranking?
No ranking is shown. UNESCO Institute for Statistics (UIS) publishes values only, and too many countries share the same value for an ordering to mean anything, so none is derived.
How often is the Primary Schools with Electricity published?
This site holds 10 editions, describing 2013 to 2024.
Where does the data come from, and can I download it?
From UNESCO Institute for Statistics (UIS), under CC BY-SA 4.0. From the UNESCO Institute for Statistics (SCHBSP.1.WELEC), which collects it through its own education survey and the UNESCO-OECD-Eurostat data collection, with UIS's own footnote on every reading. Editions reporting fewer than 50 countries are not written. Every edition is on this site’s Datasets pages as a full table, and downloads as a CSV file with every value unrounded.
12Method
Sources, method and citation
Source
Primary Schools with Electricity — UNESCO Institute for Statistics (UIS)
From the UNESCO Institute for Statistics (SCHBSP.1.WELEC), which collects it through its own education survey and the UNESCO-OECD-Eurostat data collection, with UIS's own footnote on every reading. Editions reporting fewer than 50 countries are not written.
Newest edition
Report year 2024Data year 2024
Cite the source as: UNESCO Institute for Statistics. UIS Data Browser. Montreal: UNESCO Institute for Statistics.
Licence: CC BY-SA 4.0, checked 2026-10-03.
How this page reads the numbers
- No rank or position is shown: UNESCO Institute for Statistics (UIS) publishes values only, and too many countries share the same value for an ordering to mean anything.
- Which end is better follows the publisher’s own reading of the measure.
- A country is named at an end only when it holds that value alone. Where several share it, the page says how many and names none first.
- Values are stored exactly as published and trimmed only for display. “The middle country” is the median of the countries measured, not a world average.
The file itself, column by column — where it came from, what each column holds, and every edition as a CSV — is on its dataset page.
Cite this page
Nations Inquiry (2026). Primary schools with electricity by country: Primary Schools with Electricity, data from UNESCO Institute for Statistics (UIS). https://nationsinquiry.com/statistics/school-electricity-primary