Ember · Renewable Share of Electricity Generation
Renewable electricity by country
What share of electricity comes from renewable sources?
6 countries shared first place of the 165 countries compared in 2024, all at 100.000%, and 4 countries shared last place, at 0.000%. In the middle country the figure was 32.062%. Among the 162 countries measured in every edition since 2000, the middle one moved from 15.575% to 31.978%.
Share
Renewable electricity · 2024
Key statistic · Energy

6 countries share the highest value, 100.000% — no single country is named first.
012024 · position · derived
Who leads
The three countries at the highest end of 165 compared, the three at the other end, and the first on each continent.
Highest in 2024 · shared
6 countries share the highest reading, 100.000%
No single country is named first: picking one from a shared value would be a choice the data does not make.
Lowest in 2024
- =162
 Montserrat0.000%
- =162
 Grenada0.000%
- =162
 Guinea-Bissau0.000%
Positions out of 165. Where a country sits says how it compares with the others measured, and nothing about why.
Highest on each continent
- Africa
 DR Congo100.000%
- Americas
 Paraguay100.000%
- Asia
2 countries share 100.000%
- Europe
2 countries share 100.000%
- Oceania
 New Zealand85.980%
- Every region
02Every measured country
Renewable electricity on a map
Each country is shaded by its value, in five groups holding the same number of countries. Hover a country for its value, or select it to open its profile. Below the map, each continent’s middle country.
Darker is a higher value — the better end.
- 0.000–6.000%
- 7.059–23.823%
- 24.051–43.820%
- 45.614–75.510%
- 76.716–100.000%
- No reading in 2024 (9 measured in an earlier edition)
- Europe
50.173%
the middle country, of 33 measured · 49 members
2 share 100.000%
 Belarus3.077%
Highest and lowest reading in Europe.
- Africa
30.173%
the middle country, of 46 measured · 55 members
DR Congo100.000%2 share 0.000%
Highest and lowest reading in Africa.
- Oceania
25.000%
the middle country, of 13 measured · 21 members
New Zealand85.980% American Samoa5.556%
Highest and lowest reading in Oceania.
- Asia
23.823%
the middle country, of 37 measured · 52 members
2 share 100.000%
 Turkmenistan0.030%
Highest and lowest reading in Asia.
- Americas
21.457%
the middle country, of 36 measured · 48 members
Paraguay100.000%2 share 0.000%
Highest and lowest reading in Americas.
- Every region
22 sub-regions, highest middle country first
- Northern Europe
73.503%
the middle country, of 9 measured · 13 members
 Iceland100.000%
 Ireland46.513%
Highest and lowest reading in Northern Europe.
- Central America
68.334%
the middle country, of 7 measured · 8 members
 Costa Rica99.909%
 Honduras55.449%
Highest and lowest reading in Central America.
- South America
65.691%
the middle country, of 10 measured · 12 members
Paraguay100.000% Guyana2.899%
Highest and lowest reading in South America.
- Southern Asia
64.000%
the middle country, of 6 measured · 9 members
2 share 100.000%
 Bangladesh1.887%
Highest and lowest reading in Southern Asia.
- Western Europe
50.745%
the middle country, of 5 measured · 9 members
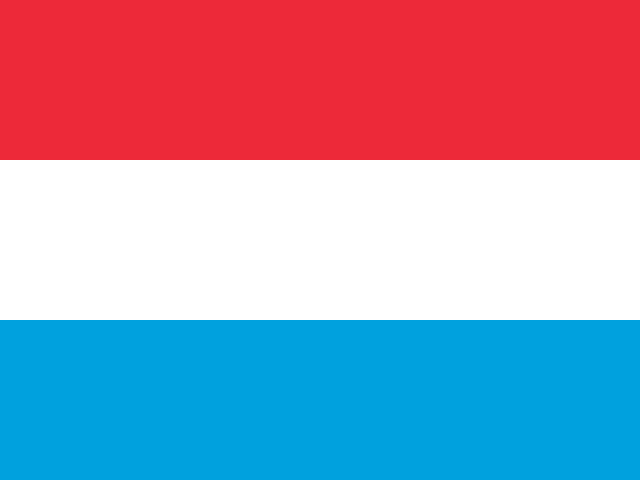 Luxembourg90.728%
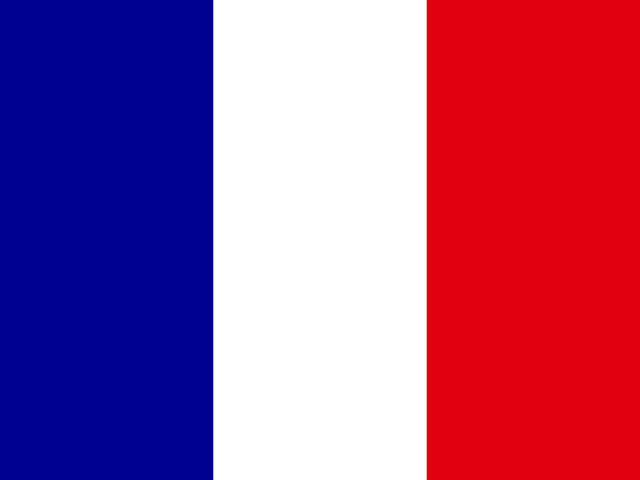 France27.526%
Highest and lowest reading in Western Europe.
- Southern Europe
50.173%
the middle country, of 11 measured · 17 members
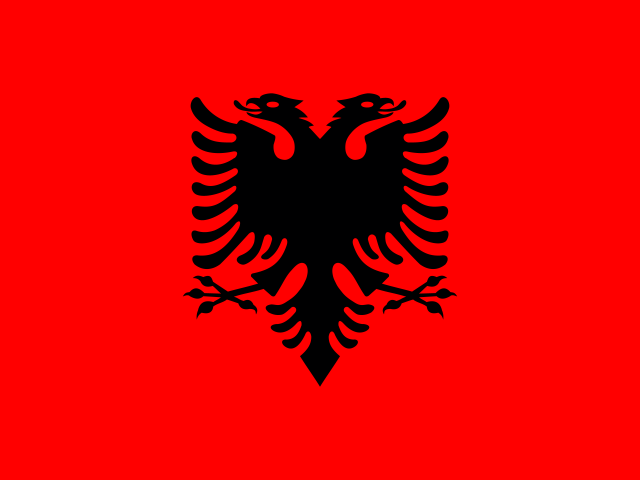 Albania100.000%
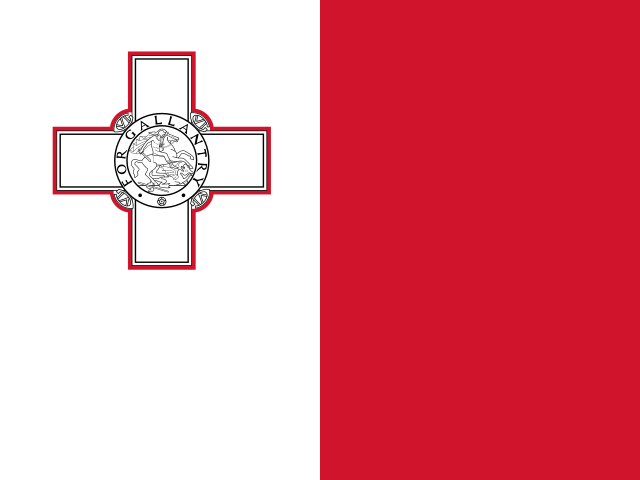 Malta15.525%
Highest and lowest reading in Southern Europe.
- Eastern Africa
45.973%
the middle country, of 16 measured · 19 members
 Uganda97.074%
 South Sudan1.786%
Highest and lowest reading in Eastern Africa.
- Middle Africa
35.385%
the middle country, of 7 measured · 9 members
DR Congo100.000% Chad5.405%
Highest and lowest reading in Middle Africa.
- Polynesia
34.722%
the middle country, of 5 measured · 7 members
 Cook Islands50.000%American Samoa5.556%
Highest and lowest reading in Polynesia.
- Eastern Asia
30.769%
the middle country, of 5 measured · 8 members
 North Korea63.358%
 Hong Kong1.042%
Highest and lowest reading in Eastern Asia.
- South-eastern Asia
28.066%
the middle country, of 6 measured · 11 members
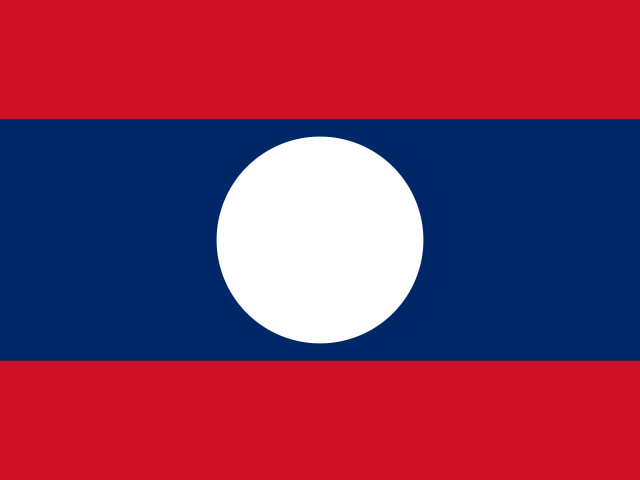 Laos76.716%
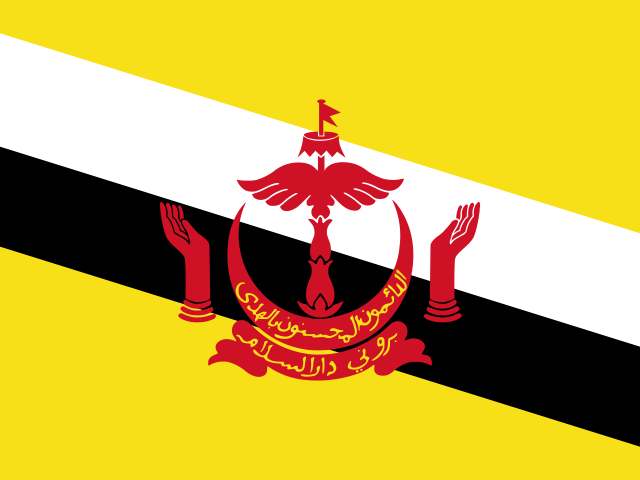 Brunei0.180%
Highest and lowest reading in South-eastern Asia.
- Eastern Europe
26.964%
the middle country, of 8 measured · 10 members
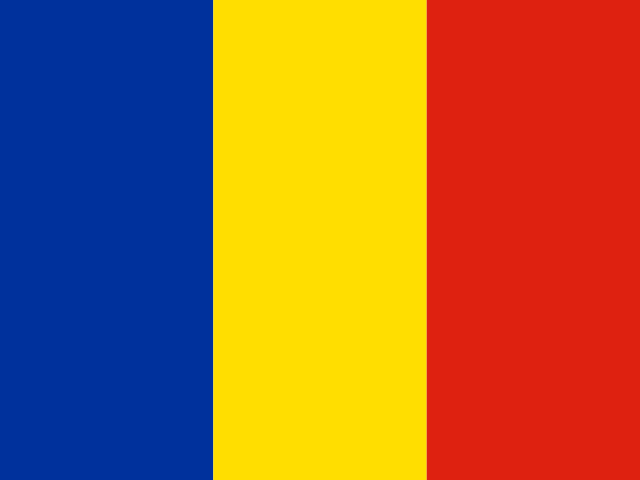 Romania46.513%Belarus3.077%
Highest and lowest reading in Eastern Europe.
- Western Africa
23.853%
the middle country, of 16 measured · 16 members
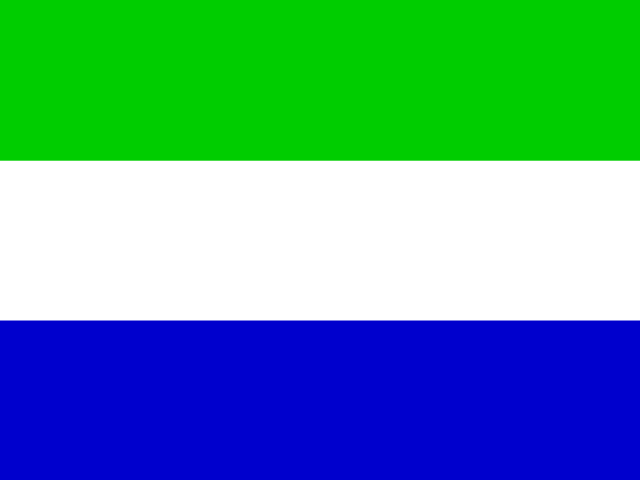 Sierra Leone95.238%
2 share 0.000%
Highest and lowest reading in Western Africa.
- Western Asia
12.776%
the middle country, of 16 measured · 19 members
 Georgia79.828%
 Bahrain0.264%
Highest and lowest reading in Western Asia.
- Caribbean
6.000%
the middle country, of 17 measured · 24 members
 Dominican Republic18.851%
2 share 0.000%
Highest and lowest reading in Caribbean.
- Australia and New Zealand
1 of 2 measured — too few for a middle: New Zealand.
New Zealand85.980%Highest and lowest reading in Australia and New Zealand.
- Central Asia
4 of 5 measured — too few for a middle: Kyrgyzstan, Tajikistan, Turkmenistan, Uzbekistan.
 Tajikistan94.595%Turkmenistan0.030%
Highest and lowest reading in Central Asia.
- Melanesia
4 of 5 measured — too few for a middle: Fiji, New Caledonia, Papua New Guinea, Solomon Islands.
 Fiji63.478%
 Solomon Islands9.091%
Highest and lowest reading in Melanesia.
- Micronesia
3 of 7 measured — too few for a middle: Guam, Kiribati, Nauru.
 Kiribati25.000%
 Guam8.602%
Highest and lowest reading in Micronesia.
- Northern Africa
4 of 6 measured — too few for a middle: Algeria, Libya, Sudan, Tunisia.
 Sudan79.689%
 Libya0.029%
Highest and lowest reading in Northern Africa.
- Northern America
2 of 4 measured — too few for a middle: Greenland, United States.
 Greenland83.333%
 United States24.063%
Highest and lowest reading in Northern America.
- Southern Africa
3 of 5 measured — too few for a middle: Botswana, Eswatini, Namibia.
 Namibia97.561%
 Botswana0.292%
Highest and lowest reading in Southern Africa.
03The whole field at once
The spread
165 countries, one dot each, on one scale — further right is a higher value. Half the countries are above 32.062%; a quarter are above 69.335%, and a quarter below 11.111%. The bar in each row marks that continent’s middle country.
04All 174 ever measured
Every country
In order, highest value first. “=” marks a position shared with another country. Ember ranks nobody on this measure; the position is derived here by ordering the published values. Read it as electricity only. Heating, transport and industry are not in this number, so a high share is a statement about the power sector rather than about a country’s whole energy use.
Showing 25 of 174 countries








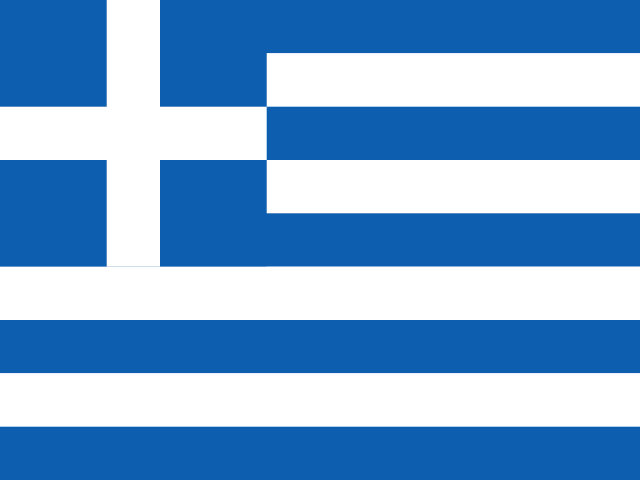
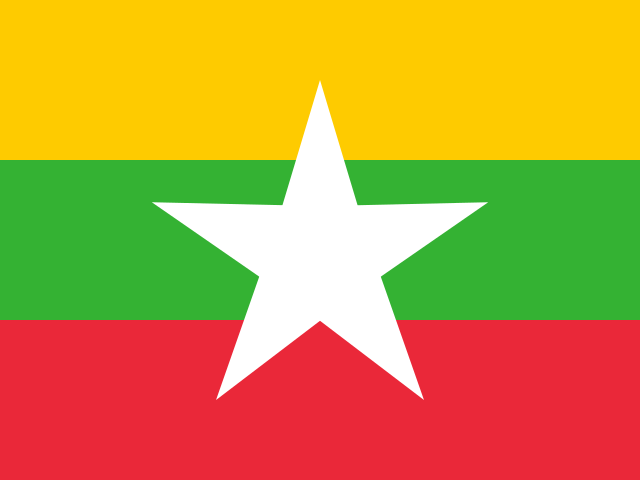
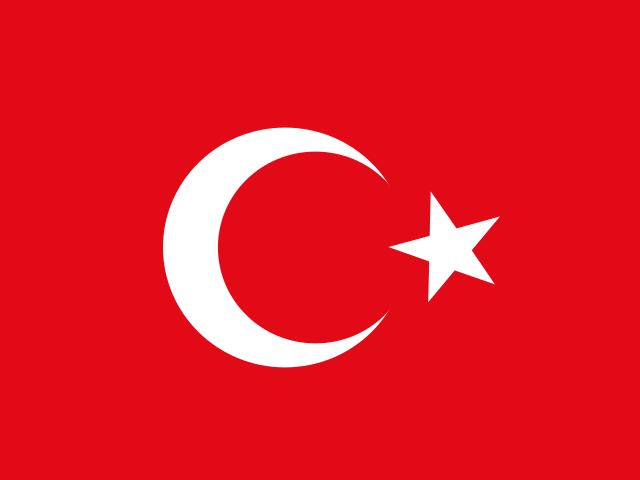
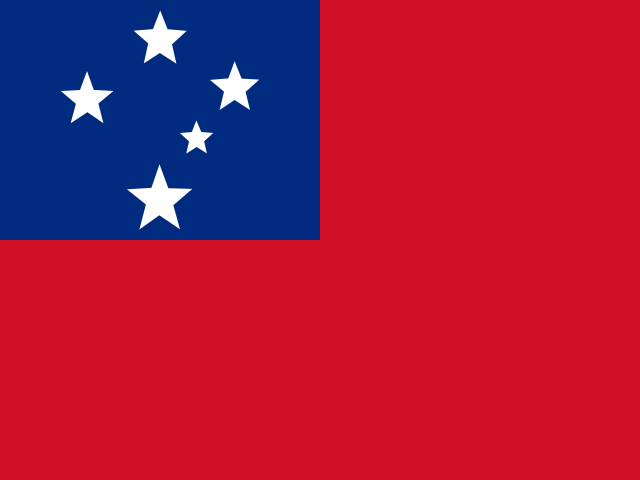












Values for 2024. The change column compares 2024 with 2023 only; the sparkline covers the recent editions.
052000–2024 · 25 editions
Over time
Each point is one year from 2000. Watch the wind and solar column against the headline: a country whose renewable share has been high for decades is usually a hydro country, while movement since 2015 is almost always wind and solar.
- the middle country
- the middle half of countries
- the middle of the 162 countries measured every time
- each continent’s middle country
The same, year by year
| Year | Countries | Middle country | Middle half | Measured every time |
|---|---|---|---|---|
| 2024 | 165 | 32.062% | 11.111% – 69.335% | 31.978% |
| 2023 | 173 | 28.000% | 9.091% – 66.121% | 30.074% |
| 2022 | 174 | 28.881% | 9.123% – 66.865% | 29.965% |
| 2021 | 174 | 28.286% | 6.712% – 63.957% | 28.635% |
| 2020 | 174 | 27.125% | 5.742% – 63.354% | 27.125% |
| 2019 | 174 | 26.296% | 4.917% – 58.258% | 26.296% |
| 2018 | 174 | 25.505% | 3.470% – 59.181% | 26.685% |
| 2017 | 174 | 24.023% | 2.886% – 58.551% | 24.319% |
| 2016 | 174 | 22.218% | 2.811% – 55.955% | 22.218% |
| 2015 | 174 | 21.915% | 1.963% – 54.498% | 22.735% |
| 2014 | 174 | 21.151% | 1.598% – 55.864% | 21.716% |
| 2013 | 174 | 21.593% | 1.051% – 58.407% | 21.593% |
| 2012 | 174 | 19.869% | 0.574% – 59.931% | 19.869% |
| 2011 | 173 | 18.584% | 0.103% – 57.647% | 18.132% |
| 2010 | 173 | 18.572% | 0.000% – 57.704% | 18.587% |
| 2009 | 173 | 17.886% | 0.164% – 58.426% | 18.229% |
| 2008 | 173 | 15.923% | 0.000% – 60.408% | 15.400% |
| 2007 | 173 | 15.586% | 0.000% – 57.167% | 15.399% |
| 2006 | 173 | 15.392% | 0.000% – 55.984% | 14.965% |
| 2005 | 173 | 16.438% | 0.000% – 54.035% | 16.306% |
| 2004 | 172 | 16.445% | 0.000% – 56.679% | 15.349% |
| 2003 | 172 | 16.339% | 0.000% – 56.661% | 15.673% |
| 2002 | 171 | 13.826% | 0.000% – 58.620% | 13.163% |
| 2001 | 171 | 14.023% | 0.000% – 57.218% | 14.803% |
| 2000 | 171 | 15.612% | 0.000% – 60.217% | 15.575% |
062023 → 2024
Who rose and fell
The biggest changes in value between the two newest editions. Places are shown second, because they also move when other countries do.
Improved most
before → after Nauru0.000% → 20.000% · 164th → 106th+20.000
 Portugal74.469% → 85.197% · 37th → 27th+10.728
 Lebanon34.076% → 43.820% · 79th → 67th+9.744
 Panama60.641% → 67.982% · 50th → 44th+7.341
 North Macedonia32.174% → 39.461% · 84th → 72nd+7.287
Declined most
before → after Cambodia42.132% → 35.659% · 69th → 75th−6.473
 Colombia66.121% → 61.342% · 44th → 48th−4.779
 Latvia77.743% → 73.503% · 32nd → 37th−4.240
 Haiti22.353% → 18.605% · 104th → 110th−3.748
- New Zealand89.625% → 85.980% · 19th → 26th−3.645
165 countries were measured in both 2023 and 2024. The field changed from 173 to 165 countries, so a place can move for reasons that have nothing to do with the country itself.
07Across every edition
Renewable electricity in records
The extremes of the statistic. A record reached by more than one country names none of them.
Highest reading on record
Reached 173 times by 15 countries — shared, so no holder is named
100.000%
Renewables (% of electricity generated)
Lowest reading on record
Reached 806 times by 52 countries — shared, so no holder is named
0.000%
Renewables (% of electricity generated)
Biggest improvement between editions
+52.381
33.333% → 85.714%
Biggest decline between editions
−33.333
33.333% → 0.000%
Most improved since first measured
+84.127
11.111% → 95.238%
08The measure
About renewable electricity
This is the share of a country’s electricity generation that came from renewable sources — hydro, wind, solar, bioenergy and geothermal. Ember compiles it from national reporting each year.
What the number is: Renewables (% of electricity generated).
What it does not measure
It covers electricity only, not transport or heating, and it treats every renewable source alike; large hydropower counts the same as wind and solar.
09Where it fits
Connections
Its part in the Country Index, the statistics whose values line up most closely with it across countries, and others on the same subject.
In the Country Index
A key statistic for Energy
“How much of the electricity a country generates already comes from renewable sources.”
- Edition used
- 2024 (data 2024)
- Countries
- 165
- Licence
- CC BY 4.0
Moves with
Where renewable electricity is higher, these tend to be higher too.
- Low-Carbon Share of Electricity GenerationEmber · 165 countries in commonρ 0.96
- Hydro Share of Electricity GenerationEmber · 164 countries in commonρ 0.84
- Tropical Moist Forest DeforestationJRC · 81 countries in commonρ 0.49
Moves against
Where renewable electricity is higher, these tend to be lower.
- Carbon Intensity of ElectricityKeyEmber · 165 countries in commonρ −0.91
Rank correlation (ρ, from −1 to 1) across countries, on each statistic’s newest edition, out of 355 statistics sharing at least 80 countries with this one. Two statistics that move together do not cause each other.
10Keep reading
Explore further
The subject
The countries at either end
More from Ember
- Carbon Intensity of Electricity
- Coal Share of Electricity Generation
- Gas Share of Electricity Generation
- Hydro Share of Electricity Generation
- Low-Carbon Share of Electricity Generation
- Net Electricity Imports (share of generation)
- Nuclear Share of Electricity Generation
- Solar Share of Electricity Generation
- All statistics
11Questions
Renewable electricity: questions and answers
Which country has the highest renewable electricity?
6 countries share the highest reading, 100.000%, among the 165 compared in 2024, so no single country is named.
Which country has the lowest renewable electricity?
4 countries share the lowest reading, 0.000%, among the 165 compared in 2024, so no single country is named.
How many countries does the Renewable Share of Electricity Generation cover?
165 in 2024, and 174 at least once across all editions. The number measured varies from 165 to 174 between editions.
What is the world average renewable electricity?
This site does not calculate a world average, which would depend on how countries are weighted. In the middle country of the 165 compared in 2024, the figure was 32.062%.
Is this Ember’s own ranking?
No. Ember publishes the values but ranks nobody; the position on this page is derived by Nations Inquiry by ordering the published values, and equal values share a position.
How often is the Renewable Share of Electricity Generation published?
This site holds 25 editions, describing 2000 to 2024.
Where does the data come from, and can I download it?
From Ember, under CC BY 4.0. From Ember’s Yearly Electricity Data, the same public download its own data explorer offers. The percentages are Ember’s own, not recomputed here. Some countries are not shown — India, Japan, Brazil, Canada, Russia, Germany and the United Kingdom among them — because Ember takes their figures from publishers whose terms do not allow reuse on a commercial site. Every edition is on this site’s Datasets pages as a full table, and downloads as a CSV file with every value unrounded.
12Method
Sources, method and citation
Source
Renewable Share of Electricity Generation — Ember
From Ember’s Yearly Electricity Data, the same public download its own data explorer offers. The percentages are Ember’s own, not recomputed here. Some countries are not shown — India, Japan, Brazil, Canada, Russia, Germany and the United Kingdom among them — because Ember takes their figures from publishers whose terms do not allow reuse on a commercial site.
Newest edition
Report year 2024Data year 2024
Cite the source as: Ember. Yearly Electricity Data. London: Ember (Ember Energy Research CIC).
Licence: CC BY 4.0, checked 2026-10-02.
How this page reads the numbers
- Ember ranks nobody on this measure. The position is derived by Nations Inquiry by ordering the published values; equal values share a position.
- Which end is better follows the publisher’s own reading of the measure.
- A country is named at an end only when it holds that value alone. Where several share it, the page says how many and names none first.
- Values are stored exactly as published and trimmed only for display. “The middle country” is the median of the countries measured, not a world average.
The file itself, column by column — where it came from, what each column holds, and every edition as a CSV — is on its dataset page.
Cite this page
Nations Inquiry (2026). Renewable electricity by country: Renewable Share of Electricity Generation, data from Ember. https://nationsinquiry.com/statistics/renewable-electricity