Dataset · GWIS
Burned Area
24 years, 2002–2025 · 209 countries · 6 measures
This is how much land burned in a year — forest, savanna, grassland and farmland — as seen from NASA's MODIS satellites and added up per country by the European Commission's Global Wildfire Information System. It counts wildfires and every other vegetation fire, including fires set to clear fields.
This site holds every year from 2002 to 2025, read from GWIS’s own data and stored exactly as published.
Burned Area · the file
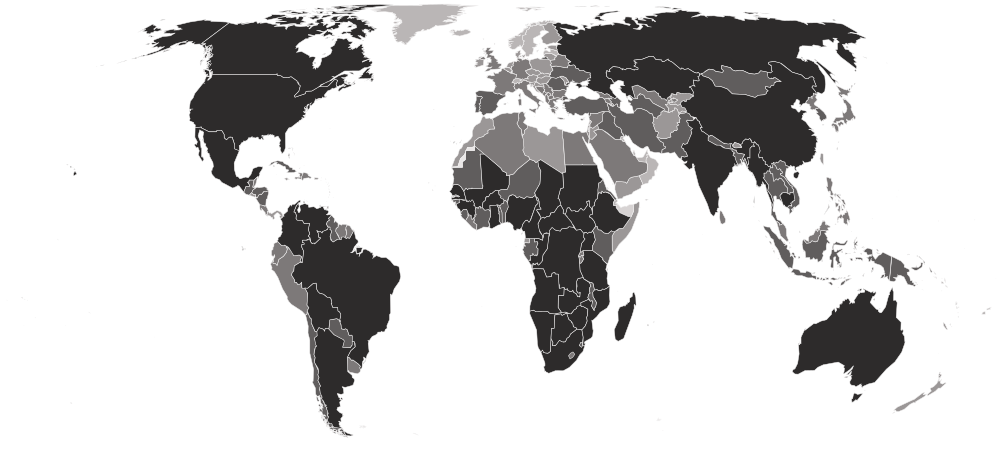
- Newest
- Burned Area, 2025
- Held
- 24 years · 5,016 rows
- Licence
- CC BY 4.0
0124 years
Every year
Every year comes from GWIS’s 2026 release, recalculated on one method. Each opens the full table for that year; each downloads as a CSV.
| Year | Countries | Change | Read | Download |
|---|---|---|---|---|
| Burned Area, 2025Newest | 209 | ±0 | September 29, 2026 | CSV |
| Burned Area, 2024 | 209 | ±0 | September 29, 2026 | CSV |
| Burned Area, 2023 | 209 | ±0 | September 29, 2026 | CSV |
| Burned Area, 2022 | 209 | ±0 | September 29, 2026 | CSV |
| Burned Area, 2021 | 209 | ±0 | September 29, 2026 | CSV |
| Burned Area, 2020 | 209 | ±0 | September 29, 2026 | CSV |
| Burned Area, 2019 | 209 | ±0 | September 29, 2026 | CSV |
| Burned Area, 2018 | 209 | ±0 | September 29, 2026 | CSV |
| Burned Area, 2017 | 209 | ±0 | September 29, 2026 | CSV |
| Burned Area, 2016 | 209 | ±0 | September 29, 2026 | CSV |
| Burned Area, 2015 | 209 | ±0 | September 29, 2026 | CSV |
| Burned Area, 2014 | 209 | ±0 | September 29, 2026 | CSV |
Show all 24 years
| Year | Countries | Change | Read | Download |
|---|---|---|---|---|
| Burned Area, 2013 | 209 | ±0 | September 29, 2026 | CSV |
| Burned Area, 2012 | 209 | ±0 | September 29, 2026 | CSV |
| Burned Area, 2011 | 209 | ±0 | September 29, 2026 | CSV |
| Burned Area, 2010 | 209 | ±0 | September 29, 2026 | CSV |
| Burned Area, 2009 | 209 | ±0 | September 29, 2026 | CSV |
| Burned Area, 2008 | 209 | ±0 | September 29, 2026 | CSV |
| Burned Area, 2007 | 209 | ±0 | September 29, 2026 | CSV |
| Burned Area, 2006 | 209 | ±0 | September 29, 2026 | CSV |
| Burned Area, 2005 | 209 | ±0 | September 29, 2026 | CSV |
| Burned Area, 2004 | 209 | ±0 | September 29, 2026 | CSV |
| Burned Area, 2003 | 209 | ±0 | September 29, 2026 | CSV |
| Burned Area, 2002 | 209 | — | September 29, 2026 | CSV |
Every year in one file, one row per country per year: burned-area-all-editions-nations-inquiry.csv
028 columns
What’s in the file
Every column, what it holds, how it is stored and what its values look like — what a reader needs before opening the file.
Burned area (hectares)is built fromBurned forest (hectares)Burned savanna (hectares)Burned shrubland and grassland (hectares)Burned cropland (hectares)Other burned land (hectares)
| Column | What it holds | Stored as | Range, 2025 | Distinct | Empty | Spread |
|---|---|---|---|---|---|---|
CountrycountryName | The country’s name, as this file spells it. | Text | — | 209 | 0 | |
ISO Codecountry_codeIdentifier | The ISO 3166-1 alpha-3 code, added by this site. Every table here joins on it. | Text · 3 letters | — | 209 | 0 | |
Burned area (hectares)burned_areaHeadline | The headline figure: Burned area (hectares). | Number · up to 14 decimals | 0.00051 share it50,562,034.820 Australiamiddle 13,824.019 Australiamiddle 13,824.019 | 154 | 0 | |
Burned forest (hectares)forest_haPart of the headline | Part of the burned area that was forest, in hectares. | Number · up to 14 decimals | 0.00099 share it3,472,812.413 Zambiamiddle 64.398 Zambiamiddle 64.398 | 102 | 0 | |
Burned savanna (hectares)savanna_haPart of the headline | Part of the burned area that was savanna, in hectares. | Number · up to 14 decimals | 0.00070 share it26,068,514.208 DR Congomiddle 643.975 DR Congomiddle 643.975 | 130 | 0 | |
Burned shrubland and grassland (hectares)shrub_grass_haPart of the headline | Part of the burned area that was shrubland or grassland, in hectares. | Number · up to 14 decimals | 0.00064 share it46,692,017.980Australiamiddle 3,219.880 | 138 | 0 | |
Burned cropland (hectares)cropland_haPart of the headline | Part of the burned area that was cropland, including fields burned after harvest, in hectares. | Number · up to 14 decimals | 0.00070 share it3,280,542.652 Indiamiddle 1,459.680 Indiamiddle 1,459.680 | 133 | 0 | |
Other burned land (hectares)other_haPart of the headline | Part of the burned area on any other kind of land, in hectares. | Number · up to 14 decimals | 0.000112 share it129,868.497Zambiamiddle 0.000 | 77 | 0 |
Profiled from the newest file. Range: the lowest and highest value, with the country holding it when only one does. Spread: countries in ten equal steps from lowest to highest. Neither end is better. The values describe a shape, not a score.
03209 countries across every year
Who is covered
How many countries each year holds, continent by continent, who joined and who left, and which places this site covers that the dataset never has.
| 2014 | 2015 | 2016 | 2017 | 2018 | 2019 | 2020 | 2021 | 2022 | 2023 | 2024 | 2025 | |
|---|---|---|---|---|---|---|---|---|---|---|---|---|
| Africa | 54 | 54 | 54 | 54 | 54 | 54 | 54 | 54 | 54 | 54 | 54 | 54 |
| Americas | 43 | 43 | 43 | 43 | 43 | 43 | 43 | 43 | 43 | 43 | 43 | 43 |
| Asia | 50 | 50 | 50 | 50 | 50 | 50 | 50 | 50 | 50 | 50 | 50 | 50 |
| Europe | 45 | 45 | 45 | 45 | 45 | 45 | 45 | 45 | 45 | 45 | 45 | 45 |
| Oceania | 17 | 17 | 17 | 17 | 17 | 17 | 17 | 17 | 17 | 17 | 17 | 17 |
| All | 209 | 209 | 209 | 209 | 209 | 209 | 209 | 209 | 209 | 209 | 209 | 209 |
The newest 12 of 24 years.
The same 209 countries in every year.
Not in this dataset · 16 places this site covers
GWIS gives no figure for these in any year held here. It is the publisher’s choice of scope, and each place’s profile shows what is measured.











04Provenance
Where it comes from
The path from the publisher to this page, and what was checked and changed on the way.
1 · Publisher
European Commission Joint Research Centre — Global Wildfire Information System (GWIS)
2 · Their file
Burned Area 2025
3 · Read by this site
September 29, 2026
Imported by a script that parses each figure and writes it down unrounded.4 · Stored as
24 files, one per year
Each downloads as a CSV, or every year together as burned-area-all-editions-nations-inquiry.csv5 · Used on
Its statistic page, and every profile it measures
Precision
The headline is stored to 14 decimals, as published.
Rounded by this site
Never. Tables on screen may show fewer decimals; the files never do.
Changed by this site
Reshaped into one row per country: regional and income-group totals are left out, only the columns listed are kept, each row gets its ISO 3166 code, and some country names are brought to one spelling. No value is recalculated, rescaled or rounded.
From the Global Wildfire Information System's country profiles, which total NASA's MODIS burned-area maps by country and by the kind of land that burned.
05Reuse
Licence and credit
What the publisher’s licence lets you do, what it asks of you, and a credit line and citation ready to copy.
Licence · checked September 29, 2026
- Share and redistribute it
- Adapt it and build on it
- Use it commercially
- Credit the publisher
- Say what you changed
Share, adapt and use commercially. Credit the publisher and say if you changed anything.
A credit line
Source: European Commission Joint Research Centre — Global Wildfire Information System (GWIS), Burned Area, via Nations Inquiry.
Cite this dataset
European Commission Joint Research Centre — Global Wildfire Information System (GWIS). Burned Area, 2002–2025 [data set]. As held by Nations Inquiry, https://nationsinquiry.com/datasets/burned-area
The publisher’s own citation: Global Wildfire Information System (GWIS), European Commission Joint Research Centre, Copernicus Emergency Management Service — country profiles. Burned area from NASA's MODIS MCD64A1 product: Giglio, L., Boschetti, L., Roy, D. P., Humber, M. L., & Justice, C. O. (2018). The Collection 6 MODIS burned area mapping algorithm and product. Remote Sensing of Environment 217: 72–85.
Plain-language summary, not legal advice. The licence text is what binds.
06Where it is used
Around the site
Where these numbers appear on this site, and the datasets nearest to it.
Charted
Burned Area by countryWho is highest, the map, the spread, who rose and fell, and the records.
Subjects
Near neighbours
- CO₂ Emissions per CapitaGlobal Carbon Project · 75 held · 1950–2024
- Ecological FootprintGlobal Footprint Network · 65 held · 1961–2025
- Water StressFAO · 24 held · 2000–2023
07Questions
Burned Area: questions and answers
What is the Burned Area?
This is how much land burned in a year — forest, savanna, grassland and farmland — as seen from NASA's MODIS satellites and added up per country by the European Commission's Global Wildfire Information System. It counts wildfires and every other vegetation fire, including fires set to clear fields.
Which years of the Burned Area can I download?
All 24, from 2002 to 2025, each as a CSV file, or every year together in one CSV.
Does GWIS rank countries on it?
No, and this site does not order it either. The files hold values only.
Can I use it commercially?
Yes, under CC BY 4.0, with credit to GWIS. The licence text is linked on this page.