Loading…
UN IGME · Infant Mortality Rate
Infant mortality rate by country
How many babies die before their first birthday?
Of the 200 countries compared in 2024, San Marino had the lowest reading, 1.214, and South Sudan had the highest reading, 71.870. In the middle country the figure was 12.260. Among the 82 countries measured in every edition since 1953, the middle one moved from 98.812 to 11.629.
Infant mortality rate · 2024
Context statistic

Lowest of 200San Marino
1.214012024 · position · derived
Who leads
The three countries at the lowest end of 200 compared, the three at the other end, and the first on each continent.
 1
1Photo: Matl derivative work: Jjtkk · CC BY-SA 3.0, greyscale
 2
2Photo: Andrus Uuetalu derivative work: Jjtkk · CC BY-SA 3.0 ee, greyscale
 3
3Photo: zedlik , cropped by Jjtkk · CC BY-SA 3.0, greyscale
Highest in 2024
 South Sudan71.870
 Nigeria69.771
 Niger65.622
Where a country sits says how it compares with the others measured, and nothing about why.
Lowest on each continent
- Africa
 Libya7.890
 - Americas
- Asia
 Japan1.817
 - EuropeSan Marino1.214
- Oceania
 Australia3.090
 - Every region
02Every measured country
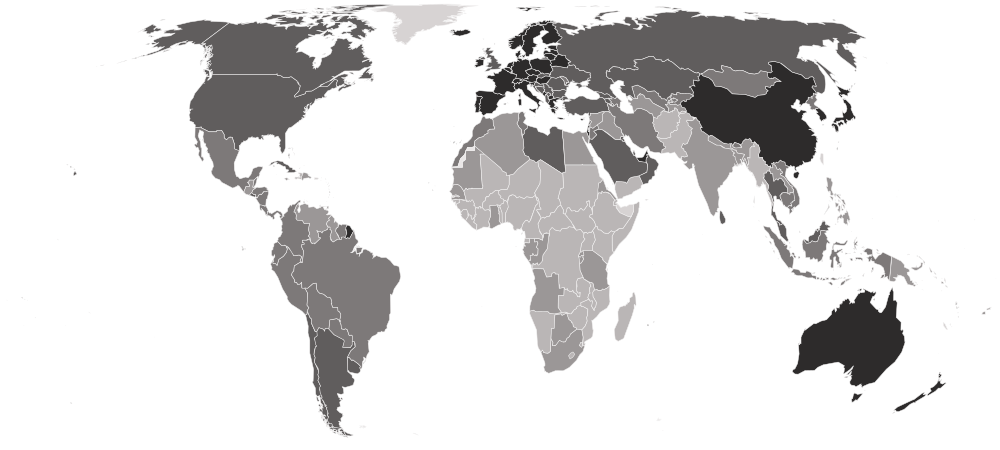
Infant mortality rate on a map
Each country is shaded by its value, in five groups holding the same number of countries. Hover a country for its value, or select it to open its profile. Below the map, each continent’s middle country.
Darker is a lower value — the better end.
- 32.802–71.870
- 16.378–32.697
- 9.081–16.365
- 4.121–9.055
- 1.214–4.106
- No reading in 2024
- Europe
3.118
the middle country, of 43 measured · 49 members
San Marino1.214 Moldova15.104
Lowest and highest reading in Europe.
- Americas
11.090
the middle country, of 39 measured · 48 members
 Turks and Caicos Islands3.048
 Haiti38.986
Lowest and highest reading in Americas.
- Asia
11.981
the middle country, of 48 measured · 52 members
Japan1.817 Afghanistan48.315
Lowest and highest reading in Asia.
- Oceania
16.442
the middle country, of 16 measured · 21 members
Australia3.090 Kiribati38.810
Lowest and highest reading in Oceania.
- Africa
35.482
the middle country, of 54 measured · 55 members
Libya7.890South Sudan71.870Lowest and highest reading in Africa.
- Every region
22 sub-regions, lowest middle country first
- Northern Europe
2.138
the middle country, of 10 measured · 13 members
 Estonia1.530
 United Kingdom4.134
Lowest and highest reading in Northern Europe.
- Southern Europe
2.669
the middle country, of 15 measured · 17 members
San Marino1.214 Albania8.252
Lowest and highest reading in Southern Europe.
- Western Europe
3.128
the middle country, of 8 measured · 9 members
 Luxembourg1.866
 France3.430
Lowest and highest reading in Western Europe.
- Eastern Asia
4.079
the middle country, of 5 measured · 8 members
Japan1.817 North Korea13.319
Lowest and highest reading in Eastern Asia.
- Eastern Europe
4.391
the middle country, of 10 measured · 10 members
 Belarus1.802Moldova15.104
Lowest and highest reading in Eastern Europe.
- Western Asia
8.164
the middle country, of 18 measured · 19 members
 Israel2.659
 Yemen33.847
Lowest and highest reading in Western Asia.
- Central America
11.384
the middle country, of 8 measured · 8 members
 El Salvador8.836
 Guatemala17.194
Lowest and highest reading in Central America.
- Caribbean
11.394
the middle country, of 17 measured · 24 members
Turks and Caicos Islands3.048Haiti38.986Lowest and highest reading in Caribbean.
- South America
11.622
the middle country, of 12 measured · 12 members
 Chile5.798
 Guyana23.235
Lowest and highest reading in South America.
- Polynesia
12.259
the middle country, of 5 measured · 7 members
 Tonga7.775
 Niue22.211
Lowest and highest reading in Polynesia.
- Central Asia
14.763
the middle country, of 5 measured · 5 members
 Kazakhstan7.420
 Turkmenistan30.447
Lowest and highest reading in Central Asia.
- South-eastern Asia
15.175
the middle country, of 11 measured · 11 members
 Singapore2.204
 Timor-Leste34.633
Lowest and highest reading in South-eastern Asia.
- Northern Africa
17.097
the middle country, of 6 measured · 6 members
Libya7.890 Sudan42.913
Lowest and highest reading in Northern Africa.
- Micronesia
20.303
the middle country, of 5 measured · 7 members
 Nauru7.719Kiribati38.810
Lowest and highest reading in Micronesia.
- Southern Asia
22.241
the middle country, of 9 measured · 9 members
 Maldives4.745Afghanistan48.315
Lowest and highest reading in Southern Asia.
- Eastern Africa
34.816
the middle country, of 18 measured · 19 members
 Seychelles12.872South Sudan71.870
Lowest and highest reading in Eastern Africa.
- Southern Africa
36.410
the middle country, of 5 measured · 5 members
 South Africa24.212
 Lesotho56.338
Lowest and highest reading in Southern Africa.
- Middle Africa
40.250
the middle country, of 9 measured · 9 members
 São Tomé and Príncipe9.166
 Central African Republic58.826
Lowest and highest reading in Middle Africa.
- Western Africa
44.229
the middle country, of 16 measured · 16 members
 Cabo Verde10.627Nigeria69.771
Lowest and highest reading in Western Africa.
- Australia and New Zealand
2 of 2 measured — too few for a middle: Australia, New Zealand.
Australia3.090 New Zealand4.022
Lowest and highest reading in Australia and New Zealand.
- Melanesia
4 of 5 measured — too few for a middle: Fiji, Papua New Guinea, Solomon Islands, Vanuatu.
 Vanuatu14.430
 Papua New Guinea31.278
Lowest and highest reading in Melanesia.
- Northern America
2 of 4 measured — too few for a middle: Canada, United States.
 Canada4.717
 United States5.482
Lowest and highest reading in Northern America.
03The whole field at once
The spread
200 countries, one dot each, on one scale — further right is a higher value. Half the countries are above 12.260; a quarter are above 27.960, and a quarter below 5.085. The bar in each row marks that continent’s middle country.
04All 200 ever measured
Every country
In order, highest value first — position 1 is the highest value, the way UN IGME’s own tables read. “=” marks a position shared with another country. UN Inter-agency Group for Child Mortality Estimation (UN IGME) ranks nobody on this measure; the position is derived here by ordering the published values. The estimates carry full precision, so nothing ties. Where a country has little registration data its bounds are wide, and two countries a few positions apart may not differ in any way the evidence can show — the bounds are printed for that reason.
Showing 25 of 200 countries



























































































































































Values for 2024. The change column compares 2024 with 2023 only; the sparkline covers the recent editions.
051953–2024 · 72 reference years
Over time
Each point is one year — 1953 to 2024. These are modelled estimates fitted to whatever censuses, surveys and vital registration a country has, which is why every country has a figure for every year and why each carries published uncertainty bounds.
- the middle country
- the middle half of countries
- the middle of the 82 countries measured every time
- each continent’s middle country
The same, year by year
| Year | Countries | Middle country | Middle half | Measured every time |
|---|---|---|---|---|
| 2024 | 200 | 12.260 | 5.085 – 27.960 | 11.629 |
| 2023 | 200 | 12.865 | 5.151 – 28.753 | 11.720 |
| 2022 | 200 | 12.808 | 5.219 – 29.654 | 11.811 |
| 2021 | 200 | 13.198 | 5.263 – 30.628 | 11.973 |
| 2020 | 200 | 13.458 | 5.480 – 31.447 | 12.386 |
| 2019 | 200 | 13.857 | 5.680 – 32.948 | 12.753 |
| 2018 | 200 | 14.049 | 5.998 – 32.714 | 13.016 |
| 2017 | 200 | 14.351 | 6.264 – 33.490 | 13.268 |
| 2016 | 200 | 14.761 | 6.380 – 34.325 | 13.390 |
| 2015 | 200 | 15.413 | 6.637 – 35.553 | 13.407 |
| 2014 | 200 | 15.751 | 6.884 – 36.744 | 13.420 |
| 2013 | 200 | 15.797 | 7.061 – 37.683 | 13.456 |
| 2012 | 200 | 16.171 | 7.232 – 38.695 | 13.525 |
| 2011 | 200 | 16.531 | 7.384 – 39.881 | 13.933 |
| 2010 | 200 | 16.712 | 7.523 – 41.503 | 14.201 |
| 2009 | 200 | 17.393 | 7.678 – 42.781 | 13.987 |
| 2008 | 200 | 17.716 | 7.887 – 43.220 | 13.849 |
| 2007 | 200 | 18.424 | 8.063 – 45.355 | 13.953 |
| 2006 | 200 | 19.183 | 8.462 – 46.897 | 14.392 |
| 2005 | 200 | 19.706 | 8.775 – 48.986 | 14.777 |
| 2004 | 200 | 21.131 | 9.122 – 51.374 | 15.472 |
| 2003 | 200 | 22.630 | 9.606 – 53.393 | 15.576 |
| 2002 | 200 | 23.346 | 10.005 – 56.406 | 15.762 |
| 2001 | 200 | 25.173 | 10.436 – 58.369 | 15.927 |
| 2000 | 200 | 26.297 | 10.710 – 61.156 | 16.164 |
| 1999 | 200 | 26.909 | 11.132 – 64.052 | 16.519 |
| 1998 | 200 | 27.538 | 11.737 – 67.083 | 16.971 |
| 1997 | 200 | 28.495 | 11.991 – 69.329 | 17.479 |
| 1996 | 200 | 29.761 | 12.456 – 70.219 | 18.087 |
| 1995 | 200 | 30.981 | 12.764 – 71.326 | 18.765 |
| 1994 | 200 | 32.246 | 13.313 – 71.634 | 19.289 |
| 1993 | 200 | 33.300 | 14.162 – 72.977 | 19.646 |
| 1992 | 200 | 34.737 | 14.340 – 73.350 | 19.931 |
| 1991 | 200 | 36.185 | 14.696 – 73.477 | 20.493 |
| 1990 | 200 | 37.342 | 15.108 – 73.929 | 21.107 |
| 1989 | 200 | 38.655 | 15.711 – 76.005 | 21.737 |
| 1988 | 200 | 39.857 | 16.526 – 77.944 | 22.018 |
| 1987 | 200 | 41.872 | 17.451 – 80.861 | 22.405 |
| 1986 | 200 | 43.098 | 18.402 – 83.867 | 23.007 |
| 1985 | 200 | 44.245 | 19.174 – 86.665 | 24.020 |
| 1984 | 192 | 45.312 | 20.388 – 89.223 | 25.307 |
| 1983 | 189 | 48.136 | 20.871 – 92.048 | 27.072 |
| 1982 | 187 | 49.729 | 21.481 – 93.412 | 29.031 |
| 1981 | 185 | 51.221 | 22.474 – 95.461 | 31.322 |
| 1980 | 182 | 52.876 | 23.907 – 99.310 | 33.084 |
| 1979 | 180 | 53.795 | 24.826 – 100.946 | 34.530 |
| 1978 | 179 | 54.815 | 25.820 – 103.014 | 35.715 |
| 1977 | 175 | 56.400 | 27.335 – 106.337 | 36.995 |
| 1976 | 174 | 58.095 | 29.462 – 111.222 | 38.439 |
| 1975 | 171 | 58.290 | 31.278 – 112.318 | 40.103 |
| 1974 | 168 | 60.444 | 31.858 – 115.606 | 42.493 |
| 1973 | 168 | 61.665 | 32.775 – 117.661 | 44.083 |
| 1972 | 166 | 63.471 | 33.955 – 118.727 | 46.508 |
| 1971 | 163 | 64.421 | 34.294 – 119.167 | 48.127 |
| 1970 | 158 | 67.007 | 35.622 – 121.887 | 50.127 |
| 1969 | 158 | 69.457 | 36.928 – 122.734 | 52.004 |
| 1968 | 152 | 72.208 | 36.796 – 124.385 | 54.424 |
| 1967 | 148 | 75.099 | 38.898 – 123.804 | 56.695 |
| 1966 | 146 | 77.952 | 40.554 – 128.236 | 59.507 |
| 1965 | 143 | 80.868 | 42.370 – 129.253 | 61.983 |
| 1964 | 140 | 84.754 | 44.886 – 130.758 | 63.965 |
| 1963 | 138 | 87.454 | 47.037 – 133.882 | 67.177 |
| 1962 | 136 | 90.340 | 48.473 – 136.354 | 68.966 |
| 1961 | 134 | 89.529 | 47.791 – 138.679 | 69.863 |
| 1960 | 133 | 92.068 | 48.047 – 138.418 | 71.701 |
| 1959 | 129 | 92.973 | 50.227 – 138.736 | 75.430 |
| 1958 | 125 | 93.524 | 52.722 – 139.845 | 80.030 |
| 1957 | 116 | 99.130 | 63.989 – 142.393 | 84.610 |
| 1956 | 113 | 97.860 | 65.518 – 143.571 | 87.334 |
| 1955 | 103 | 101.767 | 54.598 – 143.910 | 90.798 |
| 1954 | 94 | 98.469 | 54.525 – 144.689 | 95.709 |
| 1953 | 82 | 98.812 | 52.091 – 142.018 | 98.812 |
062023 → 2024
Who rose and fell
The biggest changes in value between the two newest editions — reference years recalculated in one report, not two separate publications. Places are shown second, because they also move when other countries do.
Improved most
before → after200 countries were measured in both 2023 and 2024.
07Across every edition
Infant mortality rate in records
The extremes of the statistic. A record reached by more than one country names none of them.
Highest reading on record
484.011
Deaths before age one (per 1,000 live births)
Lowest reading on record
1.214
Deaths before age one (per 1,000 live births)
Biggest improvement between editions
−325.559
484.011 → 158.452
Biggest decline between editions
+312.794
171.218 → 484.011
Most improved since first measured
−247.126
280.973 → 33.847
At the top most often
27 of 72
editions, alone at the first-listed end
08The measure
About infant mortality rate
The infant mortality rate is how many children out of every thousand born alive die before their first birthday. Most child deaths happen in the first year, and many in the first month, so it is the part of child mortality most tied to care around birth — clean delivery, newborn care and vaccination.
What the number is: Deaths before age one (per 1,000 live births).
What it does not measure
It counts deaths in the first year, not the health of the babies who survive; deaths from age one to five are in the under-five mortality rate.
09Where it fits
Connections
Its part in the Country Index, the statistics whose values line up most closely with it across countries, and others on the same subject.
In the Country Index
Context, with no vote
This statistic is published in full under Health & Wellbeing and Development & Human Capital, but does not help decide any Country Index standing.
Health & WellbeingDevelopment & Human CapitalWhich statistics vote, and why
Moves with
Where infant mortality rate is higher, these tend to be higher too.
- Under-Five Mortality RateKeyUN IGME · 200 countries in commonρ 1.00
- Gender Inequality IndexUNDP Human Development Report Office · 172 countries in commonρ 0.92
- Maternal Mortality RatioKeyMMEIG · 194 countries in commonρ 0.89
Moves against
Where infant mortality rate is higher, these tend to be lower.
- Inequality-adjusted Human Development IndexUNDP Human Development Report Office · 168 countries in commonρ −0.93
- Human Capital IndexWorld Bank Group · 170 countries in commonρ −0.92
- Life Expectancy at BirthKeyUN DESA Population Division · 200 countries in commonρ −0.91
Rank correlation (ρ, from −1 to 1) across countries, on each statistic’s newest edition, out of 189 statistics sharing at least 80 countries with this one. Two statistics that move together do not cause each other.
10Keep reading
Explore further
The countries at either end
More from UN IGME
11Questions
Infant mortality rate: questions and answers
Which country has the lowest infant mortality rate?
San Marino, at 1.214, among the 200 countries compared in 2024.
Which country has the highest infant mortality rate?
South Sudan, at 71.870, among the 200 countries compared in 2024.
How many countries does the Infant Mortality Rate cover?
200 in 2024. The number measured varies from 82 to 200 between editions.
What is the world average infant mortality rate?
This site does not calculate a world average, which would depend on how countries are weighted. In the middle country of the 200 compared in 2024, the figure was 12.260.
Is this UN Inter-agency Group for Child Mortality Estimation (UN IGME)’s own ranking?
No. UN Inter-agency Group for Child Mortality Estimation (UN IGME) publishes the values but ranks nobody; the position on this page is derived by Nations Inquiry by ordering the published values, and equal values share a position.
How often is the Infant Mortality Rate published?
This site holds 72 reference years, 1953–2024, all recalculated in UN Inter-agency Group for Child Mortality Estimation (UN IGME)’s 2025 report on one method — not 72 separate publications.
Where does the data come from, and can I download it?
From UN Inter-agency Group for Child Mortality Estimation (UN IGME), under CC BY 3.0 IGO. From the UN Inter-agency Group for Child Mortality Estimation, read out of UNICEF’s own SDMX warehouse (CME_MRY0) rather than the World Bank’s copy, which rounds to one decimal. The UN Population Division publishes a separate infant mortality estimate; this site uses IGME’s, the UN's designated producer. Every edition is on this site’s Datasets pages as a full table, and downloads as a CSV file with every value unrounded.
12Method
Sources, method and citation
Source
Infant Mortality Rate — UN Inter-agency Group for Child Mortality Estimation (UN IGME)
From the UN Inter-agency Group for Child Mortality Estimation, read out of UNICEF’s own SDMX warehouse (CME_MRY0) rather than the World Bank’s copy, which rounds to one decimal. The UN Population Division publishes a separate infant mortality estimate; this site uses IGME’s, the UN's designated producer.
Newest edition
Report year 2024Data year 2024
Cite the source as: UN Inter-agency Group for Child Mortality Estimation. Levels and Trends in Child Mortality. New York: UNICEF.
Licence: CC BY 3.0 IGO, checked 2026-09-09.
How this page reads the numbers
- UN Inter-agency Group for Child Mortality Estimation (UN IGME) ranks nobody on this measure. The position is derived by Nations Inquiry by ordering the published values; equal values share a position.
- Which end is better follows the publisher’s own reading of the measure.
- A country is named at an end only when it holds that value alone. Where several share it, the page says how many and names none first.
- Values are stored exactly as published and trimmed only for display. “The middle country” is the median of the countries measured, not a world average.
The file itself, column by column — where it came from, what each column holds, and every edition as a CSV — is on its dataset page.
Photographs
The countries at the top of this statistic, from their profiles: Wikimedia Commons, shown in greyscale, each used under the licence named.
- San Marino — Matl derivative work: Jjtkk, CC BY-SA 3.0
- Estonia — Andrus Uuetalu derivative work: Jjtkk, CC BY-SA 3.0 ee
- Belarus — zedlik , cropped by Jjtkk, CC BY-SA 3.0
Cite this page
Nations Inquiry (2026). Infant mortality rate by country: Infant Mortality Rate, data from UN Inter-agency Group for Child Mortality Estimation (UN IGME). https://nationsinquiry.com/statistics/infant-mortality