World Bank Group · Human Capital Index
Human Capital Index by country
How productive will a child born today become, given the schooling and health on offer?
Singapore placed first of the 172 countries compared in 2020, at 0.87913, and Central African Republic last, at 0.29163. In the middle country the figure was 0.56383. Among the 103 countries measured in every edition since 2010, the middle one moved from 0.59403 to 0.62864.
Share
Human Capital Index · 2020
Context statistic

Highest of 172Singapore
0.87913012020 · position · derived
Who leads
The three countries at the highest end of 172 compared, the three at the other end, and the first on each continent.
 1
Photo: Khairul Nizam . · CC BY 2.0, greyscale
 2
Photo: Base64 and Derivative work by Globe-trotter · CC BY-SA 3.0, greyscale
 3
Photo: JurriaanH · CC BY-SA 3.0, greyscale

Lowest in 2020
- 172
 Central African Republic0.29163
- 171
 Chad0.29978
- 170
 South Sudan0.30652
Positions out of 172. Where a country sits says how it compares with the others measured, and nothing about why.
Highest on each continent
- Africa
 Seychelles0.63278
- Americas
 Canada0.79752
- AsiaSingapore0.87913
- Europe
 Finland0.79600
- Oceania
 New Zealand0.77593
- Every region
02Every measured country
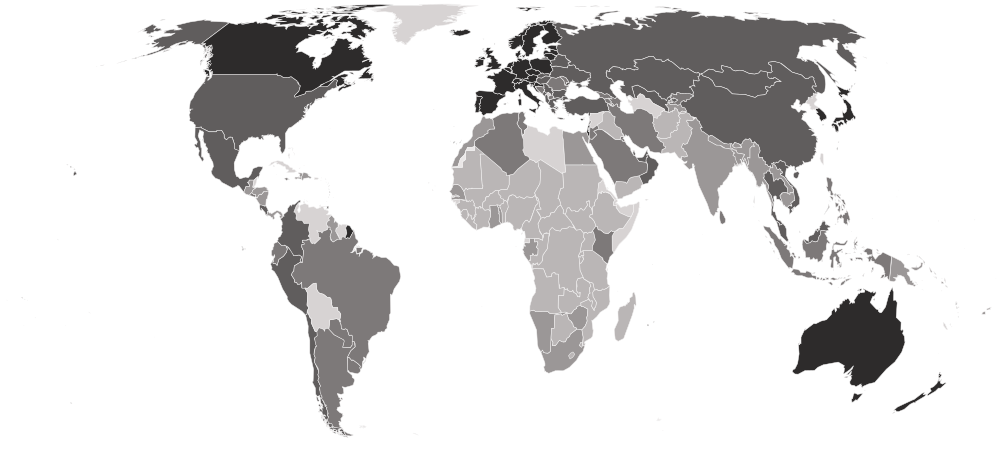
Human Capital Index on a map
Each country is shaded by its value, in five groups holding the same number of countries. Hover a country for its value, or select it to open its profile. Below the map, each continent’s middle country.
Darker is a higher value — the better end.
- 0.29163–0.41927
- 0.41987–0.51513
- 0.51596–0.60214
- 0.60256–0.70176
- 0.70605–0.87913
- No reading in 2020
- Europe
0.72782
the middle country, of 39 measured · 49 members
Finland0.79600 North Macedonia0.55735
Highest and lowest reading in Europe.
- Asia
0.58670
the middle country, of 46 measured · 52 members
Singapore0.87913 Yemen0.37278
Highest and lowest reading in Asia.
- Americas
0.57563
the middle country, of 28 measured · 48 members
Canada0.79752 Haiti0.44656
Highest and lowest reading in Americas.
- Oceania
0.50597
the middle country, of 13 measured · 21 members
New Zealand0.77593 Solomon Islands0.41987
Highest and lowest reading in Oceania.
- Africa
0.39446
the middle country, of 46 measured · 55 members
Seychelles0.63278Central African Republic0.29163Highest and lowest reading in Africa.
- Every region
22 sub-regions, highest middle country first
- Eastern Asia
0.79722
the middle country, of 6 measured · 8 members
 Hong Kong0.81276
 Mongolia0.61440
Highest and lowest reading in Eastern Asia.
- Northern Europe
0.77413
the middle country, of 10 measured · 13 members
Finland0.79600 Lithuania0.70605
Highest and lowest reading in Northern Europe.
- Western Europe
0.75612
the middle country, of 7 measured · 9 members
 Netherlands0.78992
 Luxembourg0.68615
Highest and lowest reading in Western Europe.
- Southern Europe
0.69963
the middle country, of 12 measured · 17 members
 Slovenia0.77499North Macedonia0.55735
Highest and lowest reading in Southern Europe.
- Eastern Europe
0.67320
the middle country, of 10 measured · 10 members
 Poland0.75309
 Moldova0.58415
Highest and lowest reading in Eastern Europe.
- South America
0.59876
the middle country, of 9 measured · 12 members
 Chile0.65160
 Guyana0.49523
Highest and lowest reading in South America.
- Western Asia
0.57900
the middle country, of 17 measured · 19 members
 Cyprus0.75552Yemen0.37278
Highest and lowest reading in Western Asia.
- Caribbean
0.55491
the middle country, of 10 measured · 24 members
 Trinidad and Tobago0.60349Haiti0.44656
Highest and lowest reading in Caribbean.
- South-eastern Asia
0.54004
the middle country, of 11 measured · 11 members
Singapore0.87913 Timor-Leste0.45431
Highest and lowest reading in South-eastern Asia.
- Central America
0.50810
the middle country, of 7 measured · 8 members
 Costa Rica0.62864
 Guatemala0.46127
Highest and lowest reading in Central America.
- Northern Africa
0.50412
the middle country, of 5 measured · 6 members
 Algeria0.53456
 Sudan0.37745
Highest and lowest reading in Northern Africa.
- Southern Asia
0.48440
the middle country, of 8 measured · 9 members
 Sri Lanka0.59832
 Afghanistan0.40028
Highest and lowest reading in Southern Asia.
- Southern Africa
0.41403
the middle country, of 5 measured · 5 members
 Namibia0.44644
 Eswatini0.37250
Highest and lowest reading in Southern Africa.
- Eastern Africa
0.39199
the middle country, of 15 measured · 19 members
Seychelles0.63278South Sudan0.30652Highest and lowest reading in Eastern Africa.
- Western Africa
0.38072
the middle country, of 14 measured · 16 members
 Ghana0.45006
 Niger0.31569
Highest and lowest reading in Western Africa.
- Middle Africa
0.36637
the middle country, of 7 measured · 9 members
 Gabon0.45761Central African Republic0.29163
Highest and lowest reading in Middle Africa.
- Australia and New Zealand
2 of 2 measured — too few for a middle: Australia, New Zealand.
New Zealand0.77593 Australia0.77024
Highest and lowest reading in Australia and New Zealand.
- Central Asia
4 of 5 measured — too few for a middle: Kazakhstan, Kyrgyzstan, Tajikistan, Uzbekistan.
 Kazakhstan0.62851
 Tajikistan0.50412
Highest and lowest reading in Central Asia.
- Melanesia
4 of 5 measured — too few for a middle: Fiji, Papua New Guinea, Solomon Islands, Vanuatu.
 Fiji0.50857Solomon Islands0.41987
Highest and lowest reading in Melanesia.
- Micronesia
4 of 7 measured — too few for a middle: Kiribati, Marshall Islands, Micronesia, Palau.
 Palau0.58811
 Marshall Islands0.42340
Highest and lowest reading in Micronesia.
- Northern America
2 of 4 measured — too few for a middle: Canada, United States.
Canada0.79752 United States0.70176
Highest and lowest reading in Northern America.
- Polynesia
3 of 7 measured — too few for a middle: Samoa, Tonga, Tuvalu.
 Samoa0.54842
 Tuvalu0.44758
Highest and lowest reading in Polynesia.
03The whole field at once
The spread
172 countries, one dot each, on one scale — further right is a higher value. Half the countries are above 0.56383; a quarter are above 0.66699, and a quarter below 0.44653. The bar in each row marks that continent’s middle country.
04All 172 ever measured
Every country
In order, highest value first. “=” marks a position shared with another country. World Bank Group ranks nobody on this measure; the position is derived here by ordering the published values. This is a closed series rather than one waiting for a new edition: the Human Capital Project has folded its reporting into other World Bank output.
Showing 25 of 172 countries














































































































Values for 2020. The change column compares 2020 with 2018 only; the sparkline covers the recent editions.
052010–2020 · 4 editions
Over time
Four editions only — 2010, 2017, 2018 and 2020 — and the first two were back-calculated for the 2018 report rather than published at the time, which is why coverage climbs across them.
- the middle country
- the middle half of countries
- the middle of the 103 countries measured every time
- each continent’s middle country
The same, year by year
| Year | Countries | Middle country | Middle half | Measured every time |
|---|---|---|---|---|
| 2020 | 172 | 0.56383 | 0.44653 – 0.66699 | 0.62864 |
| 2018 | 166 | 0.55800 | 0.44127 – 0.68544 | 0.62931 |
| 2017 | 156 | 0.56700 | 0.43150 – 0.69575 | 0.62200 |
| 2010 | 103 | 0.59403 | 0.51189 – 0.71656 | 0.59403 |
062018 → 2020
Who rose and fell
The biggest changes in value between the two newest editions. Places are shown second, because they also move when other countries do.
Improved most
before → after Micronesia0.46642 → 0.50597 · 114th → 106th+0.03955
 Macau0.76329 → 0.79567 · 23rd → 7th+0.03238
- Samoa0.52239 → 0.54842 · 99th → 91st+0.02603
- Costa Rica0.60326 → 0.62864 · 65th → 54th+0.02538
 Türkiye0.62531 → 0.64926 · 55th → 48th+0.02395
Declined most
before → after- Kazakhstan0.77706 → 0.62851 · 13th → 55th−0.14855
 Serbia0.75949 → 0.67661 · 27th → 42nd−0.08288
 Bulgaria0.67028 → 0.61390 · 45th → 60th−0.05638
 Azerbaijan0.62931 → 0.57777 · 53rd → 83rd−0.05154
 Russia0.72895 → 0.68142 · 35th → 41st−0.04753
166 countries were measured in both 2018 and 2020. The field changed from 166 to 172 countries, so a place can move for reasons that have nothing to do with the country itself.
07Across every edition
Human Capital Index in records
The extremes of the statistic. A record reached by more than one country names none of them.
Highest reading on record
0.88708
HCI score (0–1)
Lowest reading on record
0.28607
HCI score (0–1)
Biggest improvement between editions
+0.15197
0.59403 → 0.74600
Biggest decline between editions
−0.14855
0.77706 → 0.62851
Most improved since first measured
+0.14735
0.64833 → 0.79567
At the top most often
4 of 4
editions, alone at the first-listed end
08The measure
About Human Capital Index
The World Bank’s Human Capital Index asks a blunt question: how productive will a child born today be by the age of 18, given the schooling and health their country actually delivers? A score of 1 means complete education and full health, and no country is there.
What the number is: HCI score (0–1).
09Where it fits
Connections
Its part in the Country Index, the statistics whose values line up most closely with it across countries, and others on the same subject.
In the Country Index
Context, with no vote
This statistic is published in full under Health & Wellbeing and Development & Human Capital, but does not help decide any Country Index standing.
Health & WellbeingDevelopment & Human CapitalWhich statistics vote, and why
Moves with
Where Human Capital Index is higher, these tend to be higher too.
- Learning-Adjusted Years of SchoolWorld Bank Group · 172 countries in commonρ 0.99
- Inequality-adjusted Human Development IndexUNDP Human Development Report Office · 157 countries in commonρ 0.95
- Human Development IndexKeyUNDP Human Development Report Office · 171 countries in commonρ 0.94
Moves against
Where Human Capital Index is higher, these tend to be lower.
- Stillbirth RateUN IGME · 170 countries in commonρ −0.94
- Gender Inequality IndexUNDP Human Development Report Office · 157 countries in commonρ −0.93
- Learning PovertyWorld Bank Group and UNESCO Institute for Statistics · 107 countries in commonρ −0.93
Rank correlation (ρ, from −1 to 1) across countries, on each statistic’s newest edition, out of 378 statistics sharing at least 80 countries with this one. Two statistics that move together do not cause each other.
10Keep reading
Explore further
The data, edition by edition
The countries at either end
More from World Bank Group
11Questions
Human Capital Index: questions and answers
Which country has the highest Human Capital Index?
Singapore, at 0.87913, among the 172 countries compared in 2020.
Which country has the lowest Human Capital Index?
Central African Republic, at 0.29163, among the 172 countries compared in 2020.
How many countries does the Human Capital Index cover?
172 in 2020. The number measured varies from 103 to 172 between editions.
What is the world average Human Capital Index?
This site does not calculate a world average, which would depend on how countries are weighted. In the middle country of the 172 compared in 2020, the figure was 0.56383.
Is this World Bank Group’s own ranking?
No. World Bank Group publishes the values but ranks nobody; the position on this page is derived by Nations Inquiry by ordering the published values, and equal values share a position.
How often is the Human Capital Index published?
This site holds 4 editions, describing 2010 to 2020.
Where does the data come from, and can I download it?
From World Bank Group, under CC BY 4.0. Pulled from the World Bank’s indicator API (HD.HCI.OVRL), covering 103 to 172 countries across the four editions. Every edition is on this site’s Datasets pages as a full table, and downloads as a CSV file with every value unrounded.
12Method
Sources, method and citation
Source
Human Capital Index — World Bank Group
Pulled from the World Bank’s indicator API (HD.HCI.OVRL), covering 103 to 172 countries across the four editions.
Newest edition
Report year 2020Data year 2020
Cite the source as: World Bank. The Human Capital Index. Washington, DC: World Bank Group.
Licence: CC BY 4.0, checked 2026-08-29.
How this page reads the numbers
- World Bank Group ranks nobody on this measure. The position is derived by Nations Inquiry by ordering the published values; equal values share a position.
- Which end is better follows the publisher’s own reading of the measure.
- A country is named at an end only when it holds that value alone. Where several share it, the page says how many and names none first.
- Values are stored exactly as published and trimmed only for display. “The middle country” is the median of the countries measured, not a world average.
The file itself, column by column — where it came from, what each column holds, and every edition as a CSV — is on its dataset page.
Photographs
The countries at the top of this statistic, from their profiles: Wikimedia Commons, shown in greyscale, each used under the licence named.
- Singapore — Khairul Nizam ., CC BY 2.0
- Hong Kong — Base64 and Derivative work by Globe-trotter, CC BY-SA 3.0
- Japan — JurriaanH, CC BY-SA 3.0
Cite this page
Nations Inquiry (2026). Human Capital Index by country: Human Capital Index, data from World Bank Group. https://nationsinquiry.com/statistics/human-capital-index