Loading…
World Bank Group · Learning-Adjusted Years of School
Learning-adjusted years of school by country
How many years of real learning does a child get by age 18?
Singapore placed first of the 172 countries compared in 2020, at 12.8133, and Liberia last, at 2.2065. In the middle country the figure was 7.9414. Among the 103 countries measured in every edition since 2010, the middle one moved from 8.5039 to 8.9933.
Part ofEducation & Knowledge
Learning-adjusted years of school · 2020
Context statistic

Highest of 172Singapore
12.8133012020 · position · derived
Who leads
The three countries at the highest end of 172 compared, the three at the other end, and the first on each continent.
 1
1Photo: Khairul Nizam . · CC BY 2.0, greyscale
 2
2Photo: Base64 and Derivative work by Globe-trotter · CC BY-SA 3.0, greyscale
 3
3Photo: Joonas Lyytinen · CC BY-SA 2.5, greyscale
Lowest in 2020
- 172
 Liberia2.2065
 - 171
 South Sudan2.5113
 - 170
 Mali2.5784
Positions out of 172. Where a country sits says how it compares with the others measured, and nothing about why.
Highest on each continent
- Africa
 Seychelles9.7008
 - Americas
 Canada11.7240
 - AsiaSingapore12.8133
- Europe
 Finland11.7388
 - Oceania
 New Zealand11.3902
 - Every region
02Every measured country
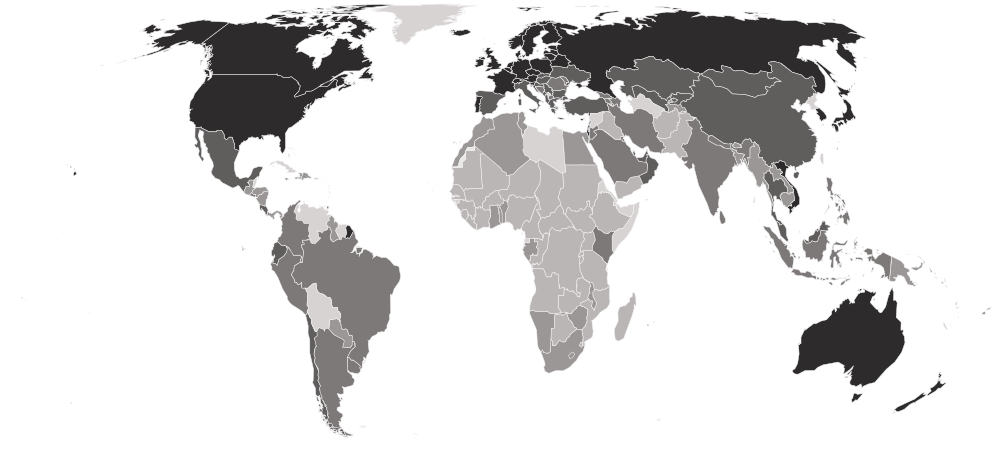
Learning-adjusted years of school on a map
Each country is shaded by its value, in five groups holding the same number of countries. Hover a country for its value, or select it to open its profile. Below the map, each continent’s middle country.
Darker is a higher value — the better end.
- 2.2065–5.3754
- 5.5057–7.0916
- 7.1022–8.6322
- 8.6450–10.5147
- 10.5568–12.8133
- No reading in 2020
- Europe
10.8981
the middle country, of 39 measured · 49 members
Finland11.7388 North Macedonia7.2964
Highest and lowest reading in Europe.
- Americas
8.3424
the middle country, of 28 measured · 48 members
Canada11.7240 Honduras6.1338
Highest and lowest reading in Americas.
- Asia
8.2778
the middle country, of 46 measured · 52 members
Singapore12.8133 Iraq4.0309
Highest and lowest reading in Asia.
- Oceania
7.1402
the middle country, of 13 measured · 21 members
New Zealand11.3902 Solomon Islands4.6751
Highest and lowest reading in Oceania.
- Africa
5.0373
the middle country, of 46 measured · 55 members
Seychelles9.7008Liberia2.2065Highest and lowest reading in Africa.
- Every region
22 sub-regions, highest middle country first
- Eastern Asia
11.6289
the middle country, of 6 measured · 8 members
 Hong Kong11.8868
 Mongolia9.1533
Highest and lowest reading in Eastern Asia.
- Northern Europe
11.3859
the middle country, of 10 measured · 13 members
Finland11.7388 Iceland10.7183
Highest and lowest reading in Northern Europe.
- Western Europe
11.0331
the middle country, of 7 measured · 9 members
 Netherlands11.5390
 Luxembourg9.7956
Highest and lowest reading in Western Europe.
- Southern Europe
10.0786
the middle country, of 12 measured · 17 members
 Slovenia11.3709North Macedonia7.2964
Highest and lowest reading in Southern Europe.
- Eastern Europe
10.0730
the middle country, of 10 measured · 10 members
 Poland11.3742
 Moldova8.2888
Highest and lowest reading in Eastern Europe.
- South America
8.5512
the middle country, of 9 measured · 12 members
 Chile9.4074
 Guyana6.7632
Highest and lowest reading in South America.
- Western Asia
8.2740
the middle country, of 17 measured · 19 members
 Cyprus10.9171Iraq4.0309
Highest and lowest reading in Western Asia.
- Caribbean
8.1412
the middle country, of 10 measured · 24 members
 Trinidad and Tobago9.1158
 Haiti6.1499
Highest and lowest reading in Caribbean.
- South-eastern Asia
7.8278
the middle country, of 11 measured · 11 members
Singapore12.8133 Laos6.2523
Highest and lowest reading in South-eastern Asia.
- Central America
6.7477
the middle country, of 7 measured · 8 members
 Costa Rica8.9933Honduras6.1338
Highest and lowest reading in Central America.
- Southern Asia
6.7145
the middle country, of 8 measured · 9 members
 Sri Lanka8.4622
 Afghanistan5.0528
Highest and lowest reading in Southern Asia.
- Northern Africa
6.4941
the middle country, of 5 measured · 6 members
 Algeria7.0916
 Sudan4.3014
Highest and lowest reading in Northern Africa.
- Southern Africa
5.6034
the middle country, of 5 measured · 5 members
 Lesotho6.3141
 Eswatini4.5254
Highest and lowest reading in Southern Africa.
- Eastern Africa
5.0363
the middle country, of 15 measured · 19 members
Seychelles9.7008South Sudan2.5113Highest and lowest reading in Eastern Africa.
- Western Africa
4.8250
the middle country, of 14 measured · 16 members
 Togo5.9727Liberia2.2065
Highest and lowest reading in Western Africa.
- Middle Africa
4.5323
the middle country, of 7 measured · 9 members
 Gabon6.0249
 Central African Republic2.6962
Highest and lowest reading in Middle Africa.
- Australia and New Zealand
2 of 2 measured — too few for a middle: Australia, New Zealand.
New Zealand11.3902 Australia11.2225
Highest and lowest reading in Australia and New Zealand.
- Central Asia
4 of 5 measured — too few for a middle: Kazakhstan, Kyrgyzstan, Tajikistan, Uzbekistan.
 Uzbekistan9.1334
 Tajikistan6.7855
Highest and lowest reading in Central Asia.
- Melanesia
4 of 5 measured — too few for a middle: Fiji, Papua New Guinea, Solomon Islands, Vanuatu.
 Fiji6.9511Solomon Islands4.6751
Highest and lowest reading in Melanesia.
- Micronesia
4 of 7 measured — too few for a middle: Kiribati, Marshall Islands, Micronesia, Palau.
 Palau8.6922
 Marshall Islands5.6595
Highest and lowest reading in Micronesia.
- Northern America
2 of 4 measured — too few for a middle: Canada, United States.
Canada11.7240 United States10.5568
Highest and lowest reading in Northern America.
- Polynesia
3 of 7 measured — too few for a middle: Samoa, Tonga, Tuvalu.
 Samoa7.2452
 Tuvalu5.9978
Highest and lowest reading in Polynesia.
03The whole field at once
The spread
172 countries, one dot each, on one scale — further right is a higher value. Half the countries are above 7.9414; a quarter are above 9.7633, and a quarter below 5.9957. The bar in each row marks that continent’s middle country.
04All 172 ever measured
Every country
In order, highest value first. “=” marks a position shared with another country. World Bank Group ranks nobody on this measure; the position is derived here by ordering the published values. It is built from two things — expected years of school and harmonized test scores — so a country can sit low because children leave school early or because they learn little while there. The test-score half is published on its own page; the two are not independent.
Showing 25 of 172 countries
























































































































Values for 2020. The change column compares 2020 with 2018 only; the sparkline covers the recent editions.
052010–2020 · 4 editions
Over time
Four editions only — 2010, 2017, 2018 and 2020 — and the series is closed, so there is no newer reading to come.
- the middle country
- the middle half of countries
- the middle of the 103 countries measured every time
- each continent’s middle country
The same, year by year
| Year | Countries | Middle country | Middle half | Measured every time |
|---|---|---|---|---|
| 2020 | 172 | 7.9414 | 5.9957 – 9.7633 | 8.9933 |
| 2018 | 166 | 8.0383 | 5.8472 – 10.0948 | 9.3359 |
| 2017 | 156 | 7.8950 | 5.7225 – 10.3125 | 9.1100 |
| 2010 | 103 | 8.5039 | 6.9281 – 10.7791 | 8.5039 |
062018 → 2020
Who rose and fell
The biggest changes in value between the two newest editions. Places are shown second, because they also move when other countries do.
Improved most
before → after Micronesia6.2034 → 7.1864 · 116th → 100th+0.9830
- Samoa6.6520 → 7.2452 · 109th → 98th+0.5932
- Marshall Islands5.0962 → 5.6595 · 135th → 134th+0.5633
 Grenada7.7410 → 8.2736 · 89th → 82nd+0.5326
 Kiribati6.8725 → 7.3819 · 100th → 96th+0.5095
Declined most
before → after Kazakhstan11.7975 → 9.1274 · 7th → 55th−2.6700
 Serbia11.2103 → 9.7526 · 26th → 44th−1.4577
 Bulgaria9.8004 → 8.6873 · 45th → 65th−1.1131
 Azerbaijan9.3735 → 8.2815 · 51st → 80th−1.0920
- Tajikistan7.7215 → 6.7855 · 90th → 110th−0.9360
166 countries were measured in both 2018 and 2020. The field changed from 166 to 172 countries, so a place can move for reasons that have nothing to do with the country itself.
07Across every edition
Learning-adjusted years of school in records
The extremes of the statistic. A record reached by more than one country names none of them.
Highest reading on record
12.9379
Learning-adjusted years of school (0–14)
Lowest reading on record
2.2065
Learning-adjusted years of school (0–14)
Biggest improvement between editions
+2.4720
8.9980 → 11.4700
Biggest decline between editions
−2.6700
11.7975 → 9.1274
Most improved since first measured
+2.3978
9.1760 → 11.5738
At the top most often
4 of 4
editions, alone at the first-listed end
08The measure
About learning-adjusted years of school
Learning-adjusted years of school counts how many years of schooling a child can expect by age 18, then discounts them by how much children actually learn. A year in a classroom where pupils learn little counts for less than a year where they learn a lot.
What the number is: Learning-adjusted years of school (0–14).
What it does not measure
It is built from expected years of school and harmonized test scores, so it cannot say which of the two holds a country back. Learning outside school and after age 18 is not counted.
09Where it fits
Connections
Its part in the Country Index, the statistics whose values line up most closely with it across countries, and others on the same subject.
In the Country Index
Context, with no vote
This statistic is published in full under Education & Knowledge, but does not help decide any Country Index standing.
Moves with
Where learning-adjusted years of school is higher, these tend to be higher too.
- Human Capital IndexWorld Bank Group · 172 countries in commonρ 0.99
- Inequality-adjusted Human Development IndexUNDP Human Development Report Office · 157 countries in commonρ 0.93
- Human Development IndexKeyUNDP Human Development Report Office · 171 countries in commonρ 0.91
Moves against
Where learning-adjusted years of school is higher, these tend to be lower.
- Learning PovertyWorld Bank Group and UNESCO Institute for Statistics · 107 countries in commonρ −0.92
- Gender Inequality IndexUNDP Human Development Report Office · 157 countries in commonρ −0.91
- Under-Five Mortality RateKeyUN IGME · 170 countries in commonρ −0.89
Rank correlation (ρ, from −1 to 1) across countries, on each statistic’s newest edition, out of 186 statistics sharing at least 80 countries with this one. Two statistics that move together do not cause each other.
10Keep reading
Explore further
The subject
The data, edition by edition
More from World Bank Group
- Access to Electricity
- Account Ownership at a Financial Institution
- Adjusted Net Savings
- Agriculture, Forestry and Fishing Value Added (% of GDP)
- Average Time to Clear Exports Through Customs
- Business Ready: Operational Efficiency
- Business Ready: Public Services
- Business Ready: Regulatory Framework
- All statistics
11Questions
Learning-adjusted years of school: questions and answers
Which country has the highest learning-adjusted years of school?
Singapore, at 12.8133, among the 172 countries compared in 2020.
Which country has the lowest learning-adjusted years of school?
Liberia, at 2.2065, among the 172 countries compared in 2020.
How many countries does the Learning-Adjusted Years of School cover?
172 in 2020. The number measured varies from 103 to 172 between editions.
What is the world average learning-adjusted years of school?
This site does not calculate a world average, which would depend on how countries are weighted. In the middle country of the 172 compared in 2020, the figure was 7.9414.
Is this World Bank Group’s own ranking?
No. World Bank Group publishes the values but ranks nobody; the position on this page is derived by Nations Inquiry by ordering the published values, and equal values share a position.
How often is the Learning-Adjusted Years of School published?
This site holds 4 editions, describing 2010 to 2020.
Where does the data come from, and can I download it?
From World Bank Group, under CC BY 4.0. The World Bank’s Human Capital Index, through its indicator API (HD.HCI.LAYS), covering 103 to 172 countries across the four editions. Every edition is on this site’s Datasets pages as a full table, and downloads as a CSV file with every value unrounded.
12Method
Sources, method and citation
Source
Learning-Adjusted Years of School — World Bank Group
The World Bank’s Human Capital Index, through its indicator API (HD.HCI.LAYS), covering 103 to 172 countries across the four editions.
Newest edition
Report year 2020Data year 2020
Cite the source as: World Bank. The Human Capital Index. Washington, DC: World Bank Group. Method: Filmer, D., Rogers, H., Angrist, N. and Sabarwal, S. (2018), Learning-Adjusted Years of Schooling (LAYS): Defining a New Macro Measure of Education, Policy Research Working Paper 8591.
Licence: CC BY 4.0, checked 2026-09-26.
How this page reads the numbers
- World Bank Group ranks nobody on this measure. The position is derived by Nations Inquiry by ordering the published values; equal values share a position.
- Which end is better follows the publisher’s own reading of the measure.
- A country is named at an end only when it holds that value alone. Where several share it, the page says how many and names none first.
- Values are stored exactly as published and trimmed only for display. “The middle country” is the median of the countries measured, not a world average.
The file itself, column by column — where it came from, what each column holds, and every edition as a CSV — is on its dataset page.
Photographs
The countries at the top of this statistic, from their profiles: Wikimedia Commons, shown in greyscale, each used under the licence named.
- Singapore — Khairul Nizam ., CC BY 2.0
- Hong Kong — Base64 and Derivative work by Globe-trotter, CC BY-SA 3.0
- Finland — Joonas Lyytinen, CC BY-SA 2.5
Cite this page
Nations Inquiry (2026). Learning-adjusted years of school by country: Learning-Adjusted Years of School, data from World Bank Group. https://nationsinquiry.com/statistics/learning-adjusted-years-of-school