UNCTAD · Terms of Trade Index
Terms of trade by country
How have the prices a country gets for its exports moved against the prices it pays for its imports?
Of the 209 countries compared in 2025, North Korea had the highest reading, 1,448.226, and Niue had the lowest reading, 38.197. In the middle country the figure was 103.227. Among the 205 countries measured in every edition since 2005, the middle one moved from 98.968 to 102.800.
Share
Terms of trade · 2025
Context statistic

Highest of 209North Korea
1,448.226012025 · values only
The highest and the lowest
The three countries with the highest values of 209 compared, the three with the lowest, and the highest on each continent. This statistic has no better end, so no country is shown as leading.
- 1
- 2

- 3

Lowest in 2025
 Niue38.197
 British Virgin Islands42.419
 Saint Vincent and the Grenadines54.275
This statistic has no better end: the two ends describe size, not success.
Highest on each continent
- AfricaMali185.948
- Americas
 Peru172.508
 - AsiaNorth Korea1,448.226
- Europe
 Iceland134.396
 - OceaniaAmerican Samoa217.747
- Every region
02Every measured country
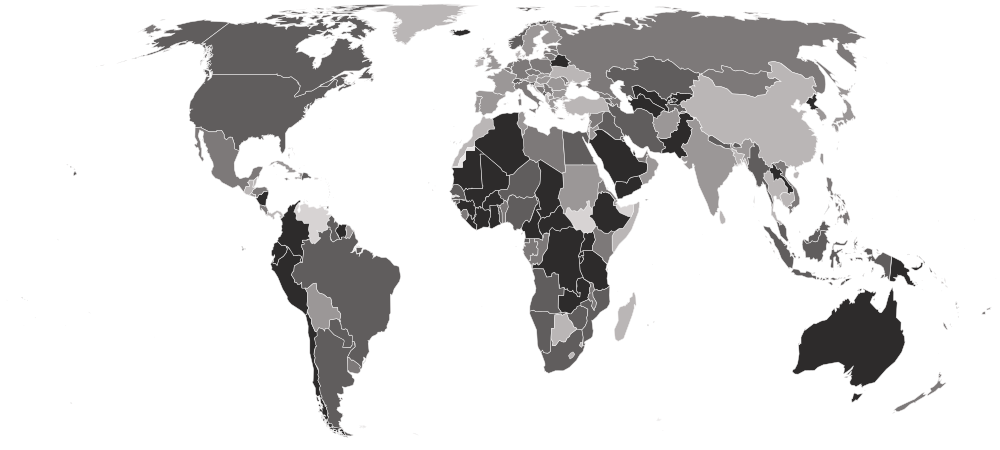
Terms of trade on a map
Each country is shaded by its value, in five groups holding the same number of countries. Hover a country for its value, or select it to open its profile. Below the map, each continent’s middle country.
Darker is a higher value. This statistic has no better end, so the shades describe size, not success.
- 38.197–90.573
- 90.704–98.566
- 98.605–106.956
- 107.021–126.395
- 127.238–1,448.226
- No reading in 2025 (1 measured in an earlier edition)
- Africa
115.410
the middle country, of 53 measured · 55 members
Mali185.948 Botswana73.402
Highest and lowest reading in Africa.
- Asia
106.016
the middle country, of 51 measured · 52 members
North Korea1,448.226 Cyprus78.692
Highest and lowest reading in Asia.
- Oceania
101.680
the middle country, of 20 measured · 21 members
American Samoa217.747Niue38.197Highest and lowest reading in Oceania.
- Americas
99.953
the middle country, of 43 measured · 48 members
Peru172.508British Virgin Islands42.419Highest and lowest reading in Americas.
- Europe
97.618
the middle country, of 42 measured · 49 members
Iceland134.396 Gibraltar67.936
Highest and lowest reading in Europe.
- Every region
22 sub-regions, highest middle country first
- Central Asia
136.973
the middle country, of 5 measured · 5 members
 Kyrgyzstan150.543
 Kazakhstan112.902
Highest and lowest reading in Central Asia.
- Middle Africa
127.238
the middle country, of 9 measured · 9 members
 Chad158.273
 Republic of the Congo103.587
Highest and lowest reading in Middle Africa.
- South America
124.879
the middle country, of 11 measured · 12 members
Peru172.508 Bolivia93.886
Highest and lowest reading in South America.
- Western Africa
121.294
the middle country, of 16 measured · 16 members
Mali185.948 Gambia88.625
Highest and lowest reading in Western Africa.
- South-eastern Asia
110.696
the middle country, of 11 measured · 11 members
 Laos163.475
 Cambodia83.553
Highest and lowest reading in South-eastern Asia.
- Western Asia
104.492
the middle country, of 18 measured · 19 members
 Yemen159.464Cyprus78.692
Highest and lowest reading in Western Asia.
- Eastern Africa
102.800
the middle country, of 17 measured · 19 members
 Burundi159.602
 Comoros74.470
Highest and lowest reading in Eastern Africa.
- Micronesia
102.359
the middle country, of 7 measured · 7 members
 Northern Mariana Islands113.361
 Nauru82.674
Highest and lowest reading in Micronesia.
- Melanesia
101.001
the middle country, of 5 measured · 5 members
 Papua New Guinea158.227
 Solomon Islands88.280
Highest and lowest reading in Melanesia.
- Northern Europe
100.769
the middle country, of 11 measured · 13 members
Iceland134.396 Ireland72.490
Highest and lowest reading in Northern Europe.
- Northern Africa
100.545
the middle country, of 6 measured · 6 members
 Algeria141.502
 Morocco89.050
Highest and lowest reading in Northern Africa.
- Western Europe
98.935
the middle country, of 7 measured · 9 members
 Switzerland110.084
 Luxembourg88.049
Highest and lowest reading in Western Europe.
- Eastern Europe
98.892
the middle country, of 10 measured · 10 members
 Belarus127.531
 Ukraine75.733
Highest and lowest reading in Eastern Europe.
- Central America
96.866
the middle country, of 8 measured · 8 members
 Nicaragua129.049
 Belize86.587
Highest and lowest reading in Central America.
- Southern Asia
96.748
the middle country, of 9 measured · 9 members
 Pakistan152.197
 Bangladesh84.603
Highest and lowest reading in Southern Asia.
- Eastern Asia
95.184
the middle country, of 8 measured · 8 members
North Korea1,448.226 China82.519
Highest and lowest reading in Eastern Asia.
- Southern Europe
94.312
the middle country, of 14 measured · 17 members
 Montenegro112.679Gibraltar67.936
Highest and lowest reading in Southern Europe.
- Caribbean
92.971
the middle country, of 20 measured · 24 members
 Curaçao137.995British Virgin Islands42.419
Highest and lowest reading in Caribbean.
- Polynesia
91.284
the middle country, of 6 measured · 7 members
American Samoa217.747Niue38.197Highest and lowest reading in Polynesia.
- Southern Africa
86.449
the middle country, of 5 measured · 5 members
 South Africa119.948Botswana73.402
Highest and lowest reading in Southern Africa.
- Australia and New Zealand
2 of 2 measured — too few for a middle: Australia, New Zealand.
 Australia153.395
 New Zealand105.433
Highest and lowest reading in Australia and New Zealand.
- Northern America
4 of 4 measured — too few for a middle: Bermuda, Canada, Greenland, United States.
 United States108.139
 Bermuda86.738
Highest and lowest reading in Northern America.
03The whole field at once
The spread
209 countries, one dot each, on one scale — further right is a higher value. Half the countries are above 103.227; a quarter are above 119.933, and a quarter below 93.450. The bar in each row marks that continent’s middle country.
04All 210 ever measured
Every country
In order, highest value first. No rank or position is shown: too many countries share the same value for an order to mean anything. This is not a league table. Every country is measured against its own 2015, so a country at 150 does not have better terms than one at 110 — it has moved further since 2015, often on the price of one export such as oil, copper or gold. A rise helps a country that exports the dearer goods and hurts one that imports them, so neither end is better. The most extreme readings belong to small or closed economies whose prices UNCTAD has to estimate from world prices rather than from figures the country reports.
Showing 25 of 210 countries































































































































































Values for 2025. The change column compares 2025 with 2024 only; the sparkline covers the recent editions.
052005–2025 · 21 reference years
Over time
Each point is one year from 2005, as UNCTAD's current release gives it. Read the line as the country's own story: above 100 its exports have gained buying power against its imports since 2015, below 100 they have lost it — most often because the world price of a commodity it sells or buys has moved.
- the middle country
- the middle half of countries
- the middle of the 205 countries measured every time
- each continent’s middle country
The same, year by year
| Year | Countries | Middle country | Middle half | Measured every time |
|---|---|---|---|---|
| 2025 | 209 | 103.227 | 93.450 – 119.933 | 102.800 |
| 2024 | 209 | 101.966 | 92.566 – 116.232 | 101.641 |
| 2023 | 209 | 100.006 | 91.730 – 111.723 | 99.733 |
| 2022 | 209 | 97.560 | 90.225 – 116.656 | 97.560 |
| 2021 | 209 | 100.619 | 95.019 – 114.590 | 100.416 |
| 2020 | 209 | 100.617 | 94.226 – 106.985 | 100.520 |
| 2019 | 209 | 99.628 | 94.506 – 104.971 | 99.331 |
| 2018 | 210 | 100.278 | 96.268 – 105.408 | 100.218 |
| 2017 | 210 | 100.613 | 97.654 – 103.372 | 100.619 |
| 2016 | 210 | 100.592 | 97.315 – 103.830 | 100.623 |
| 2015 | 210 | 100.000 | 100.000 – 100.000 | 100.000 |
| 2014 | 210 | 99.211 | 94.532 – 106.171 | 99.110 |
| 2013 | 210 | 99.164 | 92.908 – 108.357 | 98.984 |
| 2012 | 210 | 99.774 | 92.924 – 113.952 | 99.638 |
| 2011 | 209 | 102.248 | 93.592 – 118.624 | 101.955 |
| 2010 | 208 | 102.436 | 95.876 – 115.225 | 102.372 |
| 2009 | 208 | 100.770 | 93.758 – 107.269 | 100.565 |
| 2008 | 208 | 98.848 | 88.862 – 113.016 | 98.580 |
| 2007 | 206 | 102.175 | 90.242 – 113.660 | 102.164 |
| 2006 | 206 | 100.971 | 89.365 – 113.608 | 100.933 |
| 2005 | 206 | 99.291 | 87.714 – 111.102 | 98.968 |
062024 → 2025
Who rose and fell
The biggest changes in value between the two newest editions — reference years recalculated in one report, not two separate publications. Places are shown second, because they also move when other countries do.
Rose most
before → after- North Korea797.652 → 1,448.226+650.574
- Mali136.821 → 185.948+49.127
- Yemen111.088 → 159.464+48.376
 Burkina Faso130.890 → 177.447+46.556
- Iceland88.417 → 134.396+45.979
Fell most
before → after- British Virgin Islands60.188 → 42.419−17.769
 Angola128.304 → 110.661−17.643
 Turks and Caicos Islands104.435 → 87.582−16.853
 Libya119.539 → 104.000−15.539
 Iraq122.944 → 108.309−14.635
209 countries were measured in both 2024 and 2025.
07Across every edition
Terms of trade in records
The extremes of the statistic. A record reached by more than one country names none of them.
Highest reading on record
1,448.226
Terms of trade index (2015 = 100)
Lowest reading on record
0.634
Terms of trade index (2015 = 100)
Biggest rise between editions
+650.574
797.652 → 1,448.226
Biggest fall between editions
−679.689
923.353 → 243.664
Biggest change since first measured
+1,334.607
113.618 → 1,448.226
Highest most often
7 of 21
editions, alone at the first-listed end
08The measure
About terms of trade
The terms of trade compare the prices a country gets for its exports with the prices it pays for its imports. UNCTAD's index divides the price index of a country's exports by that of its imports and sets the country's own 2015 at 100, so a reading of 120 means a given quantity of its exports now pays for a fifth more imports than it did in 2015.
What the number is: Terms of trade index (2015 = 100).
09Where it fits
Connections
Its part in the Country Index, the statistics whose values line up most closely with it across countries, and others on the same subject.
In the Country Index
Context, with no vote
This statistic is published in full under Economy & Innovation and Mobility & Trade, but does not help decide any Country Index standing.
Economy & InnovationMobility & TradeWhich statistics vote, and why
Moves with
Where terms of trade is higher, these tend to be higher too.
- Total Natural Resources Rents (% of GDP)World Bank Group · 193 countries in commonρ 0.54
- Commodity Export DependenceUNCTAD · 188 countries in commonρ 0.48
- Historical Index of Ethnic FractionalizationLenka Dražanová, European University Institute (Migration Policy Centre) · 155 countries in commonρ 0.41
Moves against
Where terms of trade is higher, these tend to be lower.
- Foreign Value Added Share of Gross ExportsOECD · 80 countries in commonρ −0.56
- Economic Complexity IndexKeyGrowth Lab at Harvard University · 144 countries in commonρ −0.50
- Services ExportsUNCTAD · 177 countries in commonρ −0.46
Rank correlation (ρ, from −1 to 1) across countries, on each statistic’s newest edition, out of 383 statistics sharing at least 80 countries with this one. Two statistics that move together do not cause each other.
10Keep reading
Explore further
The subject
The countries at either end
11Questions
Terms of trade: questions and answers
Which country has the highest terms of trade?
North Korea, at 1,448.226, among the 209 countries compared in 2025.
Which country has the lowest terms of trade?
Niue, at 38.197, among the 209 countries compared in 2025.
How many countries does the Terms of Trade Index cover?
209 in 2025, and 210 at least once across all editions. The number measured varies from 206 to 210 between editions.
What is the world average terms of trade?
This site does not calculate a world average, which would depend on how countries are weighted. In the middle country of the 209 compared in 2025, the figure was 103.227.
Is this UN Trade and Development (UNCTAD)’s own ranking?
No ranking is shown. UN Trade and Development (UNCTAD) publishes values only, and too many countries share the same value for an ordering to mean anything, so none is derived.
How often is the Terms of Trade Index published?
This site holds 21 reference years, 2005–2025, all recalculated in UN Trade and Development (UNCTAD)’s 2026 report on one method — not 21 separate publications.
Where does the data come from, and can I download it?
From UN Trade and Development (UNCTAD), under CC BY 3.0 IGO. Read from UNCTAD's own US.TermsOfTrade bulk file on UNCTADstat, at the four decimals of the file rather than the one decimal UNCTAD's data viewer displays. The export and import price indices the ratio is built from are stored beside it; UNCTAD's regional and economic groupings, and territories without a country profile, are left out. Every edition is on this site’s Datasets pages as a full table, and downloads as a CSV file with every value unrounded.
12Method
Sources, method and citation
Source
Terms of Trade Index — UN Trade and Development (UNCTAD)
Read from UNCTAD's own US.TermsOfTrade bulk file on UNCTADstat, at the four decimals of the file rather than the one decimal UNCTAD's data viewer displays. The export and import price indices the ratio is built from are stored beside it; UNCTAD's regional and economic groupings, and territories without a country profile, are left out.
Newest edition
Report year 2025Data year 2025
Cite the source as: UN Trade and Development (UNCTAD). Merchandise: Trade - Core indices - Annual (analytical) (US.TermsOfTrade). Geneva: UNCTAD Data Hub.
Licence: CC BY 3.0 IGO, checked 2026-09-30.
How this page reads the numbers
- No rank or position is shown: UN Trade and Development (UNCTAD) publishes values only, and too many countries share the same value for an ordering to mean anything.
- This statistic has no better end, so the page describes higher and lower values and never calls a country a leader.
- A country is named at an end only when it holds that value alone. Where several share it, the page says how many and names none first.
- Values are stored exactly as published and trimmed only for display. “The middle country” is the median of the countries measured, not a world average.
The file itself, column by column — where it came from, what each column holds, and every edition as a CSV — is on its dataset page.
Cite this page
Nations Inquiry (2026). Terms of trade by country: Terms of Trade Index, data from UN Trade and Development (UNCTAD). https://nationsinquiry.com/statistics/terms-of-trade