Loading…
UNCTAD · Container Port Traffic
Container port traffic by country
How many shipping containers pass through a country's ports each year?
Of the 103 countries compared in 2024, China had the highest reading, 299,703,800, and Montenegro had the lowest reading, 17,263. In the middle country the figure was 1,827,788. Among the 92 countries measured in every edition since 2010, the middle one moved from 1,373,522 to 2,230,007.
Container port traffic · 2024
Context statistic

Highest of 103China
299,703,800012024 · position · derived
The highest and the lowest
The three countries with the highest values of 103 compared, the three with the lowest, and the highest on each continent. This statistic has no better end, so no country is shown as leading.
- 1
- 2

- 3

Lowest in 2024
- 103
 Montenegro17,263
 - 102
 Saint Vincent and the Grenadines24,416
 - 101
 Antigua and Barbuda28,000
Positions out of 103. This statistic has no better end: the two ends describe size, not success.
02Every measured country
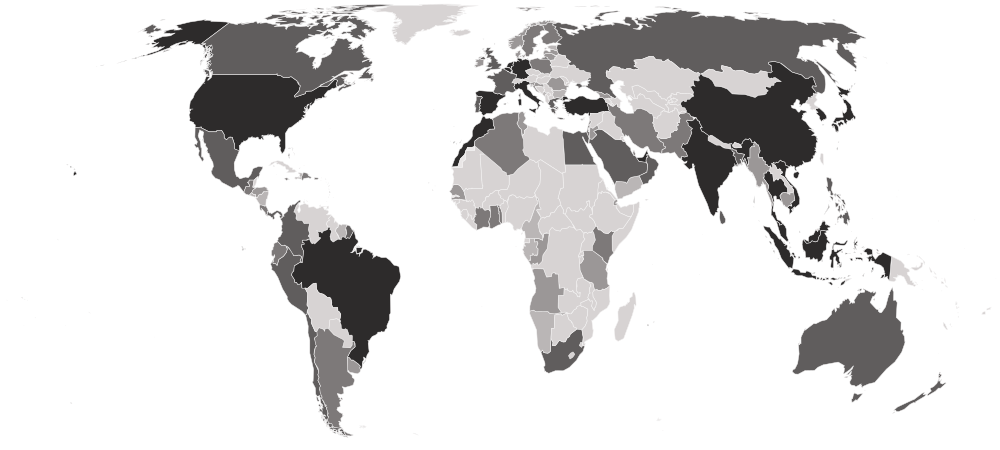
Container port traffic on a map
Each country is shaded by its value, in five groups holding the same number of countries. Hover a country for its value, or select it to open its profile. Below the map, each continent’s middle country.
Darker is a higher value. This statistic has no better end, so the shades describe size, not success.
- 17,263–468,254
- 490,971–1,293,000
- 1,300,000–3,338,000
- 3,353,732–9,621,469
- 11,432,626–299,703,800
- No reading in 2024 (65 measured in an earlier edition)
- Asia
7,782,776
the middle country, of 29 measured · 52 members
China299,703,800 Yemen380,000
Highest and lowest reading in Asia.
- Europe
1,640,487
the middle country, of 25 measured · 49 members
 Spain18,114,517Montenegro17,263
Highest and lowest reading in Europe.
- Americas
1,540,740
the middle country, of 27 measured · 48 members
United States59,707,490Saint Vincent and the Grenadines24,416Highest and lowest reading in Americas.
- Africa
1,046,064
the middle country, of 19 measured · 55 members
 Morocco11,789,130
 Cabo Verde89,382
Highest and lowest reading in Africa.
- Oceania
3 of 21 measured — too few for a middle: Australia, New Zealand, Samoa.
 Australia9,579,396
 Samoa53,017
Highest and lowest reading in Oceania.
- Every region
19 sub-regions, highest middle country first
- South-eastern Asia
13,071,088
the middle country, of 8 measured · 11 members
Singapore41,124,100 Myanmar782,951
Highest and lowest reading in South-eastern Asia.
- Southern Asia
3,353,732
the middle country, of 5 measured · 9 members
 India23,898,000
 Iran2,921,359
Highest and lowest reading in Southern Asia.
- Southern Europe
3,254,851
the middle country, of 8 measured · 17 members
Spain18,114,517Montenegro17,263Highest and lowest reading in Southern Europe.
- South America
3,022,026
the middle country, of 8 measured · 12 members
 Brazil13,893,906
 Suriname105,949
Highest and lowest reading in South America.
- Central America
1,717,439
the middle country, of 7 measured · 8 members
 Panama9,570,767
 Nicaragua167,682
Highest and lowest reading in Central America.
- Western Africa
1,701,246
the middle country, of 5 measured · 16 members
 Togo2,006,435Cabo Verde89,382
Highest and lowest reading in Western Africa.
- Western Asia
1,122,600
the middle country, of 12 measured · 19 members
 United Arab Emirates23,466,906Yemen380,000
Highest and lowest reading in Western Asia.
- Northern Europe
1,068,771
the middle country, of 9 measured · 13 members
 United Kingdom9,621,469
 Estonia261,822
Highest and lowest reading in Northern Europe.
- Caribbean
149,807
the middle country, of 10 measured · 24 members
 Jamaica2,349,405Saint Vincent and the Grenadines24,416
Highest and lowest reading in Caribbean.
- Australia and New Zealand
2 of 2 measured — too few for a middle: Australia, New Zealand.
Australia9,579,396 New Zealand3,371,175
Highest and lowest reading in Australia and New Zealand.
- Eastern Africa
4 of 19 measured — too few for a middle: Djibouti, Kenya, Mauritius, Tanzania.
 Kenya2,005,076
 Mauritius468,254
Highest and lowest reading in Eastern Africa.
- Eastern Asia
4 of 8 measured — too few for a middle: China, Hong Kong, Japan, South Korea.
China299,703,800 Hong Kong13,690,000
Highest and lowest reading in Eastern Asia.
- Eastern Europe
4 of 10 measured — too few for a middle: Bulgaria, Poland, Romania, Russia.
 Russia5,187,096
 Bulgaria296,350
Highest and lowest reading in Eastern Europe.
- Middle Africa
4 of 9 measured — too few for a middle: Angola, Cameroon, Gabon, Republic of the Congo.
 Republic of the Congo1,046,064
 Gabon180,878
Highest and lowest reading in Middle Africa.
- Northern Africa
4 of 6 measured — too few for a middle: Algeria, Egypt, Morocco, Tunisia.
Morocco11,789,130 Tunisia491,955
Highest and lowest reading in Northern Africa.
- Northern America
2 of 4 measured — too few for a middle: Canada, United States.
United States59,707,490 Canada6,394,038
Highest and lowest reading in Northern America.
- Polynesia
1 of 7 measured — too few for a middle: Samoa.
Samoa53,017Highest and lowest reading in Polynesia.
- Southern Africa
2 of 5 measured — too few for a middle: Namibia, South Africa.
 South Africa4,303,682
 Namibia171,151
Highest and lowest reading in Southern Africa.
- Western Europe
4 of 9 measured — too few for a middle: Belgium, France, Germany, Netherlands.
 Netherlands14,517,179
 France5,371,045
Highest and lowest reading in Western Europe.
03The whole field at once
The spread
103 countries, one dot each, on one scale — further right is a higher value. Half the countries are above 1,827,788; a quarter are above 8,305,455, and a quarter below 735,642. The bar in each row marks that continent’s middle country.
Log scale: each gridline is ten times the one before, so countries of very different sizes can be seen on one line.
04All 168 ever measured
Every country
In order, highest value first. “=” marks a position shared with another country. UN Trade and Development (UNCTAD) ranks nobody on this measure; the position is derived here by ordering the published values. Neither end is better. This is an absolute total, so the top of the table is essentially the largest trading economies and the great transhipment hubs, and a landlocked country reads zero for reasons of geography. The Liner Shipping Connectivity Index beside it measures how WELL connected a country is, independently of size — the two belong together.
Showing 25 of 168 countries




























































































































Values for 2024. The change column compares 2024 with 2023 only; the sparkline covers the recent editions.
052010–2024 · 15 reference years
Over time
Each point is one reference year from 2010.
- the middle country
- the middle half of countries
- the middle of the 92 countries measured every time
- each continent’s middle country
The same, year by year
| Year | Countries | Middle country | Middle half | Measured every time |
|---|---|---|---|---|
| 2024 | 103 | 1,827,788 | 735,642 – 8,305,455 | 2,230,007 |
| 2023 | 110 | 1,483,316 | 452,687 – 6,730,662 | 2,048,295 |
| 2022 | 115 | 1,408,804 | 395,630 – 6,283,938 | 2,090,413 |
| 2021 | 118 | 1,276,022 | 365,290 – 5,938,462 | 2,085,443 |
| 2020 | 125 | 1,048,691 | 343,599 – 4,921,319 | 1,753,608 |
| 2019 | 162 | 620,351 | 91,822 – 2,914,501 | 1,864,095 |
| 2018 | 164 | 564,741 | 101,063 – 2,946,239 | 2,045,556 |
| 2017 | 164 | 476,310 | 102,955 – 2,923,767 | 1,789,724 |
| 2016 | 164 | 435,214 | 98,206 – 2,524,271 | 1,640,355 |
| 2015 | 166 | 431,974 | 87,381 – 2,175,147 | 1,693,835 |
| 2014 | 166 | 444,957 | 79,911 – 2,346,746 | 1,688,429 |
| 2013 | 166 | 402,991 | 76,120 – 2,207,856 | 1,613,605 |
| 2012 | 165 | 401,803 | 79,917 – 2,021,881 | 1,624,242 |
| 2011 | 162 | 398,889 | 76,700 – 2,147,378 | 1,489,830 |
| 2010 | 159 | 367,589 | 61,337 – 2,120,694 | 1,373,522 |
062023 → 2024
Who rose and fell
The biggest changes in value between the two newest editions — reference years recalculated in one report, not two separate publications. Places are shown second, because they also move when other countries do.
Rose most
before → after- China278,759,834 → 299,703,800 · 1st → 1st+20,943,966
- United States54,618,858 → 59,707,490 · 2nd → 2nd+5,088,632
 Vietnam21,069,746 → 24,423,183 · 9th → 6th+3,353,437
 Malaysia28,246,849 → 30,659,850 · 5th → 5th+2,413,001
- Brazil11,613,563 → 13,893,906 · 16th → 13th+2,280,343
Fell most
before → after Saudi Arabia11,379,951 → 8,029,571 · 18th → 27th−3,350,380
- Hong Kong14,345,000 → 13,690,000 · 11th → 14th−655,000
 Oman4,608,110 → 4,246,786 · 32nd → 36th−361,324
 Greece5,926,627 → 5,691,448 · 30th → 30th−235,179
 Jordan898,736 → 824,199 · 69th → 75th−74,537
98 countries were measured in both 2023 and 2024. The field changed from 110 to 103 countries, so a place can move for reasons that have nothing to do with the country itself.
07Across every edition
Container port traffic in records
The extremes of the statistic. A record reached by more than one country names none of them.
Highest reading on record
299,703,800
Container port traffic (TEU, twenty-foot equivalent units)
Lowest reading on record
473
Container port traffic (TEU, twenty-foot equivalent units)
Biggest rise between editions
+20,943,966
278,759,834 → 299,703,800
Biggest fall between editions
−6,572,600
61,191,458 → 54,618,858
Biggest change since first measured
+163,659,617
136,044,183 → 299,703,800
Highest most often
15 of 15
editions, alone at the first-listed end
08The measure
About container port traffic
Container port traffic counts the containers moving through a country’s ports in a year, in twenty-foot equivalent units. It is the raw volume of world trade, port by port — the physical reality behind every trade statistic on this site.
What the number is: Container port traffic (TEU, twenty-foot equivalent units).
09Where it fits
Connections
Its part in the Country Index, the statistics whose values line up most closely with it across countries, and others on the same subject.
In the Country Index
Context, with no vote
This statistic is published in full under Economy & Innovation and Mobility & Connectivity, but does not help decide any Country Index standing.
Economy & InnovationMobility & ConnectivityWhich statistics vote, and why
Moves with
Where container port traffic is higher, these tend to be higher too.
- Liner Shipping Connectivity IndexKeyUNCTAD · 103 countries in commonρ 0.94
- Total PopulationUN DESA Population Division · 103 countries in commonρ 0.68
- Government AI Readiness IndexKeyOxford Insights · 98 countries in commonρ 0.64
Moves against
Where container port traffic is higher, these tend to be lower.
No statistic lines up this closely.
Rank correlation (ρ, from −1 to 1) across countries, on each statistic’s newest edition, out of 90 statistics sharing at least 80 countries with this one. Two statistics that move together do not cause each other.
10Keep reading
Explore further
The subject
The countries at either end
More from UNCTAD
11Questions
Container port traffic: questions and answers
Which country has the highest container port traffic?
China, at 299,703,800, among the 103 countries compared in 2024.
Which country has the lowest container port traffic?
Montenegro, at 17,263, among the 103 countries compared in 2024.
How many countries does the Container Port Traffic cover?
103 in 2024, and 168 at least once across all editions. The number measured varies from 103 to 166 between editions.
What is the world average container port traffic?
This site does not calculate a world average, which would depend on how countries are weighted. In the middle country of the 103 compared in 2024, the figure was 1,827,788.
Is this UN Trade and Development (UNCTAD)’s own ranking?
No. UN Trade and Development (UNCTAD) publishes the values but ranks nobody; the position on this page is derived by Nations Inquiry by ordering the published values, and equal values share a position.
How often is the Container Port Traffic published?
This site holds 15 reference years, 2010–2024, all recalculated in UN Trade and Development (UNCTAD)’s 2026 report on one method — not 15 separate publications.
Where does the data come from, and can I download it?
From UN Trade and Development (UNCTAD), under CC BY 3.0 IGO. From UNCTAD via the World Bank’s indicator API (IS.SHP.GOOD.TU). Every edition is available on this site’s Datasets pages as a full table, unrounded.
12Method
Sources, method and citation
Source
Container Port Traffic — UN Trade and Development (UNCTAD)
From UNCTAD via the World Bank’s indicator API (IS.SHP.GOOD.TU).
Newest edition
Report year 2024Data year 2024
Cite the source as: UN Trade and Development. UNCTADstat. Geneva: UNCTAD.
Licence: CC BY 3.0 IGO, checked 2026-09-07.
How this page reads the numbers
- UN Trade and Development (UNCTAD) ranks nobody on this measure. The position is derived by Nations Inquiry by ordering the published values; equal values share a position.
- This statistic has no better end, so the page describes higher and lower values and never calls a country a leader.
- A country is named at an end only when it holds that value alone. Where several share it, the page says how many and names none first.
- Values are stored exactly as published and trimmed only for display. “The middle country” is the median of the countries measured, not a world average.
The full note on this data
15 reference years (2010–2024), covering 103 to 166 countries, from UNCTAD via the World Bank’s indicator API (IS.SHP.GOOD.TU). Containers moving through a country’s ports in a year, in twenty-foot equivalent units. ⚠ NEITHER END IS BETTER, so this indicator carries no good/bad colouring and does not feed its topics’ rankings — it is charted on them, not scored by them. The figure is an absolute total, so the top of the table is essentially the largest trading economies and the great transhipment hubs, and a landlocked country reads zero for reasons of geography. The Liner Shipping Connectivity Index beside it is the one that measures how WELL connected a country is, independently of its size — the two belong together. ⚠ These are not 15 published reports — see `restatedByReport`. ⚠ No rank is published. A POSITION is derived here (2026-09-10) by ordering the score LARGEST FIRST, and it is a SIZE ORDER rather than a league table: this measure has no better end, so position 1 names the country with the biggest figure and says nothing about how that country is doing. The change arrows stay grey for the same reason, and the indicator is still left out of the Country Index.
Cite this page
Nations Inquiry (2026). Container port traffic by country: Container Port Traffic, data from UN Trade and Development (UNCTAD). https://nationsinquiry.com/statistics/container-port-traffic