Global Carbon Project · Consumption-Based CO₂ Emissions
Consumption-based CO₂ emissions by country
How much carbon dioxide goes into everything a country consumes, including its imports?
Of the 120 countries compared in 2023, China had the highest reading, 2,963.162, and Malawi had the lowest reading, 0.882. In the middle country the figure was 12.789. Among the 119 countries measured in every edition since 1990, the middle one moved from 7.413 to 12.904.
Part ofEnvironment & Sustainability
Consumption-based CO₂ emissions · 2023
Context statistic

Highest of 120China
2,963.162012023 · values only
The highest and the lowest
The three countries with the highest values of 120 compared, the three with the lowest, and the highest on each continent. This statistic has no better end, so no country is shown as leading.
- 1
- 2

- 3


Highest on each continent
- Africa
 South Africa88.805
 - AmericasUnited States1,482.440
- AsiaChina2,963.162
- Europe
 Russia383.729
 - Oceania
 Australia101.570
2 of 21 measured
- Every region
02Every measured country
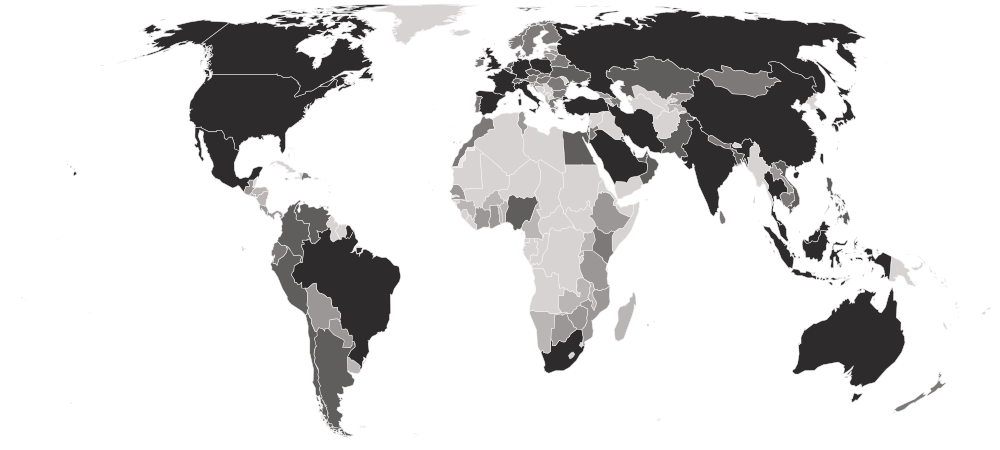
Consumption-based CO₂ emissions on a map
Each country is shaded by its value, in five groups holding the same number of countries. Hover a country for its value, or select it to open its profile. Below the map, each continent’s middle country.
Darker is a higher value. This statistic has no better end, so the shades describe size, not success.
- 0.882–3.554
- 3.582–8.237
- 8.684–21.357
- 21.530–69.167
- 71.129–2,963.162
- No reading in 2023
- Asia
39.346
the middle country, of 37 measured · 52 members
China2,963.162 Armenia2.094
Highest and lowest reading in Asia.
- Europe
16.845
the middle country, of 33 measured · 49 members
Russia383.729 Albania1.469
Highest and lowest reading in Europe.
- Americas
9.016
the middle country, of 22 measured · 48 members
United States1,482.440 Nicaragua1.958
Highest and lowest reading in Americas.
- Africa
3.949
the middle country, of 26 measured · 55 members
South Africa88.805 Malawi0.882
Highest and lowest reading in Africa.
- Oceania
2 of 21 measured — too few for a middle: Australia, New Zealand.
Australia101.570 New Zealand11.298
Highest and lowest reading in Oceania.
- Every region
19 sub-regions, highest middle country first
- Eastern Asia
136.963
the middle country, of 6 measured · 8 members
China2,963.162 Mongolia9.990
Highest and lowest reading in Eastern Asia.
- South-eastern Asia
57.749
the middle country, of 9 measured · 11 members
 Indonesia198.735
 Brunei2.423
Highest and lowest reading in South-eastern Asia.
- Southern Asia
52.943
the middle country, of 6 measured · 9 members
India694.109 Sri Lanka12.674
Highest and lowest reading in Southern Asia.
- Western Europe
40.979
the middle country, of 7 measured · 9 members
 Germany209.738
 Luxembourg2.001
Highest and lowest reading in Western Europe.
- South America
22.795
the middle country, of 10 measured · 12 members
 Brazil128.272
 Uruguay2.943
Highest and lowest reading in South America.
- Western Asia
22.442
the middle country, of 13 measured · 19 members
 Saudi Arabia178.522Armenia2.094
Highest and lowest reading in Western Asia.
- Eastern Europe
21.357
the middle country, of 9 measured · 10 members
Russia383.729 Slovakia9.562
Highest and lowest reading in Eastern Europe.
- Northern Europe
11.145
the middle country, of 9 measured · 13 members
 United Kingdom132.942
 Estonia3.435
Highest and lowest reading in Northern Europe.
- Southern Europe
9.712
the middle country, of 8 measured · 17 members
 Italy117.087Albania1.469
Highest and lowest reading in Southern Europe.
- Central America
4.010
the middle country, of 7 measured · 8 members
 Mexico154.195Nicaragua1.958
Highest and lowest reading in Central America.
- Western Africa
3.618
the middle country, of 8 measured · 16 members
 Nigeria36.377
 Burkina Faso1.583
Highest and lowest reading in Western Africa.
- Eastern Africa
3.468
the middle country, of 11 measured · 19 members
 Kenya9.547Malawi0.882
Highest and lowest reading in Eastern Africa.
- Australia and New Zealand
2 of 2 measured — too few for a middle: Australia, New Zealand.
Australia101.570New Zealand11.298Highest and lowest reading in Australia and New Zealand.
- Caribbean
3 of 24 measured — too few for a middle: Dominican Republic, Jamaica, Trinidad and Tobago.
 Dominican Republic11.037
 Jamaica2.275
Highest and lowest reading in Caribbean.
- Central Asia
3 of 5 measured — too few for a middle: Kazakhstan, Kyrgyzstan, Tajikistan.
 Kazakhstan58.040
 Tajikistan3.554
Highest and lowest reading in Central Asia.
- Middle Africa
1 of 9 measured — too few for a middle: Cameroon.
 Cameroon2.834
Highest and lowest reading in Middle Africa.
- Northern Africa
3 of 6 measured — too few for a middle: Egypt, Morocco, Tunisia.
 Egypt69.167
 Tunisia8.237
Highest and lowest reading in Northern Africa.
- Northern America
2 of 4 measured — too few for a middle: Canada, United States.
United States1,482.440 Canada141.906
Highest and lowest reading in Northern America.
- Southern Africa
3 of 5 measured — too few for a middle: Botswana, Namibia, South Africa.
South Africa88.805 Namibia2.633
Highest and lowest reading in Southern Africa.
03The whole field at once
The spread
120 countries, one dot each, on one scale — further right is a higher value. Half the countries are above 12.789; a quarter are above 54.681, and a quarter below 4.037. The bar in each row marks that continent’s middle country.
Log scale: each gridline is ten times the one before, so countries of very different sizes can be seen on one line.
04All 120 ever measured
Every country
In order, highest value first. No rank or position is shown: too many countries share the same value for an order to mean anything. This is a national total, so the largest economies lead — the table orders countries by size, not by performance. The figures are in million tonnes of carbon, as the Global Carbon Project publishes them; multiply by 3.664 for tonnes of carbon dioxide. Compare consumption with the territorial figure beside it: a country that consumes more than it emits is importing emissions through trade.
Showing 25 of 120 countries
















































































Values for 2023. The change column compares 2023 with 2022 only; the sparkline covers the recent editions.
051990–2023 · 34 reference years
Over time
Each point is one year from 1990, all recalculated in the Global Carbon Budget 2025. The model needs detailed trade tables, which is why the newest year arrives later than for emissions counted at the chimney.
- the middle country
- the middle half of countries
- the middle of the 119 countries measured every time
- each continent’s middle country
The same, year by year
| Year | Countries | Middle country | Middle half | Measured every time |
|---|---|---|---|---|
| 2023 | 120 | 12.789 | 4.037 – 54.681 | 12.904 |
| 2022 | 120 | 12.562 | 4.034 – 54.025 | 12.609 |
| 2021 | 120 | 11.954 | 4.038 – 53.021 | 11.963 |
| 2020 | 120 | 11.349 | 3.690 – 50.595 | 11.274 |
| 2019 | 120 | 12.199 | 3.928 – 56.142 | 11.781 |
| 2018 | 120 | 11.930 | 3.996 – 53.136 | 11.635 |
| 2017 | 120 | 12.203 | 3.806 – 53.182 | 11.945 |
| 2016 | 120 | 12.062 | 3.672 – 52.006 | 11.874 |
| 2015 | 120 | 12.272 | 3.425 – 45.987 | 11.954 |
| 2014 | 120 | 12.583 | 3.284 – 51.864 | 12.205 |
| 2013 | 120 | 12.346 | 3.125 – 54.984 | 12.051 |
| 2012 | 120 | 12.656 | 2.801 – 51.302 | 12.353 |
| 2011 | 120 | 12.945 | 2.760 – 54.277 | 12.749 |
| 2010 | 120 | 13.694 | 2.639 – 45.368 | 13.104 |
| 2009 | 120 | 13.077 | 2.302 – 44.587 | 12.529 |
| 2008 | 120 | 12.495 | 2.686 – 47.901 | 12.224 |
| 2007 | 120 | 11.699 | 2.618 – 44.271 | 11.615 |
| 2006 | 120 | 11.134 | 2.397 – 42.306 | 10.850 |
| 2005 | 120 | 10.270 | 2.160 – 40.099 | 9.716 |
| 2004 | 120 | 10.345 | 1.936 – 36.726 | 10.315 |
| 2003 | 120 | 10.023 | 1.656 – 33.924 | 9.619 |
| 2002 | 119 | 8.273 | 1.797 – 32.633 | 8.273 |
| 2001 | 119 | 8.055 | 1.785 – 32.066 | 8.055 |
| 2000 | 119 | 6.979 | 1.815 – 30.801 | 6.979 |
| 1999 | 119 | 8.445 | 1.619 – 28.039 | 8.445 |
| 1998 | 119 | 8.411 | 1.717 – 31.575 | 8.411 |
| 1997 | 119 | 8.367 | 1.589 – 30.201 | 8.367 |
| 1996 | 119 | 7.901 | 1.636 – 28.128 | 7.901 |
| 1995 | 119 | 7.646 | 1.528 – 29.079 | 7.646 |
| 1994 | 119 | 7.390 | 1.416 – 28.574 | 7.390 |
| 1993 | 119 | 6.984 | 1.367 – 28.836 | 6.984 |
| 1992 | 119 | 6.487 | 1.245 – 28.348 | 6.487 |
| 1991 | 119 | 6.342 | 1.275 – 27.234 | 6.342 |
| 1990 | 119 | 7.413 | 1.273 – 28.244 | 7.413 |
062022 → 2023
Who rose and fell
The biggest changes in value between the two newest editions — reference years recalculated in one report, not two separate publications. Places are shown second, because they also move when other countries do.
Rose most
before → afterFell most
before → after- United States1,519.102 → 1,482.440−36.662
- Germany228.934 → 209.738−19.195
 Japan327.912 → 311.763−16.149
- Italy126.038 → 117.087−8.950
 France119.391 → 111.180−8.211
120 countries were measured in both 2022 and 2023.
07Across every edition
Consumption-based CO₂ emissions in records
The extremes of the statistic. A record reached by more than one country names none of them.
Highest reading on record
2,963.162
Consumption-based fossil CO₂ (million tonnes of carbon)
Lowest reading on record
-0.203
Consumption-based fossil CO₂ (million tonnes of carbon)
Biggest rise between editions
+217.308
1,981.630 → 2,198.939
Biggest fall between editions
−361.726
561.722 → 199.995
Biggest change since first measured
+2,318.847
644.315 → 2,963.162
Highest most often
19 of 34
editions, alone at the first-listed end
08The measure
About Consumption-based CO₂ emissions
This counts the carbon dioxide from fossil fuels and cement that goes into everything a country consumes, wherever in the world it was emitted. The steel, electronics and clothes a country imports carry the emissions of the factories that made them, so this is the fairer reading for a country that buys its manufactured goods abroad.
What the number is: Consumption-based fossil CO₂ (million tonnes of carbon).
09Where it fits
Connections
Its part in the Country Index, the statistics whose values line up most closely with it across countries, and others on the same subject.
In the Country Index
Context, with no vote
This statistic is published in full under Environment & Sustainability, but does not help decide any Country Index standing.
Moves with
Where Consumption-based CO₂ emissions is higher, these tend to be higher too.
- GitHub DevelopersGitHub · 120 countries in commonρ 0.90
- Scholarly ArticlesOurResearch · 120 countries in commonρ 0.89
- GitHub RepositoriesGitHub · 120 countries in commonρ 0.87
Moves against
Where Consumption-based CO₂ emissions is higher, these tend to be lower.
- Outbound Mobility Ratio, TertiaryUIS · 87 countries in commonρ −0.54
- Adolescent Birth Rate (Ages 15–19)UN DESA Population Division · 120 countries in commonρ −0.45
- Average Household SizeUN DESA Population Division · 89 countries in commonρ −0.42
Rank correlation (ρ, from −1 to 1) across countries, on each statistic’s newest edition, out of 274 statistics sharing at least 80 countries with this one. Two statistics that move together do not cause each other.
10Keep reading
Explore further
The subject
More from Global Carbon Project
11Questions
Consumption-based CO₂ emissions: questions and answers
Which country has the highest Consumption-based CO₂ emissions?
China, at 2,963.162, among the 120 countries compared in 2023.
Which country has the lowest Consumption-based CO₂ emissions?
Malawi, at 0.882, among the 120 countries compared in 2023.
How many countries does the Consumption-Based CO₂ Emissions cover?
120 in 2023. The number measured varies from 119 to 120 between editions.
What is the world average Consumption-based CO₂ emissions?
This site does not calculate a world average, which would depend on how countries are weighted. In the middle country of the 120 compared in 2023, the figure was 12.789.
Is this Global Carbon Project’s own ranking?
No ranking is shown. Global Carbon Project publishes values only, and too many countries share the same value for an ordering to mean anything, so none is derived.
How often is the Consumption-Based CO₂ Emissions published?
This site holds 34 reference years, 1990–2023, all recalculated in Global Carbon Project’s 2025 report on one method — not 34 separate publications.
Where does the data come from, and can I download it?
From Global Carbon Project, under CC BY 4.0. From the Global Carbon Project's own national emissions workbook. The consumption figures come from a trade model that covers only the countries in its trade tables, so most small economies are absent. Every edition is on this site’s Datasets pages as a full table, and downloads as a CSV file with every value unrounded.
12Method
Sources, method and citation
Source
Consumption-Based CO₂ Emissions — Global Carbon Project
From the Global Carbon Project's own national emissions workbook. The consumption figures come from a trade model that covers only the countries in its trade tables, so most small economies are absent.
Newest edition
Report year 2023Data year 2023
Cite the source as: Friedlingstein, P., O'Sullivan, M., Jones, M. W., Andrew, R. M., et al. (2025). Global Carbon Budget 2025. Earth System Science Data. Consumption emissions updated from Peters, G. P., Minx, J. C., Weber, C. L., & Edenhofer, O. (2011). Growth in emission transfers via international trade from 1990 to 2008. Proceedings of the National Academy of Sciences 108: 8903–8908.
Licence: CC BY 4.0, checked 2026-09-29.
How this page reads the numbers
- No rank or position is shown: Global Carbon Project publishes values only, and too many countries share the same value for an ordering to mean anything.
- This statistic has no better end, so the page describes higher and lower values and never calls a country a leader.
- A country is named at an end only when it holds that value alone. Where several share it, the page says how many and names none first.
- Values are stored exactly as published and trimmed only for display. “The middle country” is the median of the countries measured, not a world average.
The file itself, column by column — where it came from, what each column holds, and every edition as a CSV — is on its dataset page.
Cite this page
Nations Inquiry (2026). Consumption-based CO₂ emissions by country: Consumption-Based CO₂ Emissions, data from Global Carbon Project. https://nationsinquiry.com/statistics/consumption-co2