Loading…
UN DESA Population Division · Total Dependency Ratio
Dependency ratio by country
How many children and older people are there for every 100 people of working age?
Of the 222 countries compared in 2023, Central African Republic had the highest reading, 105.178, and Qatar had the lowest reading, 20.095. In the middle country the figure was 54.730. Among the 222 countries measured in every edition since 1950, the middle one moved from 77.846 to 54.730.
Part ofPeople & Population
Dependency ratio · 2023
Context statistic

Highest of 222Central African Republic
105.178012023 · values only
The highest and the lowest
The three countries with the highest values of 222 compared, the three with the lowest, and the highest on each continent. This statistic has no better end, so no country is shown as leading.
- 1
- 2

- 3

Lowest in 2023
 Qatar20.095
 United Arab Emirates22.003
 Kuwait27.479
This statistic has no better end: the two ends describe size, not success.
Highest on each continent
- AfricaCentral African Republic105.178
- Americas
- Asia
 Afghanistan83.836
 - EuropeVatican City103.074
- Oceania
 Samoa79.965
 - Every region
02Every measured country
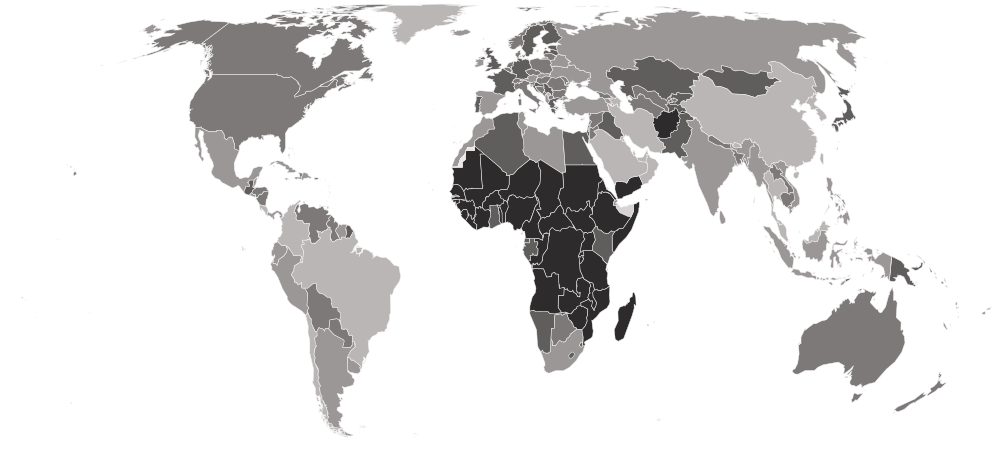
Dependency ratio on a map
Each country is shaded by its value, in five groups holding the same number of countries. Hover a country for its value, or select it to open its profile. Below the map, each continent’s middle country.
Darker is a higher value. This statistic has no better end, so the shades describe size, not success.
- 20.095–45.601
- 46.038–52.809
- 52.834–57.644
- 57.846–70.167
- 71.096–105.178
- No reading in 2023
- Africa
75.033
the middle country, of 54 measured · 55 members
Central African Republic105.178 Mauritius39.016
Highest and lowest reading in Africa.
- Oceania
60.928
the middle country, of 21 measured · 21 members
Samoa79.965 Palau41.627
Highest and lowest reading in Oceania.
- Europe
54.961
the middle country, of 48 measured · 49 members
Vatican City103.074 Andorra38.247
Highest and lowest reading in Europe.
- Americas
49.724
the middle country, of 48 measured · 48 members
 United States Virgin Islands63.299
 British Virgin Islands32.173
Highest and lowest reading in Americas.
- Asia
47.807
the middle country, of 51 measured · 52 members
Afghanistan83.836Qatar20.095Highest and lowest reading in Asia.
- Every region
22 sub-regions, highest middle country first
- Middle Africa
80.295
the middle country, of 9 measured · 9 members
Central African Republic105.178 Gabon68.646
Highest and lowest reading in Middle Africa.
- Western Africa
77.862
the middle country, of 16 measured · 16 members
Niger98.164 Cabo Verde49.143
Highest and lowest reading in Western Africa.
- Eastern Africa
75.033
the middle country, of 18 measured · 19 members
 Somalia97.018Mauritius39.016
Highest and lowest reading in Eastern Africa.
- Polynesia
63.605
the middle country, of 7 measured · 7 members
Samoa79.965 French Polynesia43.800
Highest and lowest reading in Polynesia.
- Micronesia
61.647
the middle country, of 7 measured · 7 members
 Nauru69.087Palau41.627
Highest and lowest reading in Micronesia.
- Central Asia
60.894
the middle country, of 5 measured · 5 members
 Tajikistan67.102
 Turkmenistan56.111
Highest and lowest reading in Central Asia.
- Southern Africa
60.813
the middle country, of 5 measured · 5 members
 Namibia69.100
 South Africa48.368
Highest and lowest reading in Southern Africa.
- Melanesia
59.115
the middle country, of 5 measured · 5 members
 Vanuatu74.922
 New Caledonia48.404
Highest and lowest reading in Melanesia.
- Northern Europe
58.140
the middle country, of 12 measured · 13 members
 Finland62.636
 Iceland50.160
Highest and lowest reading in Northern Europe.
- Northern Africa
54.984
the middle country, of 6 measured · 6 members
 Sudan78.130
 Libya48.897
Highest and lowest reading in Northern Africa.
- Western Europe
54.626
the middle country, of 9 measured · 9 members
 Monaco98.161
 Luxembourg44.773
Highest and lowest reading in Western Europe.
- Southern Europe
54.472
the middle country, of 17 measured · 17 members
Vatican City103.074Andorra38.247Highest and lowest reading in Southern Europe.
- Eastern Europe
53.805
the middle country, of 10 measured · 10 members
 Bulgaria57.160
 Ukraine48.927
Highest and lowest reading in Eastern Europe.
- Southern Asia
51.745
the middle country, of 9 measured · 9 members
Afghanistan83.836 Maldives32.265
Highest and lowest reading in Southern Asia.
- South America
51.477
the middle country, of 12 measured · 12 members
 Guyana55.770
 Colombia42.803
Highest and lowest reading in South America.
- Central America
51.004
the middle country, of 8 measured · 8 members
 Guatemala58.410
 Costa Rica45.032
Highest and lowest reading in Central America.
- Western Asia
47.714
the middle country, of 18 measured · 19 members
 Yemen77.726Qatar20.095
Highest and lowest reading in Western Asia.
- South-eastern Asia
47.022
the middle country, of 11 measured · 11 members
 Timor-Leste65.464
 Singapore33.125
Highest and lowest reading in South-eastern Asia.
- Caribbean
45.329
the middle country, of 24 measured · 24 members
United States Virgin Islands63.299British Virgin Islands32.173Highest and lowest reading in Caribbean.
- Eastern Asia
44.838
the middle country, of 8 measured · 8 members
 Japan70.100
 Macau38.072
Highest and lowest reading in Eastern Asia.
- Australia and New Zealand
2 of 2 measured — too few for a middle: Australia, New Zealand.
 Australia54.833
 New Zealand54.257
Highest and lowest reading in Australia and New Zealand.
- Northern America
4 of 4 measured — too few for a middle: Bermuda, Canada, Greenland, United States.
 United States53.909
 Greenland44.764
Highest and lowest reading in Northern America.
03The whole field at once
The spread
222 countries, one dot each, on one scale — further right is a higher value. Half the countries are above 54.730; a quarter are above 65.973, and a quarter below 48.377. The bar in each row marks that continent’s middle country.
04All 222 ever measured
Every country
In order, highest value first. No rank or position is shown: too many countries share the same value for an order to mean anything. Neither end is better, and the ratio counts ages, not who actually works or who needs support: a 16-year-old at school counts as working-age and a 67-year-old in work counts as dependent. The top of the table mixes the youngest countries with a few of the oldest, and the lowest readings belong mostly to countries whose large migrant workforces are almost all of working age. Read the child and old-age ratios before reading any total as a burden or a bonus.
Showing 25 of 222 countries






































































































































































Values for 2023. The change column compares 2023 with 2022 only; the sparkline covers the recent editions.
051950–2023 · 74 reference years
Over time
Each point is one year's estimate, 1950 to 2023, as restated by the 2024 revision. The ratio often traces a long U: it falls as birth rates fall and a large generation reaches working age, then rises again as that generation reaches 65. A falling line can therefore mean fewer children or, later, fewer workers — the child and old-age ratios say which.
- the middle country
- the middle half of countries
- the middle of the 222 countries measured every time
- each continent’s middle country
The same, year by year
| Year | Countries | Middle country | Middle half | Measured every time |
|---|---|---|---|---|
| 2023 | 222 | 54.730 | 48.377 – 65.973 | 54.730 |
| 2022 | 222 | 54.903 | 48.172 – 66.900 | 54.903 |
| 2021 | 222 | 54.846 | 48.223 – 66.890 | 54.846 |
| 2020 | 222 | 54.981 | 48.061 – 66.645 | 54.981 |
| 2019 | 222 | 54.617 | 47.469 – 66.584 | 54.617 |
| 2018 | 222 | 54.314 | 47.123 – 66.753 | 54.314 |
| 2017 | 222 | 53.627 | 46.772 – 66.952 | 53.627 |
| 2016 | 222 | 53.385 | 46.128 – 66.945 | 53.385 |
| 2015 | 222 | 53.111 | 45.975 – 67.339 | 53.111 |
| 2014 | 222 | 53.155 | 46.270 – 68.152 | 53.155 |
| 2013 | 222 | 53.165 | 46.283 – 68.805 | 53.165 |
| 2012 | 222 | 52.771 | 45.595 – 67.919 | 52.771 |
| 2011 | 222 | 52.254 | 45.614 – 68.402 | 52.254 |
| 2010 | 222 | 52.320 | 46.180 – 68.819 | 52.320 |
| 2009 | 222 | 52.361 | 46.260 – 70.220 | 52.361 |
| 2008 | 222 | 52.971 | 46.603 – 71.036 | 52.971 |
| 2007 | 222 | 53.734 | 47.102 – 72.268 | 53.734 |
| 2006 | 222 | 54.651 | 47.253 – 72.419 | 54.651 |
| 2005 | 222 | 55.216 | 47.794 – 74.088 | 55.216 |
| 2004 | 222 | 56.977 | 48.178 – 75.914 | 56.977 |
| 2003 | 222 | 57.832 | 48.804 – 77.559 | 57.832 |
| 2002 | 222 | 57.852 | 48.775 – 79.434 | 57.852 |
| 2001 | 222 | 58.932 | 48.962 – 80.613 | 58.932 |
| 2000 | 222 | 59.908 | 49.190 – 81.713 | 59.908 |
| 1999 | 222 | 61.129 | 49.491 – 82.445 | 61.129 |
| 1998 | 222 | 62.400 | 49.757 – 85.173 | 62.400 |
| 1997 | 222 | 63.457 | 50.721 – 86.420 | 63.457 |
| 1996 | 222 | 64.327 | 51.421 – 86.461 | 64.327 |
| 1995 | 222 | 65.028 | 51.527 – 87.308 | 65.028 |
| 1994 | 222 | 66.191 | 51.661 – 88.619 | 66.191 |
| 1993 | 222 | 67.208 | 51.941 – 89.667 | 67.208 |
| 1992 | 222 | 67.705 | 51.601 – 89.925 | 67.705 |
| 1991 | 222 | 68.234 | 51.643 – 89.832 | 68.234 |
| 1990 | 222 | 68.728 | 51.500 – 89.796 | 68.728 |
| 1989 | 222 | 69.504 | 51.950 – 89.405 | 69.504 |
| 1988 | 222 | 70.440 | 52.032 – 89.285 | 70.440 |
| 1987 | 222 | 71.618 | 52.441 – 89.802 | 71.618 |
| 1986 | 222 | 71.967 | 53.020 – 90.308 | 71.967 |
| 1985 | 222 | 72.444 | 53.442 – 91.076 | 72.444 |
| 1984 | 222 | 73.141 | 53.869 – 91.344 | 73.141 |
| 1983 | 222 | 74.346 | 54.910 – 91.709 | 74.346 |
| 1982 | 222 | 75.933 | 56.251 – 92.736 | 75.933 |
| 1981 | 222 | 77.807 | 57.165 – 92.900 | 77.807 |
| 1980 | 222 | 78.949 | 57.829 – 93.181 | 78.949 |
| 1979 | 222 | 79.925 | 58.765 – 92.913 | 79.925 |
| 1978 | 222 | 81.913 | 59.546 – 92.764 | 81.913 |
| 1977 | 222 | 83.010 | 59.717 – 92.813 | 83.010 |
| 1976 | 222 | 83.173 | 60.947 – 93.056 | 83.173 |
| 1975 | 222 | 83.452 | 62.477 – 93.969 | 83.452 |
| 1974 | 222 | 83.928 | 64.045 – 94.395 | 83.928 |
| 1973 | 222 | 84.975 | 65.048 – 94.815 | 84.975 |
| 1972 | 222 | 85.361 | 65.878 – 95.589 | 85.361 |
| 1971 | 222 | 85.773 | 67.090 – 95.919 | 85.773 |
| 1970 | 222 | 85.565 | 67.032 – 95.705 | 85.565 |
| 1969 | 222 | 85.494 | 67.635 – 95.976 | 85.494 |
| 1968 | 222 | 86.069 | 69.000 – 96.521 | 86.069 |
| 1967 | 222 | 85.236 | 70.297 – 95.849 | 85.236 |
| 1966 | 222 | 84.975 | 69.400 – 96.325 | 84.975 |
| 1965 | 222 | 84.408 | 69.749 – 96.104 | 84.408 |
| 1964 | 222 | 83.664 | 70.130 – 96.108 | 83.664 |
| 1963 | 222 | 83.433 | 70.623 – 95.846 | 83.433 |
| 1962 | 222 | 83.124 | 70.979 – 95.085 | 83.124 |
| 1961 | 222 | 82.071 | 70.167 – 93.968 | 82.071 |
| 1960 | 222 | 81.753 | 69.328 – 93.026 | 81.753 |
| 1959 | 222 | 80.479 | 69.639 – 92.001 | 80.479 |
| 1958 | 222 | 79.829 | 69.196 – 90.660 | 79.829 |
| 1957 | 222 | 79.620 | 67.532 – 89.813 | 79.620 |
| 1956 | 222 | 79.826 | 66.878 – 89.118 | 79.826 |
| 1955 | 222 | 79.575 | 65.055 – 88.388 | 79.575 |
| 1954 | 222 | 78.999 | 63.866 – 87.439 | 78.999 |
| 1953 | 222 | 78.610 | 63.790 – 87.168 | 78.610 |
| 1952 | 222 | 78.479 | 63.389 – 86.339 | 78.479 |
| 1951 | 222 | 78.023 | 63.049 – 85.908 | 78.023 |
| 1950 | 222 | 77.846 | 61.812 – 85.647 | 77.846 |
062022 → 2023
Who rose and fell
The biggest changes in value between the two newest editions — reference years recalculated in one report, not two separate publications. Places are shown second, because they also move when other countries do.
Rose most
before → after Saint Martin59.514 → 62.165+2.651
 Tuvalu60.954 → 63.605+2.651
 Cook Islands58.847 → 60.510+1.663
 Hong Kong46.189 → 47.807+1.618
 Guam60.329 → 61.647+1.318
Fell most
before → after Syria57.732 → 53.899−3.833
 South Sudan77.588 → 74.715−2.873
 Chad97.860 → 95.358−2.502
 Burundi94.080 → 91.847−2.233
 Malawi80.332 → 78.281−2.051
222 countries were measured in both 2022 and 2023.
07Across every edition
Dependency ratio in records
The extremes of the statistic. A record reached by more than one country names none of them.
Highest reading on record
174.509
People aged 0–14 and 65+ per 100 people aged 15–64
Lowest reading on record
17.303
People aged 0–14 and 65+ per 100 people aged 15–64
Biggest rise between editions
+82.682
91.827 → 174.509
Biggest fall between editions
−35.119
174.509 → 139.390
Biggest change since first measured
+55.103
43.058 → 98.161
Highest most often
3 countries share this record — no holder is named
9 of 74
editions
08The parts of the index
Inside the number
UN DESA Population Division publishes the parts the headline is built from. Each part’s highest and lowest country, and its middle value.
| Part | Highest | Lowest | Middle country |
|---|---|---|---|
| Child dependency ratio (aged 0–14 per 100 aged 15–64)222 countries | Central African Republic100.879 | Vatican City12.295 | 33.878 |
| Old-age dependency ratio (aged 65+ per 100 aged 15–64)222 countries | Vatican City90.779 | Qatar1.888 | 12.038 |
09The measure
About dependency ratio
The total dependency ratio counts the people of an age usually thought of as dependent — under 15, or 65 and over — for every 100 people aged 15 to 64. It is a rough measure of how many children and older people each working-age adult supports, and it is published with its two halves: the child ratio and the old-age ratio.
What the number is: People aged 0–14 and 65+ per 100 people aged 15–64.
What it does not measure
It counts ages, not who works or who needs support: students of working age and older people still in work are both counted on the wrong side of the line.
10Where it fits
Connections
Its part in the Country Index, the statistics whose values line up most closely with it across countries, and others on the same subject.
In the Country Index
Context, with no vote
This statistic is published in full under People & Population, but does not help decide any Country Index standing.
Moves with
Where dependency ratio is higher, these tend to be higher too.
- Global Multidimensional Poverty IndexOPHI · 103 countries in commonρ 0.75
- Working Poverty RateILO · 113 countries in commonρ 0.74
- Total Fertility RateUN DESA Population Division · 222 countries in commonρ 0.70
Moves against
Where dependency ratio is higher, these tend to be lower.
- GNI per Capita (PPP)World Bank Group · 102 countries in commonρ −0.67
- Youth Literacy RateKeyUIS · 132 countries in commonρ −0.65
- CO₂ Emissions per CapitaKeyGlobal Carbon Project · 210 countries in commonρ −0.63
Rank correlation (ρ, from −1 to 1) across countries, on each statistic’s newest edition, out of 190 statistics sharing at least 80 countries with this one. Two statistics that move together do not cause each other.
11Keep reading
Explore further
The subject
The countries at either end
12Questions
Dependency ratio: questions and answers
Which country has the highest dependency ratio?
Central African Republic, at 105.178, among the 222 countries compared in 2023.
Which country has the lowest dependency ratio?
Qatar, at 20.095, among the 222 countries compared in 2023.
How many countries does the Total Dependency Ratio cover?
222 in 2023.
What is the world average dependency ratio?
This site does not calculate a world average, which would depend on how countries are weighted. In the middle country of the 222 compared in 2023, the figure was 54.730.
Is this UN DESA Population Division’s own ranking?
No ranking is shown. UN DESA Population Division publishes values only, and too many countries share the same value for an ordering to mean anything, so none is derived.
How often is the Total Dependency Ratio published?
This site holds 74 reference years, 1950–2023, all recalculated in UN DESA Population Division’s 2024 report on one method — not 74 separate publications.
Where does the data come from, and can I download it?
From UN DESA Population Division, under CC BY 3.0 IGO. From World Population Prospects 2024, read from the Population Division's own dependency-ratio workbook (POP/F07-1), which publishes the total, child and old-age ratios to three decimals. The workbook also gives ratios on other age bands; only the conventional 15–64 base is used here. Projections are excluded. Every edition is on this site’s Datasets pages as a full table, and downloads as a CSV file with every value unrounded.
13Method
Sources, method and citation
Source
Total Dependency Ratio — UN DESA Population Division
From World Population Prospects 2024, read from the Population Division's own dependency-ratio workbook (POP/F07-1), which publishes the total, child and old-age ratios to three decimals. The workbook also gives ratios on other age bands; only the conventional 15–64 base is used here. Projections are excluded.
Newest edition
Report year 2023Data year 2023
Cite the source as: United Nations, Department of Economic and Social Affairs, Population Division (2024). World Population Prospects 2024, Online Edition.
Licence: CC BY 3.0 IGO, checked 2026-09-26.
How this page reads the numbers
- No rank or position is shown: UN DESA Population Division publishes values only, and too many countries share the same value for an ordering to mean anything.
- This statistic has no better end, so the page describes higher and lower values and never calls a country a leader.
- A country is named at an end only when it holds that value alone. Where several share it, the page says how many and names none first.
- Values are stored exactly as published and trimmed only for display. “The middle country” is the median of the countries measured, not a world average.
The file itself, column by column — where it came from, what each column holds, and every edition as a CSV — is on its dataset page.
Cite this page
Nations Inquiry (2026). Dependency ratio by country: Total Dependency Ratio, data from UN DESA Population Division. https://nationsinquiry.com/statistics/dependency-ratio