OECD · FDI Regulatory Restrictiveness Index
FDI restrictiveness by country
How far do a country's laws restrict foreign direct investment?
Of the 104 countries compared in 2024, United Kingdom had the lowest reading, 0.00017, and Libya had the highest reading, 0.56683. In the middle country the figure was 0.07869. Among the 104 countries measured in every edition since 2018, the middle one moved from 0.09168 to 0.07869.
Share
FDI restrictiveness · 2024
Context statistic

Lowest of 104United Kingdom
0.00017012024 · position · derived
Who leads
The three countries at the lowest end of 104 compared, the three at the other end, and the first on each continent.
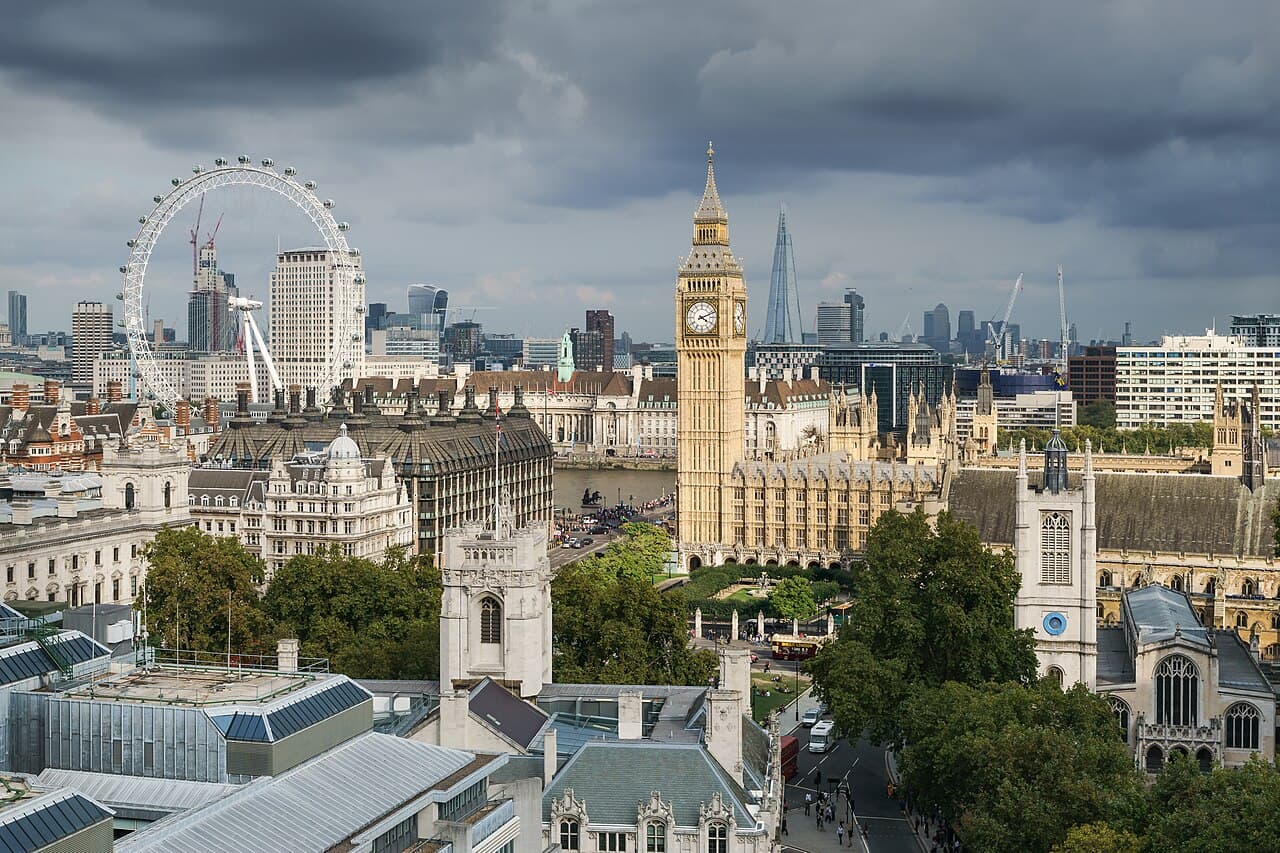 1
1Photo: © User:Colin / Wikimedia Commons · CC BY-SA 4.0, greyscale
 2
2Photo: Joonas Lyytinen · CC BY-SA 2.5, greyscale
 3
3Photo: Michal Osmenda from Brussels, Belgium · CC BY-SA 2.0, greyscale

Lowest on each continent
- Africa
 Rwanda0.02577
 - Americas
 Peru0.01444
 - Asia
 Armenia0.01650
 - EuropeUnited Kingdom0.00017
- Oceania
 New Zealand0.14358
2 of 21 measured
- Every region
02Every measured country
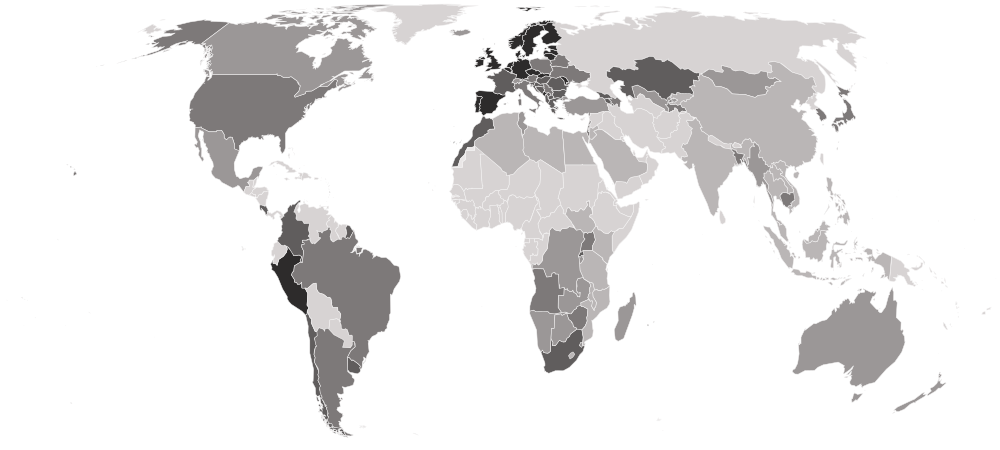
FDI restrictiveness on a map
Each country is shaded by its value, in five groups holding the same number of countries. Hover a country for its value, or select it to open its profile. Below the map, each continent’s middle country.
Darker is a lower value — the better end.
- 0.21531–0.56683
- 0.11179–0.21373
- 0.04836–0.10899
- 0.01650–0.04297
- 0.00017–0.01622
- No reading in 2024
- Europe
0.01800
the middle country, of 38 measured · 49 members
United Kingdom0.00017 Iceland0.15401
Lowest and highest reading in Europe.
- Americas
0.04630
the middle country, of 10 measured · 48 members
Peru0.01444 Canada0.15300
Lowest and highest reading in Americas.
- Asia
0.14306
the middle country, of 29 measured · 52 members
Armenia0.01650 Laos0.40257
Lowest and highest reading in Asia.
- Africa
0.18698
the middle country, of 25 measured · 55 members
Rwanda0.02577 Libya0.56683
Lowest and highest reading in Africa.
- Oceania
2 of 21 measured — too few for a middle: Australia, New Zealand.
New Zealand0.14358 Australia0.19408
Lowest and highest reading in Oceania.
- Every region
17 sub-regions, lowest middle country first
- Western Europe
0.01008
the middle country, of 7 measured · 9 members
 Luxembourg0.00651
 Switzerland0.11179
Lowest and highest reading in Western Europe.
- Northern Europe
0.01093
the middle country, of 10 measured · 13 members
United Kingdom0.00017Iceland0.15401Lowest and highest reading in Northern Europe.
- Eastern Europe
0.02414
the middle country, of 9 measured · 10 members
 Czechia0.01141
 Belarus0.08776
Lowest and highest reading in Eastern Europe.
- South America
0.03202
the middle country, of 6 measured · 12 members
Peru0.01444 Argentina0.09208
Lowest and highest reading in South America.
- Southern Europe
0.03888
the middle country, of 12 measured · 17 members
 Portugal0.00655
 Italy0.07111
Lowest and highest reading in Southern Europe.
- Western Asia
0.11185
the middle country, of 9 measured · 19 members
Armenia0.01650 Saudi Arabia0.33098
Lowest and highest reading in Western Asia.
- Southern Africa
0.15719
the middle country, of 5 measured · 5 members
 South Africa0.03410
 Lesotho0.40581
Lowest and highest reading in Southern Africa.
- Eastern Africa
0.19952
the middle country, of 13 measured · 19 members
Rwanda0.02577 Seychelles0.39722
Lowest and highest reading in Eastern Africa.
- South-eastern Asia
0.22961
the middle country, of 10 measured · 11 members
 Singapore0.06517Laos0.40257
Lowest and highest reading in South-eastern Asia.
- Northern Africa
0.24838
the middle country, of 5 measured · 6 members
 Morocco0.03435Libya0.56683
Lowest and highest reading in Northern Africa.
- Australia and New Zealand
2 of 2 measured — too few for a middle: Australia, New Zealand.
New Zealand0.14358Australia0.19408Lowest and highest reading in Australia and New Zealand.
- Central America
2 of 8 measured — too few for a middle: Costa Rica, Mexico.
 Costa Rica0.04164
 Mexico0.14700
Lowest and highest reading in Central America.
- Central Asia
4 of 5 measured — too few for a middle: Kazakhstan, Kyrgyzstan, Tajikistan, Uzbekistan.
 Kazakhstan0.03881
 Kyrgyzstan0.23013
Lowest and highest reading in Central Asia.
- Eastern Asia
4 of 8 measured — too few for a middle: China, Japan, Mongolia, South Korea.
 Japan0.04836
 China0.22700
Lowest and highest reading in Eastern Asia.
- Middle Africa
2 of 9 measured — too few for a middle: Angola, DR Congo.
 Angola0.07849
 DR Congo0.21373
Lowest and highest reading in Middle Africa.
- Northern America
2 of 4 measured — too few for a middle: Canada, United States.
 United States0.05096Canada0.15300
Lowest and highest reading in Northern America.
- Southern Asia
2 of 9 measured — too few for a middle: Bangladesh, India.
 Bangladesh0.09303
 India0.21531
Lowest and highest reading in Southern Asia.
03The whole field at once
The spread
104 countries, one dot each, on one scale — further right is a higher value. Half the countries are above 0.07869; a quarter are above 0.18875, and a quarter below 0.02536. The bar in each row marks that continent’s middle country.
Log scale: each gridline is ten times the one before, so countries of very different sizes can be seen on one line.
04All 104 ever measured
Every country
In order, highest value first — position 1 is the highest value, the way OECD’s own tables read. “=” marks a position shared with another country. OECD ranks nobody on this measure; the position is derived here by ordering the published values. A higher score is more restrictive, so position 1 is the most closed economy, not the most open. The index leaves out state monopolies, special treatment for investors from treaty partners, and restrictions justified by public order or national security, so a low score does not mean investing is easy — only that the statute book discriminates little against foreigners.
Showing 25 of 104 countries































































Values for 2024. The change column compares 2024 with 2023 only; the sparkline covers the recent editions.
052018–2024 · 5 reference years
Over time
Each point is the law as it stood at the end of a year, from 2018. Because each rule carries a fixed weight, a line moves in steps when a country changes a law and stays flat when it does not.
- the middle country
- the middle half of countries
- the middle of the 104 countries measured every time
- each continent’s middle country
The same, year by year
| Year | Countries | Middle country | Middle half | Measured every time |
|---|---|---|---|---|
| 2024 | 104 | 0.07869 | 0.02536 – 0.18875 | 0.07869 |
| 2023 | 104 | 0.07869 | 0.02577 – 0.18875 | 0.07869 |
| 2022 | 104 | 0.07869 | 0.02577 – 0.18875 | 0.07869 |
| 2021 | 104 | 0.09053 | 0.02394 – 0.18655 | 0.09053 |
| 2018 | 104 | 0.09168 | 0.02403 – 0.18378 | 0.09168 |
062023 → 2024
Who rose and fell
The biggest changes in value between the two newest editions — reference years recalculated in one report, not two separate publications. Places are shown second, because they also move when other countries do.
Improved most
before → after- China0.24280 → 0.22700 · 16th → 18th−0.01580
 Mozambique0.30135 → 0.28935 · 10th → 11th−0.01200
 Indonesia0.29336 → 0.28219 · 11th → 12th−0.01117
- Rwanda0.02877 → 0.02577 · 76th → 78th−0.00300
 Egypt0.24978 → 0.24838 · 15th → 15th−0.00141
Worsened most
before → after Malawi0.25093 → 0.35093 · 14th → 6th+0.10000
 Botswana0.14819 → 0.15719 · 33rd → 31st+0.00900
- Canada0.15008 → 0.15300 · 32nd → 33rd+0.00292
- India0.21480 → 0.21531 · 21st → 21st+0.00052
- United Kingdom0.00010 → 0.00017 · 104th → 104th+0.00007
104 countries were measured in both 2023 and 2024.
07Across every edition
FDI restrictiveness in records
The extremes of the statistic. A record reached by more than one country names none of them.
Highest reading on record
0.75083
FDI Regulatory Restrictiveness Index (0 = open, 1 = closed)
Lowest reading on record
0.00010
FDI Regulatory Restrictiveness Index (0 = open, 1 = closed)
Biggest improvement between editions
−0.46455
0.67259 → 0.20804
Biggest decline between editions
+0.21475
0.19106 → 0.40581
Most improved since first measured
−0.46455
0.67259 → 0.20804
At the top most often
4 of 5
editions, alone at the first-listed end
08The parts of the index
Inside the number
OECD publishes the parts the headline is built from. Each part’s highest and lowest country, and its middle value.
| Part | Highest | Lowest | Middle country |
|---|---|---|---|
| Foreign equity limits (contribution to the index)104 countries | Libya0.42133 | 2 countries share 0.00000 | 0.03623 |
| Screening and approval (contribution to the index)104 countries | 6 countries share 0.10000 | 59 countries share 0.00000 | 0.00000 |
| Restrictions on key foreign personnel (contribution to the index)104 countries | DR Congo0.050000 | 32 countries share 0.000000 | 0.000600 |
| Other restrictions (contribution to the index)104 countries |  Tanzania0.15486 Tanzania0.15486 | 3 countries share 0.00000 | 0.01326 |
09The measure
About FDI restrictiveness
The OECD's FDI Regulatory Restrictiveness Index scores the rules that limit foreign direct investment — caps on foreign ownership, screening and approval requirements, limits on bringing in foreign managers and experts, and other restrictions — across 22 sectors, from 0 (fully open) to 1 (fully closed). It measures the law on the books, not how welcoming a country is in practice.
What the number is: FDI Regulatory Restrictiveness Index (0 = open, 1 = closed).
10Where it fits
Connections
Its part in the Country Index, the statistics whose values line up most closely with it across countries, and others on the same subject.
In the Country Index
Context, with no vote
This statistic is published in full under Mobility & Trade and Money & Public Finance, but does not help decide any Country Index standing.
Mobility & TradeMoney & Public FinanceWhich statistics vote, and why
Moves with
Where FDI restrictiveness is higher, these tend to be higher too.
- Social Institutions and Gender IndexKeyOECD · 94 countries in commonρ 0.72
- Children's Climate Risk IndexUNICEF · 100 countries in commonρ 0.64
- Share of Dietary Energy Supply from Cereals, Roots and TubersFAO · 97 countries in commonρ 0.62
Moves against
Where FDI restrictiveness is higher, these tend to be lower.
- Population Aged 65 and OverUN DESA Population Division · 104 countries in commonρ −0.69
- Women, Business and the LawKeyWorld Bank Group · 104 countries in commonρ −0.68
- Median Age of the PopulationUN DESA Population Division · 104 countries in commonρ −0.64
Rank correlation (ρ, from −1 to 1) across countries, on each statistic’s newest edition, out of 300 statistics sharing at least 80 countries with this one. Two statistics that move together do not cause each other.
11Keep reading
Explore further
The subject
The countries at either end
12Questions
FDI restrictiveness: questions and answers
Which country has the lowest FDI restrictiveness?
United Kingdom, at 0.00017, among the 104 countries compared in 2024.
Which country has the highest FDI restrictiveness?
Libya, at 0.56683, among the 104 countries compared in 2024.
How many countries does the FDI Regulatory Restrictiveness Index cover?
104 in 2024.
What is the world average FDI restrictiveness?
This site does not calculate a world average, which would depend on how countries are weighted. In the middle country of the 104 compared in 2024, the figure was 0.07869.
Is this OECD’s own ranking?
No. OECD publishes the values but ranks nobody; the position on this page is derived by Nations Inquiry by ordering the published values, and equal values share a position.
How often is the FDI Regulatory Restrictiveness Index published?
This site holds 5 reference years, 2018–2024, all recalculated in OECD’s 2025 report on one method — not 5 separate publications.
Where does the data come from, and can I download it?
From OECD, under OECD Terms and Conditions — data clause. Read from the OECD's own SDMX API. The four policy categories are stored beside the headline; because a sector cannot score more than fully closed, they can add up to slightly more than the total. The OECD's older vintages of the index, built on an earlier method, are not mixed in. Every edition is on this site’s Datasets pages as a full table, and downloads as a CSV file with every value unrounded.
13Method
Sources, method and citation
Source
FDI Regulatory Restrictiveness Index — OECD
Read from the OECD's own SDMX API. The four policy categories are stored beside the headline; because a sector cannot score more than fully closed, they can add up to slightly more than the total. The OECD's older vintages of the index, built on an earlier method, are not mixed in.
Newest edition
Report year 2024Data year 2024
Cite the source as: OECD (2025), OECD FDI Regulatory Restrictiveness Index - Scores, OECD Data Explorer, https://data-explorer.oecd.org/ (accessed on 3 October 2026).
Licence: OECD Terms and Conditions — data clause, checked 2026-10-03.
How this page reads the numbers
- OECD ranks nobody on this measure. The position is derived by Nations Inquiry by ordering the published values; equal values share a position.
- Which end is better follows the publisher’s own reading of the measure.
- A country is named at an end only when it holds that value alone. Where several share it, the page says how many and names none first.
- Values are stored exactly as published and trimmed only for display. “The middle country” is the median of the countries measured, not a world average.
The file itself, column by column — where it came from, what each column holds, and every edition as a CSV — is on its dataset page.
Photographs
The countries at the top of this statistic, from their profiles: Wikimedia Commons, shown in greyscale, each used under the licence named.
- United Kingdom — © User:Colin / Wikimedia Commons, CC BY-SA 4.0
- Finland — Joonas Lyytinen, CC BY-SA 2.5
- Luxembourg — Michal Osmenda from Brussels, Belgium, CC BY-SA 2.0
Cite this page
Nations Inquiry (2026). FDI restrictiveness by country: FDI Regulatory Restrictiveness Index, data from OECD. https://nationsinquiry.com/statistics/fdi-restrictiveness