Loading…
OECD · PISA Reading Performance
PISA reading scores by country
How well can 15-year-olds read and understand texts?
Singapore placed first of the 79 countries compared in 2022, at 542.55, and Cambodia last, at 328.84. In the middle country the figure was 440.35. Among the 27 countries measured in every edition since 2000, the middle one moved from 496.87 to 481.60.
Part ofEducation & Knowledge
PISA reading scores · 2022
Context statistic

Highest of 79Singapore
542.55012022 · position · derived
Who leads
The three countries at the highest end of 79 compared, the three at the other end, and the first on each continent.
 1
1Photo: Khairul Nizam . · CC BY 2.0, greyscale
 2
2Photo: derivative work: Jjtkk · CC BY-SA 2.0, greyscale
 3
3Photo: JurriaanH · CC BY-SA 3.0, greyscale
Lowest in 2022
- 79
 Cambodia328.84
 - 78
 Uzbekistan335.50
 - 77
 Morocco339.36
Positions out of 79. Where a country sits says how it compares with the others measured, and nothing about why.
02Every measured country
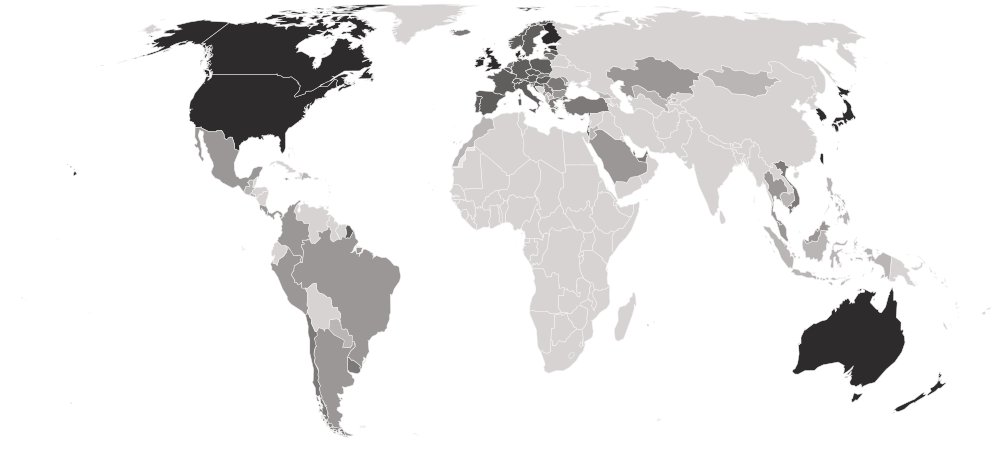
PISA reading scores on a map
Each country is shaded by its value, in five groups holding the same number of countries. Hover a country for its value, or select it to open its profile. Below the map, each continent’s middle country.
Darker is a higher value — the better end.
- 328.84–378.42
- 378.66–415.36
- 417.35–471.83
- 472.97–488.71
- 488.80–542.55
- No reading in 2022
- Europe
474.31
the middle country, of 35 measured · 49 members
 Ireland516.01
 Kosovo342.19
Highest and lowest reading in Europe.
- Americas
409.15
the middle country, of 16 measured · 48 members
 Canada507.13
 Dominican Republic351.31
Highest and lowest reading in Americas.
- Asia
388.09
the middle country, of 25 measured · 52 members
Singapore542.55Cambodia328.84Highest and lowest reading in Asia.
- Africa
1 of 55 measured — too few for a middle: Morocco.
Morocco339.36Highest and lowest reading in Africa.
- Oceania
2 of 21 measured — too few for a middle: Australia, New Zealand.
 New Zealand500.85
 Australia498.05
Highest and lowest reading in Oceania.
- Every region
14 sub-regions, highest middle country first
- Eastern Asia
512.79
the middle country, of 6 measured · 8 members
 Japan515.85
 Mongolia378.42
Highest and lowest reading in Eastern Asia.
- Northern Europe
487.89
the middle country, of 10 measured · 13 members
Ireland516.01 Iceland435.90
Highest and lowest reading in Northern Europe.
- Western Europe
479.32
the middle country, of 6 measured · 9 members
 Switzerland483.33
 Netherlands459.24
Highest and lowest reading in Western Europe.
- Eastern Europe
446.86
the middle country, of 7 measured · 10 members
 Poland488.71
 Bulgaria404.30
Highest and lowest reading in Eastern Europe.
- Southern Europe
442.83
the middle country, of 12 measured · 17 members
 Italy481.60Kosovo342.19
Highest and lowest reading in Southern Europe.
- South America
408.67
the middle country, of 7 measured · 12 members
 Chile447.98
 Paraguay373.16
Highest and lowest reading in South America.
- Central America
391.95
the middle country, of 5 measured · 8 members
 Mexico415.36
 El Salvador364.90
Highest and lowest reading in Central America.
- South-eastern Asia
383.38
the middle country, of 8 measured · 11 members
Singapore542.55Cambodia328.84Highest and lowest reading in South-eastern Asia.
- Western Asia
382.55
the middle country, of 9 measured · 19 members
 Israel473.83
 Jordan342.17
Highest and lowest reading in Western Asia.
- Australia and New Zealand
2 of 2 measured — too few for a middle: Australia, New Zealand.
New Zealand500.85Australia498.05Highest and lowest reading in Australia and New Zealand.
- Caribbean
2 of 24 measured — too few for a middle: Dominican Republic, Jamaica.
 Jamaica409.63Dominican Republic351.31
Highest and lowest reading in Caribbean.
- Central Asia
2 of 5 measured — too few for a middle: Kazakhstan, Uzbekistan.
 Kazakhstan386.28Uzbekistan335.50
Highest and lowest reading in Central Asia.
- Northern Africa
1 of 6 measured — too few for a middle: Morocco.
Morocco339.36Highest and lowest reading in Northern Africa.
- Northern America
2 of 4 measured — too few for a middle: Canada, United States.
Canada507.13 United States503.94
Highest and lowest reading in Northern America.
03The whole field at once
The spread
79 countries, one dot each, on one scale — further right is a higher value. Half the countries are above 440.35; a quarter are above 481.00, and a quarter below 387.19. The bar in each row marks that continent’s middle country.
04All 79 ever measured
Every country
In order, highest value first. “=” marks a position shared with another country. OECD ranks nobody on this measure; the position is derived here by ordering the published values. PISA is an assessment countries opt into, so the 79 economies in 2022 are the ceiling rather than a sample of the world — read this as a comparison among participants, not a world ranking. Some entries are not sovereign states: Hong Kong, Macao, Chinese Taipei, Kosovo and the Palestinian Authority are reported by the OECD and kept here.
Showing 25 of 79 countries
















































Values for 2022. The change column compares 2022 with 2018 only; the sparkline covers the recent editions.
052000–2022 · 8 editions
Over time
Each point is one PISA cycle from 2000, roughly three years apart — the 2021 round slipped to 2022 because of the pandemic. The scale is designed to stay comparable between cycles, so a real gain or loss shows here.
- the middle country
- the middle half of countries
- the middle of the 27 countries measured every time
- each continent’s middle country
The same, year by year
| Year | Countries | Middle country | Middle half | Measured every time |
|---|---|---|---|---|
| 2022 | 79 | 440.35 | 387.19 – 481.00 | 481.60 |
| 2018 | 71 | 457.98 | 407.58 – 498.87 | 492.86 |
| 2015 | 60 | 484.81 | 428.12 – 502.92 | 499.31 |
| 2012 | 58 | 486.78 | 440.72 – 508.87 | 503.94 |
| 2009 | 60 | 481.91 | 425.06 – 499.94 | 497.31 |
| 2006 | 49 | 482.72 | 438.67 – 499.28 | 494.48 |
| 2003 | 35 | 492.32 | 476.62 – 508.26 | 496.19 |
| 2000 | 37 | 491.58 | 430.68 – 507.13 | 496.87 |
062018 → 2022
Who rose and fell
The biggest changes in value between the two newest editions. Places are shown second, because they also move when other countries do.
Improved most
before → afterDeclined most
before → after Albania405.43 → 358.43 · 55th → 71st−46.99
 Cyprus424.36 → 381.08 · 45th → 62nd−43.28
- Iceland473.97 → 435.90 · 33rd → 42nd−38.08
 North Macedonia392.67 → 358.52 · 60th → 70th−34.15
 Finland520.08 → 490.22 · 6th → 14th−29.86
71 countries were measured in both 2018 and 2022. The field changed from 71 to 79 countries, so a place can move for reasons that have nothing to do with the country itself.
07Across every edition
PISA reading scores in records
The extremes of the statistic. A record reached by more than one country names none of them.
Highest reading on record
556.02
Mean reading score
Lowest reading on record
312.21
Mean reading score
Biggest improvement between editions
+59.50
312.21 → 371.72
Biggest decline between editions
−47.16
475.49 → 428.34
Most improved since first measured
+107.09
312.21 → 419.30
At the top most often
3 of 8
editions, alone at the first-listed end
08The measure
About PISA reading scores
PISA Reading is the mean score 15-year-olds achieve on the OECD’s reading scale, centred near 500 across OECD countries. It is the longest PISA series, starting a cycle before mathematics and two before science.
What the number is: Mean reading score.
09Where it fits
Connections
Its part in the Country Index, the statistics whose values line up most closely with it across countries, and others on the same subject.
In the Country Index
Context, with no vote
This statistic is published in full under Education & Knowledge, but does not help decide any Country Index standing.
Moves with
Where PISA reading scores is higher, these tend to be higher too.
No statistic lines up this closely.
Moves against
Where PISA reading scores is higher, these tend to be lower.
No statistic lines up this closely.
Rank correlation (ρ, from −1 to 1) across countries, on each statistic’s newest edition, out of 0 statistics sharing at least 80 countries with this one. Two statistics that move together do not cause each other.
10Keep reading
Explore further
The subject
11Questions
PISA reading scores: questions and answers
Which country has the highest PISA reading scores?
Singapore, at 542.55, among the 79 countries compared in 2022.
Which country has the lowest PISA reading scores?
Cambodia, at 328.84, among the 79 countries compared in 2022.
How many countries does the PISA Reading Performance cover?
79 in 2022. The number measured varies from 35 to 79 between editions.
What is the world average PISA reading scores?
This site does not calculate a world average, which would depend on how countries are weighted. In the middle country of the 79 compared in 2022, the figure was 440.35.
Is this OECD’s own ranking?
No. OECD publishes the values but ranks nobody; the position on this page is derived by Nations Inquiry by ordering the published values, and equal values share a position.
How often is the PISA Reading Performance published?
This site holds 8 editions, describing 2000 to 2022.
Where does the data come from, and can I download it?
From OECD, under OECD Terms and Conditions — Data clause. From the OECD’s published PISA results tables. The OECD publishes three separate scales and no composite, so reading, mathematics and science are three indicators here rather than one — averaging them would be our invention wearing the OECD’s name. Every edition is available on this site’s Datasets pages as a full table, unrounded.
12Method
Sources, method and citation
Source
PISA Reading Performance — OECD
From the OECD’s published PISA results tables. The OECD publishes three separate scales and no composite, so reading, mathematics and science are three indicators here rather than one — averaging them would be our invention wearing the OECD’s name.
Newest edition
Report year 2022Data year 2022
Cite the source as: OECD. PISA 2022 Results (Volume I): The State of Learning and Equity in Education. Paris: OECD Publishing. This is an adaptation of an original work by the OECD.
Licence: OECD Terms and Conditions — Data clause, checked 2026-09-05.
How this page reads the numbers
- OECD ranks nobody on this measure. The position is derived by Nations Inquiry by ordering the published values; equal values share a position.
- Which end is better follows the publisher’s own reading of the measure.
- A country is named at an end only when it holds that value alone. Where several share it, the page says how many and names none first.
- Values are stored exactly as published and trimmed only for display. “The middle country” is the median of the countries measured, not a world average.
The full note on this data
8 cycles (2000–2022), covering 35 to 79 economies. The mean score 15-year-olds achieve on the PISA reading scale, which is centred near 500 across OECD countries. Reading is the longest PISA series, running a cycle earlier than mathematics and two earlier than science. ⚠ PISA publishes three separate scales and no composite, so mathematics, reading and science are three indicators here rather than one - averaging them would be our invention presented as the OECD’s finding. ⚠ PISA is an assessment that countries opt into, so the 79 economies in the 2022 cycle are the ceiling rather than a sample of the world, and the early cycles are much thinner. These should be read as a comparison among participants, not as a world ranking. ⚠ Some entries are not sovereign states: Hong Kong, Macao, Chinese Taipei, Kosovo and the Palestinian Authority are reported by the OECD and kept here, while the sub-national samples Baku (Azerbaijan) and Ukrainian regions (18 of 27) are excluded because they cannot be keyed to a country. ⚠ The OECD publishes no rank in these tables, so none is stored; the POSITION shown on the statistics page is derived here by ordering the score, and labelled as ours.
Photographs
The countries at the top of this statistic, from their profiles: Wikimedia Commons, shown in greyscale, each used under the licence named.
- Singapore — Khairul Nizam ., CC BY 2.0
- Ireland — derivative work: Jjtkk, CC BY-SA 2.0
- Japan — JurriaanH, CC BY-SA 3.0
Cite this page
Nations Inquiry (2026). PISA reading scores by country: PISA Reading Performance, data from OECD. https://nationsinquiry.com/statistics/pisa-reading