OECD · Environmentally Related Tax Revenue
Environmental tax revenue by country
How much revenue does a country raise from taxes on fuel, vehicles, pollution and natural resources?
Of the 112 countries compared in 2024, Seychelles had the highest reading, 3.34595%, and 6 countries shared the lowest reading, 0.00000%. In the middle country the figure was 1.07530%. Among the 82 countries measured in every edition since 1994, the middle one moved from 0.61715% to 1.03748%.
Share
Environmental tax revenue · 2024
Context statistic

Highest of 112Seychelles
3.34595%012024 · values only
The highest and the lowest
The three countries with the highest values of 112 compared, the three with the lowest, and the highest on each continent. This statistic has no better end, so no country is shown as leading.
- 1
- 2

- 3

Lowest in 2024
 Samoa0.00000%
 Myanmar0.00000%
 North Macedonia0.00000%
This statistic has no better end: the two ends describe size, not success.
Highest on each continent
- AfricaSeychelles3.34595%
- Americas
 Costa Rica1.99399%
 - Asia
 Türkiye2.28089%
 - EuropeSlovenia3.06766%
- Oceania
 Solomon Islands2.05145%
 - Every region
02Every measured country
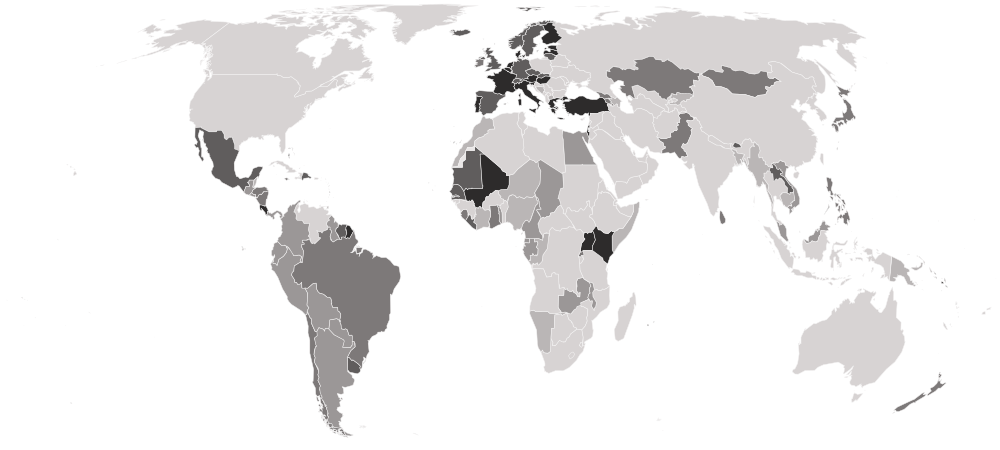
Environmental tax revenue on a map
Each country is shaded by its value, in five groups holding the same number of countries. Hover a country for its value, or select it to open its profile. Below the map, each continent’s middle country.
Darker is a higher value. This statistic has no better end, so the shades describe size, not success.
- 0.00000–0.27889%
- 0.28288–0.85016%
- 0.86546–1.31753%
- 1.32060–1.89970%
- 1.91846–3.34595%
- No reading in 2024 (29 measured in an earlier edition)
- Europe
1.89970%
the middle country, of 27 measured · 49 members
Slovenia3.06766%2 share 0.00000%
Highest and lowest reading in Europe.
- Asia
0.99206%
the middle country, of 23 measured · 52 members
Türkiye2.28089%3 share 0.00000%
Highest and lowest reading in Asia.
- Americas
0.84987%
the middle country, of 27 measured · 48 members
Costa Rica1.99399% Belize0.09650%
Highest and lowest reading in Americas.
- Africa
0.68287%
the middle country, of 28 measured · 55 members
Seychelles3.34595% Somalia0.00001%
Highest and lowest reading in Africa.
- Oceania
0.42210%
the middle country, of 7 measured · 21 members
Solomon Islands2.05145%Samoa0.00000%Highest and lowest reading in Oceania.
- Every region
21 sub-regions, highest middle country first
- Southern Europe
2.27765%
the middle country, of 7 measured · 17 members
Slovenia3.06766%2 share 0.00000%
Highest and lowest reading in Southern Europe.
- Western Europe
1.98639%
the middle country, of 7 measured · 9 members
 Netherlands2.35568%
 Luxembourg1.19446%
Highest and lowest reading in Western Europe.
- Northern Europe
1.88129%
the middle country, of 10 measured · 13 members
 Latvia2.48093%
 Ireland0.94785%
Highest and lowest reading in Northern Europe.
- Eastern Africa
1.43831%
the middle country, of 8 measured · 19 members
Seychelles3.34595%Somalia0.00001%Highest and lowest reading in Eastern Africa.
- Caribbean
1.10953%
the middle country, of 8 measured · 24 members
 Dominican Republic1.66993%
 Trinidad and Tobago0.12428%
Highest and lowest reading in Caribbean.
- Southern Asia
1.07591%
the middle country, of 5 measured · 9 members
 Bhutan1.53290%
 Bangladesh0.04222%
Highest and lowest reading in Southern Asia.
- Western Africa
1.05543%
the middle country, of 12 measured · 16 members
 Gambia2.38657%
 Nigeria0.00738%
Highest and lowest reading in Western Africa.
- Western Asia
1.01997%
the middle country, of 5 measured · 19 members
Türkiye2.28089% Azerbaijan0.10757%
Highest and lowest reading in Western Asia.
- Central America
0.90461%
the middle country, of 8 measured · 8 members
Costa Rica1.99399%Belize0.09650%Highest and lowest reading in Central America.
- South America
0.65186%
the middle country, of 11 measured · 12 members
 Suriname1.64599%
 Ecuador0.28288%
Highest and lowest reading in South America.
- Middle Africa
0.40364%
the middle country, of 5 measured · 9 members
 Gabon0.85016%
 Republic of the Congo0.01696%
Highest and lowest reading in Middle Africa.
- South-eastern Asia
0.28224%
the middle country, of 8 measured · 11 members
 Laos1.80202%
3 share 0.00000%
Highest and lowest reading in South-eastern Asia.
- Australia and New Zealand
1 of 2 measured — too few for a middle: New Zealand.
 New Zealand1.19521%
Highest and lowest reading in Australia and New Zealand.
- Central Asia
2 of 5 measured — too few for a middle: Kazakhstan, Kyrgyzstan.
 Kazakhstan1.14030%
 Kyrgyzstan0.24453%
Highest and lowest reading in Central Asia.
- Eastern Asia
3 of 8 measured — too few for a middle: Hong Kong, Japan, Mongolia.
 Mongolia1.09866%
 Hong Kong0.07178%
Highest and lowest reading in Eastern Asia.
- Eastern Europe
3 of 10 measured — too few for a middle: Czechia, Hungary, Slovakia.
 Hungary1.94081%
 Czechia1.72028%
Highest and lowest reading in Eastern Europe.
- Melanesia
2 of 5 measured — too few for a middle: Papua New Guinea, Solomon Islands.
Solomon Islands2.05145% Papua New Guinea0.00294%
Highest and lowest reading in Melanesia.
- Micronesia
2 of 7 measured — too few for a middle: Marshall Islands, Nauru.
 Nauru0.89008%
 Marshall Islands0.20831%
Highest and lowest reading in Micronesia.
- Northern Africa
2 of 6 measured — too few for a middle: Egypt, Morocco.
 Egypt0.30705%
 Morocco0.27889%
Highest and lowest reading in Northern Africa.
- Polynesia
2 of 7 measured — too few for a middle: Samoa, Tonga.
 Tonga0.42210%Samoa0.00000%
Highest and lowest reading in Polynesia.
- Southern Africa
1 of 5 measured — too few for a middle: Namibia.
 Namibia0.03509%
Highest and lowest reading in Southern Africa.
03The whole field at once
The spread
112 countries, one dot each, on one scale — further right is a higher value. Half the countries are above 1.07530%; a quarter are above 1.74072%, and a quarter below 0.39322%. The bar in each row marks that continent’s middle country.
04All 141 ever measured
Every country
In order, highest value first. No rank or position is shown: too many countries share the same value for an order to mean anything. Neither end is ranked as better. A high share can mean pollution is priced firmly, or simply that fuel is taxed heavily and driven a lot; a low one can mean light taxation or a small tax base. For countries outside the OECD, the OECD calls these lower-end estimates: where revenue statistics are not detailed enough, environmental taxes are hidden inside broader headings, which is why some countries that tax fuel read zero. Readings the OECD marks as estimated or of low reliability carry its flag.
Showing 25 of 141 countries
































































































Values for 2024. The change column compares 2024 with 2023 only; the sparkline covers the recent editions.
051994–2024 · 31 reference years
Over time
Each point is one year from 1994, as the OECD's current database gives it. A falling line is ambiguous: it can mean a lower tax rate, or a shrinking tax base such as less fuel being burned.
- the middle country
- the middle half of countries
- the middle of the 82 countries measured every time
- each continent’s middle country
The same, year by year
| Year | Countries | Middle country | Middle half | Measured every time |
|---|---|---|---|---|
| 2024 | 112 | 1.07530% | 0.39322% – 1.74072% | 1.03748% |
| 2023 | 128 | 1.07875% | 0.44851% – 1.71038% | 0.85950% |
| 2022 | 129 | 1.03431% | 0.43716% – 1.74483% | 0.83680% |
| 2021 | 132 | 1.01585% | 0.40747% – 2.07175% | 0.88300% |
| 2020 | 135 | 1.18014% | 0.50029% – 1.98172% | 0.97931% |
| 2019 | 136 | 1.28474% | 0.59532% – 2.10415% | 1.16475% |
| 2018 | 137 | 1.29464% | 0.60925% – 2.13645% | 1.07143% |
| 2017 | 135 | 1.29042% | 0.43481% – 2.15971% | 1.14177% |
| 2016 | 136 | 1.34918% | 0.50198% – 2.26813% | 1.09787% |
| 2015 | 136 | 1.27733% | 0.49961% – 2.21147% | 1.19935% |
| 2014 | 137 | 1.13635% | 0.42384% – 2.08657% | 0.94315% |
| 2013 | 137 | 1.09405% | 0.43273% – 2.06559% | 0.95259% |
| 2012 | 136 | 1.13771% | 0.40482% – 2.20076% | 1.04094% |
| 2011 | 135 | 1.08760% | 0.32909% – 2.22091% | 1.01941% |
| 2010 | 135 | 1.08782% | 0.38960% – 2.20970% | 0.97918% |
| 2009 | 135 | 1.09447% | 0.42157% – 2.18896% | 0.97993% |
| 2008 | 134 | 1.09534% | 0.31641% – 2.17482% | 0.90753% |
| 2007 | 131 | 1.14269% | 0.39346% – 2.23328% | 1.04356% |
| 2006 | 128 | 1.14648% | 0.36446% – 2.33533% | 0.99460% |
| 2005 | 125 | 1.06628% | 0.32600% – 2.40522% | 0.88808% |
| 2004 | 119 | 1.21638% | 0.25225% – 2.42556% | 0.99749% |
| 2003 | 119 | 1.18910% | 0.28696% – 2.32500% | 1.11221% |
| 2002 | 117 | 1.30974% | 0.25437% – 2.39230% | 0.98668% |
| 2001 | 115 | 1.33776% | 0.24860% – 2.37400% | 1.01771% |
| 2000 | 114 | 1.14458% | 0.17797% – 2.41120% | 1.05537% |
| 1999 | 106 | 1.18126% | 0.03970% – 2.50634% | 0.99598% |
| 1998 | 105 | 1.12464% | 0.01463% – 2.37604% | 1.05773% |
| 1997 | 104 | 1.06589% | 0.01298% – 2.28377% | 1.00039% |
| 1996 | 103 | 1.03614% | 0.00259% – 2.24427% | 0.75749% |
| 1995 | 103 | 0.84742% | 0.00000% – 2.20332% | 0.60180% |
| 1994 | 96 | 0.64545% | 0.00000% – 2.02304% | 0.61715% |
062023 → 2024
Who rose and fell
The biggest changes in value between the two newest editions — reference years recalculated in one report, not two separate publications. Places are shown second, because they also move when other countries do.
Rose most
before → after- Suriname0.79685% → 1.64599%+0.84914
- Gambia1.75723% → 2.38657%+0.62935
 Sierra Leone0.49264% → 1.10135%+0.60871
- Bhutan0.98000% → 1.53290%+0.55290
 Mexico0.83811% → 1.32060%+0.48249
112 countries were measured in both 2023 and 2024. The field changed from 128 to 112 countries, so a place can move for reasons that have nothing to do with the country itself.
07Across every edition
Environmental tax revenue in records
The extremes of the statistic. A record reached by more than one country names none of them.
Highest reading on record
9.89120%
Environmentally related tax revenue (% of GDP)
Lowest reading on record
Reached 426 times by 35 countries — shared, so no holder is named
0.00000%
Environmentally related tax revenue (% of GDP)
Biggest rise between editions
+6.03176
3.85944% → 9.89120%
Biggest fall between editions
−4.90464
7.49148% → 2.58684%
Biggest change since first measured
+2.74030
0.32737% → 3.06766%
Highest most often
6 of 31
editions, alone at the first-listed end
08The parts of the index
Inside the number
OECD publishes the parts the headline is built from. Each part’s highest and lowest country, and its middle value.
| Part | Highest | Lowest | Middle country |
|---|---|---|---|
| Energy tax bases (% of GDP)106 countries | Slovenia2.428783 | 18 countries share 0.000000 | 0.602639 |
| Transport tax bases (% of GDP)105 countries |  Bahamas1.604530 Bahamas1.604530 | 15 countries share 0.000000 | 0.210710 |
| Pollution tax bases (% of GDP)101 countries |  Iceland0.419253 Iceland0.419253 | 53 countries share 0.000000 | 0.000000 |
| Resource tax bases (% of GDP)102 countries | Laos1.80202 | 55 countries share 0.00000 | 0.00000 |
09The measure
About environmental tax revenue
Environmentally related taxes are taxes on things with a proven effect on the environment — fuels and electricity, motor vehicles, pollution and waste, and natural resources. Measured against GDP, this OECD series shows how much revenue a country raises from them; most of it comes from taxes on energy, above all on road fuel.
What the number is: Environmentally related tax revenue (% of GDP).
10Where it fits
Connections
Its part in the Country Index, the statistics whose values line up most closely with it across countries, and others on the same subject.
In the Country Index
Context, with no vote
This statistic is published in full under Environment & Sustainability and Money & Public Finance, but does not help decide any Country Index standing.
Environment & SustainabilityMoney & Public FinanceWhich statistics vote, and why
Moves with
Where environmental tax revenue is higher, these tend to be higher too.
- World Energy Trilemma IndexKeyWorld Energy Council · 82 countries in commonρ 0.61
- Egalitarian Democracy IndexV-Dem Institute, University of Gothenburg · 102 countries in commonρ 0.55
- Participatory Democracy IndexV-Dem Institute, University of Gothenburg · 102 countries in commonρ 0.54
Moves against
Where environmental tax revenue is higher, these tend to be lower.
- Exclusion by Socio-Economic GroupV-Dem Institute, University of Gothenburg · 102 countries in commonρ −0.53
- Neopatrimonial Rule IndexV-Dem Institute, University of Gothenburg · 102 countries in commonρ −0.52
- Political Corruption IndexV-Dem Institute, University of Gothenburg · 102 countries in commonρ −0.48
Rank correlation (ρ, from −1 to 1) across countries, on each statistic’s newest edition, out of 294 statistics sharing at least 80 countries with this one. Two statistics that move together do not cause each other.
11Keep reading
Explore further
The countries at either end
12Questions
Environmental tax revenue: questions and answers
Which country has the highest environmental tax revenue?
Seychelles, at 3.34595%, among the 112 countries compared in 2024.
Which country has the lowest environmental tax revenue?
6 countries share the lowest reading, 0.00000%, among the 112 compared in 2024, so no single country is named.
How many countries does the Environmentally Related Tax Revenue cover?
112 in 2024, and 141 at least once across all editions. The number measured varies from 96 to 137 between editions.
What is the world average environmental tax revenue?
This site does not calculate a world average, which would depend on how countries are weighted. In the middle country of the 112 compared in 2024, the figure was 1.07530%.
Is this OECD’s own ranking?
No ranking is shown. OECD publishes values only, and too many countries share the same value for an ordering to mean anything, so none is derived.
How often is the Environmentally Related Tax Revenue published?
This site holds 31 reference years, 1994–2024, all recalculated in OECD’s 2026 report on one method — not 31 separate publications.
Where does the data come from, and can I download it?
From OECD, under OECD Terms and Conditions — data clause. Read from the OECD's Environmentally Related Tax Revenue database, built on its Policy Instruments for the Environment (PINE) database, through the OECD's SDMX API. The four tax bases — energy, transport, pollution and resources — are stored beside the total, with the OECD's flag on each reading; the OECD's regional totals and averages are left out. Every edition is on this site’s Datasets pages as a full table, and downloads as a CSV file with every value unrounded.
13Method
Sources, method and citation
Source
Environmentally Related Tax Revenue — OECD
Read from the OECD's Environmentally Related Tax Revenue database, built on its Policy Instruments for the Environment (PINE) database, through the OECD's SDMX API. The four tax bases — energy, transport, pollution and resources — are stored beside the total, with the OECD's flag on each reading; the OECD's regional totals and averages are left out.
Newest edition
Report year 2024Data year 2024
Cite the source as: OECD (2026), Environmentally related tax revenue, OECD Data Explorer, https://data-explorer.oecd.org/ (accessed on 3 October 2026).
Licence: OECD Terms and Conditions — data clause, checked 2026-10-03.
How this page reads the numbers
- No rank or position is shown: OECD publishes values only, and too many countries share the same value for an ordering to mean anything.
- This statistic has no better end, so the page describes higher and lower values and never calls a country a leader.
- A country is named at an end only when it holds that value alone. Where several share it, the page says how many and names none first.
- Values are stored exactly as published and trimmed only for display. “The middle country” is the median of the countries measured, not a world average.
The file itself, column by column — where it came from, what each column holds, and every edition as a CSV — is on its dataset page.
Cite this page
Nations Inquiry (2026). Environmental tax revenue by country: Environmentally Related Tax Revenue, data from OECD. https://nationsinquiry.com/statistics/environmental-tax-revenue