FAO · Fish and Seafood Supply per Person
Fish and seafood supply per person by country
How many kilograms of fish and seafood does the food supply hold per person each year?
Of the 174 countries compared in 2023, Iceland had the highest reading, 83.81, and Afghanistan had the lowest reading, 0.38. In the middle country the figure was 16.17. Among the 166 countries measured in every edition since 2010, the middle one moved from 14.22 to 14.63.
Share
Fish and seafood supply per person · 2023
Context statistic

Highest of 174Iceland
83.81012023 · values only
The highest and the lowest
The three countries with the highest values of 174 compared, the three with the lowest, and the highest on each continent. This statistic has no better end, so no country is shown as leading.
- 1
- 2

- 3

Lowest in 2023
 Afghanistan0.38
 Ethiopia0.50
 Syria0.80
This statistic has no better end: the two ends describe size, not success.
Highest on each continent
- Africa
 Seychelles42.91
 - Americas
 Antigua and Barbuda54.52
 - AsiaMaldives79.74
- EuropeIceland83.81
- OceaniaKiribati72.28
- Every region
02Every measured country
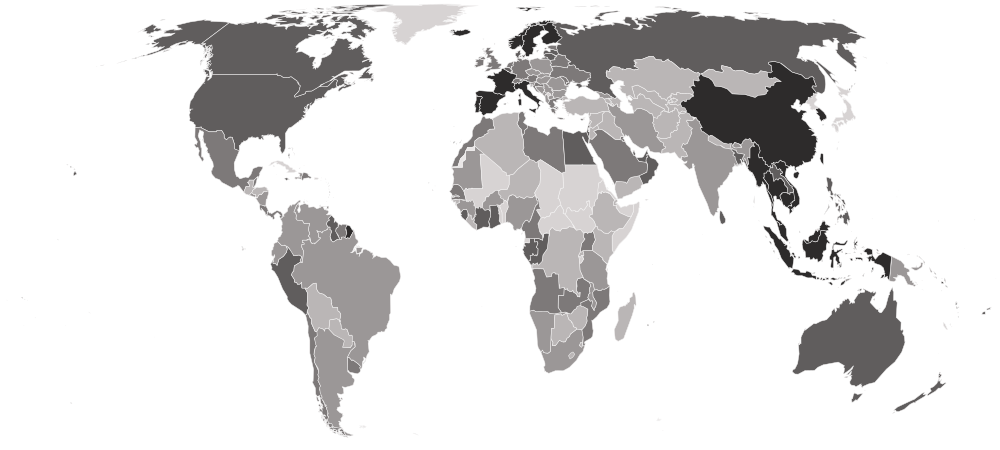
Fish and seafood supply per person on a map
Each country is shaded by its value, in five groups holding the same number of countries. Hover a country for its value, or select it to open its profile. Below the map, each continent’s middle country.
Darker is a higher value. This statistic has no better end, so the shades describe size, not success.
- 0.38–5.33
- 5.42–11.92
- 11.93–19.89
- 20.05–28.58
- 28.62–83.81
- No reading in 2023 (2 measured in an earlier edition)
- Oceania
30.04
the middle country, of 13 measured · 21 members
Kiribati72.28 Papua New Guinea7.10
Highest and lowest reading in Oceania.
- Europe
19.08
the middle country, of 39 measured · 49 members
Iceland83.81 Bosnia and Herzegovina5.86
Highest and lowest reading in Europe.
- Americas
16.67
the middle country, of 33 measured · 48 members
Antigua and Barbuda54.52 Bolivia2.12
Highest and lowest reading in Americas.
- Asia
12.95
the middle country, of 46 measured · 52 members
Maldives79.74Afghanistan0.38Highest and lowest reading in Asia.
- Africa
10.65
the middle country, of 43 measured · 55 members
Seychelles42.91Ethiopia0.50Highest and lowest reading in Africa.
- Every region
22 sub-regions, highest middle country first
- Eastern Asia
47.25
the middle country, of 6 measured · 8 members
 Hong Kong69.11
 Mongolia1.03
Highest and lowest reading in Eastern Asia.
- South-eastern Asia
39.42
the middle country, of 9 measured · 11 members
 Malaysia51.03
 Timor-Leste6.97
Highest and lowest reading in South-eastern Asia.
- Northern Europe
26.50
the middle country, of 10 measured · 13 members
Iceland83.81 Estonia12.70
Highest and lowest reading in Northern Europe.
- Caribbean
24.95
the middle country, of 11 measured · 24 members
Antigua and Barbuda54.52 Haiti5.42
Highest and lowest reading in Caribbean.
- Middle Africa
20.66
the middle country, of 6 measured · 9 members
 Gabon27.03
 DR Congo3.29
Highest and lowest reading in Middle Africa.
- Western Europe
19.08
the middle country, of 7 measured · 9 members
 France32.64
 Germany12.98
Highest and lowest reading in Western Europe.
- Northern Africa
15.88
the middle country, of 5 measured · 6 members
 Egypt20.50
 Algeria2.75
Highest and lowest reading in Northern Africa.
- Southern Europe
15.77
the middle country, of 12 measured · 17 members
 Portugal53.49Bosnia and Herzegovina5.86
Highest and lowest reading in Southern Europe.
- Eastern Europe
10.88
the middle country, of 10 measured · 10 members
 Russia22.80
 Hungary6.46
Highest and lowest reading in Eastern Europe.
- Western Africa
10.65
the middle country, of 13 measured · 16 members
 Sierra Leone24.45
 Niger1.87
Highest and lowest reading in Western Africa.
- Central America
10.45
the middle country, of 8 measured · 8 members
 Costa Rica17.83
 Guatemala3.77
Highest and lowest reading in Central America.
- Western Asia
10.33
the middle country, of 17 measured · 19 members
 Oman28.15Syria0.80
Highest and lowest reading in Western Asia.
- South America
9.53
the middle country, of 12 measured · 12 members
 Peru25.94Bolivia2.12
Highest and lowest reading in South America.
- Southern Asia
8.73
the middle country, of 9 measured · 9 members
Maldives79.74Afghanistan0.38Highest and lowest reading in Southern Asia.
- Eastern Africa
7.59
the middle country, of 14 measured · 19 members
Seychelles42.91Ethiopia0.50Highest and lowest reading in Eastern Africa.
- Southern Africa
3.79
the middle country, of 5 measured · 5 members
 Namibia9.67
 Lesotho1.92
Highest and lowest reading in Southern Africa.
- Central Asia
2.36
the middle country, of 5 measured · 5 members
 Uzbekistan5.21
 Tajikistan0.91
Highest and lowest reading in Central Asia.
- Australia and New Zealand
2 of 2 measured — too few for a middle: Australia, New Zealand.
 New Zealand24.61
 Australia24.24
Highest and lowest reading in Australia and New Zealand.
- Melanesia
4 of 5 measured — too few for a middle: Fiji, Papua New Guinea, Solomon Islands, Vanuatu.
 Solomon Islands30.49Papua New Guinea7.10
Highest and lowest reading in Melanesia.
- Micronesia
4 of 7 measured — too few for a middle: Kiribati, Marshall Islands, Micronesia, Nauru.
Kiribati72.28 Nauru26.06
Highest and lowest reading in Micronesia.
- Northern America
2 of 4 measured — too few for a middle: Canada, United States.
 United States21.94
 Canada20.82
Highest and lowest reading in Northern America.
- Polynesia
3 of 7 measured — too few for a middle: Samoa, Tonga, Tuvalu.
 Tuvalu55.92
 Tonga28.58
Highest and lowest reading in Polynesia.
03The whole field at once
The spread
174 countries, one dot each, on one scale — further right is a higher value. Half the countries are above 16.17; a quarter are above 26.48, and a quarter below 7.00. The bar in each row marks that continent’s middle country.
04All 176 ever measured
Every country
In order, highest value first. No rank or position is shown: too many countries share the same value for an order to mean anything. Neither end of this table is the good end: how much fish a diet holds is a matter of coastline, rivers and custom. Weights are live weight, before shells and bones are removed, and waste is included, so the figures run above what people actually eat.
Showing 25 of 176 countries































































































































Values for 2023. The change column compares 2023 with 2022 only; the sparkline covers the recent editions.
052010–2023 · 14 reference years
Over time
Each point is one year from 2010, when FAO's current food balance method begins.
- the middle country
- the middle half of countries
- the middle of the 166 countries measured every time
- each continent’s middle country
The same, year by year
| Year | Countries | Middle country | Middle half | Measured every time |
|---|---|---|---|---|
| 2023 | 174 | 16.17 | 7.00 – 26.48 | 14.63 |
| 2022 | 174 | 15.92 | 7.07 – 26.94 | 14.94 |
| 2021 | 174 | 16.21 | 7.14 – 27.38 | 14.89 |
| 2020 | 174 | 15.51 | 7.01 – 27.03 | 14.84 |
| 2019 | 175 | 16.18 | 7.22 – 27.51 | 15.43 |
| 2018 | 168 | 15.02 | 6.83 – 27.05 | 15.05 |
| 2017 | 168 | 14.80 | 7.16 – 27.09 | 14.86 |
| 2016 | 168 | 14.27 | 6.62 – 27.16 | 14.66 |
| 2015 | 168 | 14.14 | 6.73 – 25.16 | 14.42 |
| 2014 | 168 | 14.40 | 6.45 – 27.00 | 14.57 |
| 2013 | 168 | 13.94 | 6.23 – 25.88 | 14.10 |
| 2012 | 168 | 14.04 | 6.29 – 26.29 | 14.18 |
| 2011 | 168 | 14.35 | 5.77 – 26.25 | 14.39 |
| 2010 | 168 | 14.18 | 5.74 – 26.94 | 14.22 |
062022 → 2023
Who rose and fell
The biggest changes in value between the two newest editions — reference years recalculated in one report, not two separate publications. Places are shown second, because they also move when other countries do.
Rose most
before → after Marshall Islands43.18 → 44.57+1.39
 Ukraine15.50 → 16.86+1.36
- Tuvalu54.93 → 55.92+0.99
 Greece19.31 → 19.63+0.32
- Hong Kong68.89 → 69.11+0.22
Fell most
before → after- Oman30.05 → 28.15−1.90
- Iceland85.40 → 83.81−1.59
- Kiribati73.42 → 72.28−1.14
 United Arab Emirates24.01 → 23.11−0.90
 Macau61.95 → 61.12−0.83
174 countries were measured in both 2022 and 2023.
07Across every edition
Fish and seafood supply per person in records
The extremes of the statistic. A record reached by more than one country names none of them.
Highest reading on record
173.33
Fish and seafood available as food (kg per person per year, live-weight equivalent)
Lowest reading on record
0.12
Fish and seafood available as food (kg per person per year, live-weight equivalent)
Biggest rise between editions
+9.93
53.33 → 63.26
Biggest fall between editions
−39.29
137.34 → 98.05
Biggest change since first measured
+12.98
27.44 → 40.42
Highest most often
9 of 14
editions, alone at the first-listed end
08The measure
About fish and seafood supply per person
This is how many kilograms of fish and seafood a country's food supply holds per person each year, from FAO's food balance sheets. Where fish production counts what a country catches and farms, this counts what is left for its own people to eat once trade is accounted for.
What the number is: Fish and seafood available as food (kg per person per year, live-weight equivalent).
09Where it fits
Connections
Its part in the Country Index, the statistics whose values line up most closely with it across countries, and others on the same subject.
In the Country Index
Context, with no vote
This statistic is published in full under Health & Wellbeing and Food & Agriculture, but does not help decide any Country Index standing.
Health & WellbeingFood & AgricultureWhich statistics vote, and why
Moves with
Where fish and seafood supply per person is higher, these tend to be higher too.
- Population Living Below 5 m ElevationCenter for International Earth Science Information Network (CIESIN), Columbia University · 173 countries in commonρ 0.59
- Rule of LawKeyWorld Bank Group · 174 countries in commonρ 0.56
- Political Stability and Absence of ViolenceKeyWorld Bank Group · 174 countries in commonρ 0.53
Moves against
Where fish and seafood supply per person is higher, these tend to be lower.
- Refugees by Country of OriginUNHCR, the UN Refugee Agency · 173 countries in commonρ −0.50
- INFORM Risk IndexKeyEuropean Commission Joint Research Centre, with the Inter-Agency Standing Committee · 171 countries in commonρ −0.50
- Political Corruption IndexV-Dem Institute, University of Gothenburg · 159 countries in commonρ −0.48
Rank correlation (ρ, from −1 to 1) across countries, on each statistic’s newest edition, out of 377 statistics sharing at least 80 countries with this one. Two statistics that move together do not cause each other.
10Keep reading
Explore further
The subject
11Questions
Fish and seafood supply per person: questions and answers
Which country has the highest fish and seafood supply per person?
Iceland, at 83.81, among the 174 countries compared in 2023.
Which country has the lowest fish and seafood supply per person?
Afghanistan, at 0.38, among the 174 countries compared in 2023.
How many countries does the Fish and Seafood Supply per Person cover?
174 in 2023, and 176 at least once across all editions. The number measured varies from 168 to 175 between editions.
What is the world average fish and seafood supply per person?
This site does not calculate a world average, which would depend on how countries are weighted. In the middle country of the 174 compared in 2023, the figure was 16.17.
Is this Food and Agriculture Organization of the United Nations (FAO)’s own ranking?
No ranking is shown. Food and Agriculture Organization of the United Nations (FAO) publishes values only, and too many countries share the same value for an ordering to mean anything, so none is derived.
How often is the Fish and Seafood Supply per Person published?
This site holds 14 reference years, 2010–2023, all recalculated in Food and Agriculture Organization of the United Nations (FAO)’s 2025 report on one method — not 14 separate publications.
Where does the data come from, and can I download it?
From Food and Agriculture Organization of the United Nations (FAO), under CC BY 4.0. FAOSTAT's Food Balances domain, read from FAO's own bulk download; its fish rows come from the balances kept by FAO's Fisheries and Aquaculture Division. Every edition is on this site’s Datasets pages as a full table, and downloads as a CSV file with every value unrounded.
12Method
Sources, method and citation
Source
Fish and Seafood Supply per Person — Food and Agriculture Organization of the United Nations (FAO)
FAOSTAT's Food Balances domain, read from FAO's own bulk download; its fish rows come from the balances kept by FAO's Fisheries and Aquaculture Division.
Newest edition
Report year 2023Data year 2023
Cite the source as: FAO. 2025. FAOSTAT: Food Balances (2010-). Accessed on 3 October 2026. https://www.fao.org/faostat/en/#data/FBS Licence: CC-BY-4.0.
Licence: CC BY 4.0, checked 2026-10-03.
How this page reads the numbers
- No rank or position is shown: Food and Agriculture Organization of the United Nations (FAO) publishes values only, and too many countries share the same value for an ordering to mean anything.
- This statistic has no better end, so the page describes higher and lower values and never calls a country a leader.
- A country is named at an end only when it holds that value alone. Where several share it, the page says how many and names none first.
- Values are stored exactly as published and trimmed only for display. “The middle country” is the median of the countries measured, not a world average.
The file itself, column by column — where it came from, what each column holds, and every edition as a CSV — is on its dataset page.
Cite this page
Nations Inquiry (2026). Fish and seafood supply per person by country: Fish and Seafood Supply per Person, data from Food and Agriculture Organization of the United Nations (FAO). https://nationsinquiry.com/statistics/fish-supply