ILO · Child and Family Benefit Coverage
Child benefit coverage by country
What share of children or families receive a child or family benefit?
Of the 190 countries compared in the 2024 edition, 32 countries shared the highest reading, 100.0%, and 9 countries shared the lowest reading, 0.0%. In the middle country the figure was 23.8%.
Share
Child benefit coverage · the 2024 edition
Context statistic
32 countries share the highest value, 100.0% — no single country is named first.
01the 2024 edition · values only
Who leads
The three countries at the highest end of 190 compared, the three at the other end, and the first on each continent.
Highest in the 2024 edition · shared
32 countries share the highest reading, 100.0%
No single country is named first: picking one from a shared value would be a choice the data does not make.





























Lowest in the 2024 edition
 Samoa0.0%
 British Virgin Islands0.0%
 Tuvalu0.0%
Where a country sits says how it compares with the others measured, and nothing about why.
02Every measured country
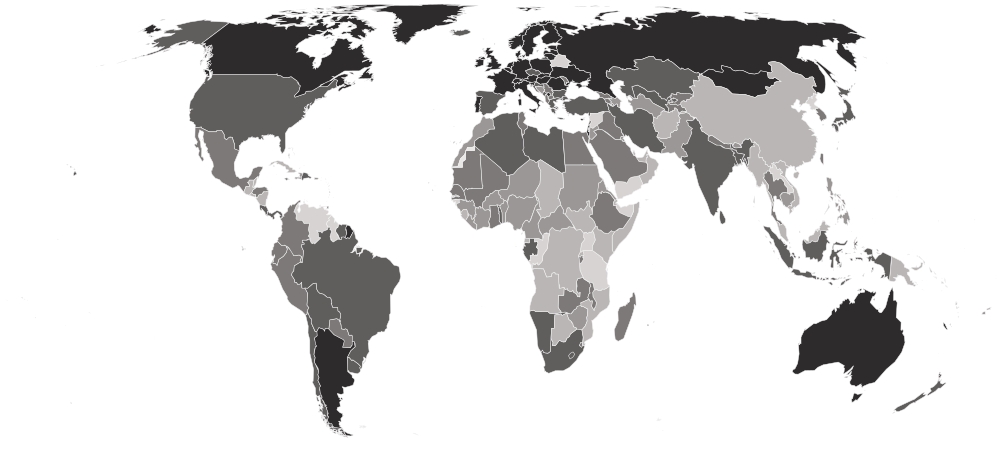
Child benefit coverage on a map
Each country is shaded by its value, in five groups holding the same number of countries. Hover a country for its value, or select it to open its profile. Below the map, each continent’s middle country.
Darker is a higher value — the better end.
- 0.0–3.5%
- 4.0–14.6%
- 14.7–35.8%
- 36.1–86.9%
- 87.8–100.0%
- No reading in the 2024 edition
- Europe
100.0%
the middle country, of 43 measured · 49 members
25 share 100.0%
 Andorra12.2%
Highest and lowest reading in Europe.
- Asia
21.7%
the middle country, of 44 measured · 52 members
3 share 100.0%
 United Arab Emirates0.2%
Highest and lowest reading in Asia.
- Americas
18.3%
the middle country, of 38 measured · 48 members
2 share 100.0%
British Virgin Islands0.0%Highest and lowest reading in Americas.
- Oceania
10.8%
the middle country, of 15 measured · 21 members
2 share 100.0%
5 share 0.0%
Highest and lowest reading in Oceania.
- Africa
10.7%
the middle country, of 50 measured · 55 members
 Togo74.5%
3 share 0.0%
Highest and lowest reading in Africa.
- Every region
22 sub-regions, highest middle country first
- Eastern Europe
100.0%
the middle country, of 9 measured · 10 members
6 share 100.0%
 Moldova22.9%
Highest and lowest reading in Eastern Europe.
- Northern Europe
100.0%
the middle country, of 11 measured · 13 members
9 share 100.0%
 Iceland74.7%
Highest and lowest reading in Northern Europe.
- Western Europe
100.0%
the middle country, of 9 measured · 9 members
8 share 100.0%
 Monaco62.9%
Highest and lowest reading in Western Europe.
- South America
57.0%
the middle country, of 10 measured · 12 members
 Argentina87.8%
 Peru18.4%
Highest and lowest reading in South America.
- Southern Europe
47.3%
the middle country, of 14 measured · 17 members
2 share 100.0%
Andorra12.2%Highest and lowest reading in Southern Europe.
- Southern Africa
38.7%
the middle country, of 5 measured · 5 members
 Lesotho67.2%
 Botswana2.3%
Highest and lowest reading in Southern Africa.
- Eastern Asia
35.3%
the middle country, of 5 measured · 8 members
 Mongolia100.0%
 China2.9%
Highest and lowest reading in Eastern Asia.
- Southern Asia
27.5%
the middle country, of 9 measured · 9 members
 Iran86.9%
 Afghanistan0.4%
Highest and lowest reading in Southern Asia.
- Northern Africa
26.3%
the middle country, of 6 measured · 6 members
 Algeria72.3%
 Sudan8.1%
Highest and lowest reading in Northern Africa.
- Central Asia
18.3%
the middle country, of 5 measured · 5 members
 Kazakhstan54.4%
 Turkmenistan14.5%
Highest and lowest reading in Central Asia.
- Western Asia
17.8%
the middle country, of 16 measured · 19 members
2 share 100.0%
United Arab Emirates0.2%Highest and lowest reading in Western Asia.
- Western Africa
11.1%
the middle country, of 15 measured · 16 members
Togo74.5% Sierra Leone0.8%
Highest and lowest reading in Western Africa.
- Central America
10.9%
the middle country, of 8 measured · 8 members
 Panama76.7%
 El Salvador0.5%
Highest and lowest reading in Central America.
- South-eastern Asia
9.9%
the middle country, of 9 measured · 11 members
 Indonesia43.6%
 Vietnam1.4%
Highest and lowest reading in South-eastern Asia.
- Eastern Africa
5.3%
the middle country, of 16 measured · 19 members
 Malawi33.1%
3 share 0.0%
Highest and lowest reading in Eastern Africa.
- Caribbean
5.1%
the middle country, of 16 measured · 24 members
 Dominican Republic68.2%British Virgin Islands0.0%
Highest and lowest reading in Caribbean.
- Middle Africa
3.7%
the middle country, of 8 measured · 9 members
 Gabon37.0%
 Angola0.3%
Highest and lowest reading in Middle Africa.
- Polynesia
0.0%
the middle country, of 5 measured · 7 members
 Cook Islands100.0%
3 share 0.0%
Highest and lowest reading in Polynesia.
- Australia and New Zealand
2 of 2 measured — too few for a middle: Australia, New Zealand.
 Australia100.0%
 New Zealand79.9%
Highest and lowest reading in Australia and New Zealand.
- Melanesia
4 of 5 measured — too few for a middle: Fiji, New Caledonia, Papua New Guinea, Vanuatu.
 New Caledonia98.6%
 Papua New Guinea0.0%
Highest and lowest reading in Melanesia.
- Micronesia
4 of 7 measured — too few for a middle: Kiribati, Marshall Islands, Micronesia, Nauru.
 Nauru66.0%
 Marshall Islands0.0%
Highest and lowest reading in Micronesia.
- Northern America
4 of 4 measured — too few for a middle: Bermuda, Canada, Greenland, United States.
2 share 100.0%
 Bermuda1.4%
Highest and lowest reading in Northern America.
03The whole field at once
The spread
190 countries, one dot each, on one scale — further right is a higher value. Half the countries are above 23.8%; a quarter are above 67.1%, and a quarter below 5.9%. The bar in each row marks that continent’s middle country.
04All 190 ever measured
Every country
In order, highest value first. No rank or position is shown: too many countries share the same value for an order to mean anything. Many countries reach 100%, so no position is shown — ordering a ceiling would invent differences that are not there. The figure counts who receives a benefit, not how much it pays, and some countries count children while others count households.
Showing 25 of 190 countries



























































































































Values for the 2024 edition.
05In this edition
Child benefit coverage in records
The extremes of the statistic. A record reached by more than one country names none of them.
Highest reading
Reached 32 times by 32 countries — shared, so no holder is named
100.0%
Children or households with children receiving child or family cash benefits (%)
Lowest reading
Reached 9 times by 9 countries — shared, so no holder is named
0.0%
Children or households with children receiving child or family cash benefits (%)
06The measure
About child benefit coverage
This is the share of children — or of households with children, where that is how a country pays the benefit — receiving a child or family cash benefit. It is the child part of the United Nations’ measure of social protection.
What the number is: Children or households with children receiving child or family cash benefits (%).
07Where it fits
Connections
Its part in the Country Index, the statistics whose values line up most closely with it across countries, and others on the same subject.
In the Country Index
Context, with no vote
This statistic is published in full under Governance & Institutions and Development & Human Capital, but does not help decide any Country Index standing.
Governance & InstitutionsDevelopment & Human CapitalWhich statistics vote, and why
Moves with
Where child benefit coverage is higher, these tend to be higher too.
- Social Protection CoverageKeyILO · 189 countries in commonρ 0.75
- Women's Empowerment IndexUNDP Human Development Report Office and UN Women · 110 countries in commonρ 0.71
- GNI per Capita (PPP)World Bank Group · 95 countries in commonρ 0.70
Moves against
Where child benefit coverage is higher, these tend to be lower.
- Informal Employment RateILO · 90 countries in commonρ −0.67
- Average Household SizeUN DESA Population Division · 129 countries in commonρ −0.67
- Climate Vulnerability (ND-GAIN)KeyNotre Dame Global Adaptation Initiative (ND-GAIN), University of Notre Dame · 174 countries in commonρ −0.66
Rank correlation (ρ, from −1 to 1) across countries, on each statistic’s newest edition, out of 377 statistics sharing at least 80 countries with this one. Two statistics that move together do not cause each other.
08Keep reading
Explore further
The data, edition by edition
The countries at either end
09Questions
Child benefit coverage: questions and answers
Which country has the highest child benefit coverage?
32 countries share the highest reading, 100.0%, among the 190 compared in the 2024 edition, so no single country is named.
Which country has the lowest child benefit coverage?
9 countries share the lowest reading, 0.0%, among the 190 compared in the 2024 edition, so no single country is named.
How many countries does the Child and Family Benefit Coverage cover?
190 in the 2024 edition.
What is the world average child benefit coverage?
This site does not calculate a world average, which would depend on how countries are weighted. In the middle country of the 190 compared in the 2024 edition, the figure was 23.8%.
Is this International Labour Organization (ILO)’s own ranking?
No ranking is shown. International Labour Organization (ILO) publishes values only, and too many countries share the same value for an ordering to mean anything, so none is derived.
How often is the Child and Family Benefit Coverage published?
This site holds one edition, describing 2024.
Where does the data come from, and can I download it?
From International Labour Organization (ILO), under CC BY 4.0. The child part of SDG indicator 1.3.1, from the ILO’s World Social Protection Report, read from ILOSTAT directly. Every edition is on this site’s Datasets pages as a full table, and downloads as a CSV file with every value unrounded.
10Method
Sources, method and citation
Source
Child and Family Benefit Coverage — International Labour Organization (ILO)
The child part of SDG indicator 1.3.1, from the ILO’s World Social Protection Report, read from ILOSTAT directly.
Newest edition
Report year 2024Data year not recorded
Cite the source as: International Labour Organization. World Social Protection Report. Geneva: ILO.
Licence: CC BY 4.0, checked 2026-10-03.
How this page reads the numbers
- No rank or position is shown: International Labour Organization (ILO) publishes values only, and too many countries share the same value for an ordering to mean anything.
- Which end is better follows the publisher’s own reading of the measure.
- A country is named at an end only when it holds that value alone. Where several share it, the page says how many and names none first.
- The file gives each country’s most recent reading, so the rows are from different years. Readings from before 2014 are listed but left out of every comparison on this page.
- Values are stored exactly as published and trimmed only for display. “The middle country” is the median of the countries measured, not a world average.
The file itself, column by column — where it came from, what each column holds, and every edition as a CSV — is on its dataset page.
Cite this page
Nations Inquiry (2026). Child benefit coverage by country: Child and Family Benefit Coverage, data from International Labour Organization (ILO). https://nationsinquiry.com/statistics/child-benefit-coverage