Loading…
ILO · Average Weekly Hours Worked
Weekly hours worked by country
How many hours a week does the average worker actually work?
Of the 182 countries compared in 2025, Bhutan had the highest reading, 54.70, and Yemen had the lowest reading, 23.64. In the middle country the figure was 38.89. Among the 182 countries measured in every edition since 2005, the middle one moved from 39.27 to 38.89.
Weekly hours worked · 2025
Context statistic

Highest of 182Bhutan
54.70012025 · position · derived
The highest and the lowest
The three countries with the highest values of 182 compared, the three with the lowest, and the highest on each continent. This statistic has no better end, so no country is shown as leading.
- 1
- 2

- 3

Lowest in 2025
- 182
 Yemen23.64
 - 181
 Netherlands26.57
 - 180
 Norway26.59
Positions out of 182. This statistic has no better end: the two ends describe size, not success.
02Every measured country
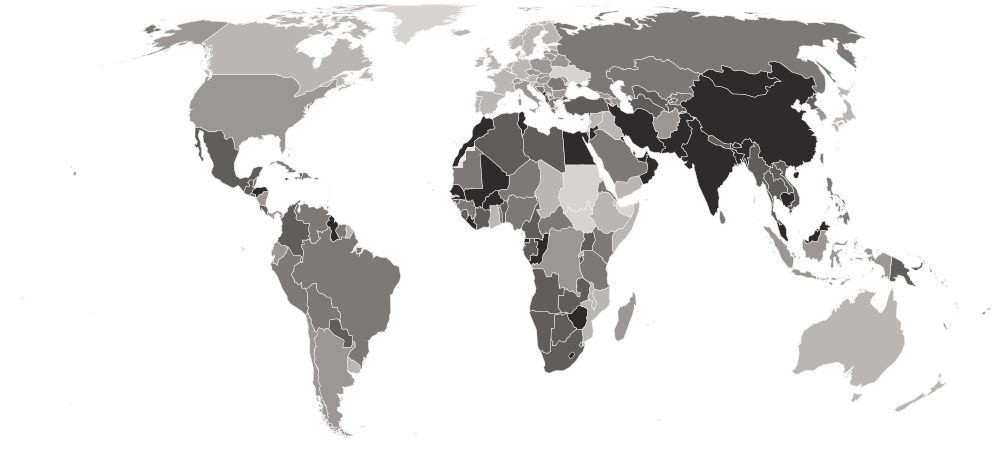
Weekly hours worked on a map
Each country is shaded by its value, in five groups holding the same number of countries. Hover a country for its value, or select it to open its profile. Below the map, each continent’s middle country.
Darker is a higher value. This statistic has no better end, so the shades describe size, not success.
- 23.64–33.75
- 33.87–37.60
- 37.85–40.80
- 40.84–43.28
- 43.31–54.70
- No reading in 2025 (5 measured in an earlier edition)
- Asia
41.52
the middle country, of 49 measured · 52 members
Bhutan54.70Yemen23.64Highest and lowest reading in Asia.
- Africa
41.48
the middle country, of 51 measured · 55 members
Lesotho49.98 Rwanda29.31
Highest and lowest reading in Africa.
- Americas
38.30
the middle country, of 33 measured · 48 members
 Honduras44.21
 Canada31.86
Highest and lowest reading in Americas.
- Oceania
35.33
the middle country, of 11 measured · 21 members
 Samoa45.11
 Vanuatu28.32
Highest and lowest reading in Oceania.
- Europe
33.88
the middle country, of 38 measured · 49 members
 Montenegro43.43Netherlands26.57
Highest and lowest reading in Europe.
- Every region
22 sub-regions, highest middle country first
- Southern Asia
45.78
the middle country, of 9 measured · 9 members
Bhutan54.70 Afghanistan35.59
Highest and lowest reading in Southern Asia.
- Northern Africa
44.12
the middle country, of 5 measured · 6 members
 Morocco44.21
 Libya42.40
Highest and lowest reading in Northern Africa.
- Eastern Asia
42.42
the middle country, of 8 measured · 8 members
 Mongolia46.54
 Japan31.10
Highest and lowest reading in Eastern Asia.
- Middle Africa
42.30
the middle country, of 9 measured · 9 members
São Tomé and Príncipe49.00 Chad30.55
Highest and lowest reading in Middle Africa.
- Southern Africa
42.06
the middle country, of 5 measured · 5 members
Lesotho49.98 South Africa41.06
Highest and lowest reading in Southern Africa.
- Western Africa
41.77
the middle country, of 16 measured · 16 members
 Burkina Faso48.20
 Ghana32.69
Highest and lowest reading in Western Africa.
- South-eastern Asia
41.76
the middle country, of 11 measured · 11 members
 Cambodia46.19
 Timor-Leste33.59
Highest and lowest reading in South-eastern Asia.
- Central America
41.22
the middle country, of 8 measured · 8 members
Honduras44.21 Nicaragua35.92
Highest and lowest reading in Central America.
- Central Asia
40.96
the middle country, of 5 measured · 5 members
 Turkmenistan41.48
 Kazakhstan37.92
Highest and lowest reading in Central Asia.
- Western Asia
39.20
the middle country, of 16 measured · 19 members
 Jordan48.50Yemen23.64
Highest and lowest reading in Western Asia.
- Caribbean
39.09
the middle country, of 11 measured · 24 members
 Jamaica43.43
 Barbados34.47
Highest and lowest reading in Caribbean.
- South America
37.97
the middle country, of 12 measured · 12 members
 Guyana43.31
 Uruguay33.68
Highest and lowest reading in South America.
- Eastern Africa
37.83
the middle country, of 16 measured · 19 members
 Zimbabwe44.44Rwanda29.31
Highest and lowest reading in Eastern Africa.
- Eastern Europe
36.32
the middle country, of 9 measured · 10 members
 Romania38.48
 Slovakia33.88
Highest and lowest reading in Eastern Europe.
- Southern Europe
35.53
the middle country, of 12 measured · 17 members
Montenegro43.43 Spain31.95
Highest and lowest reading in Southern Europe.
- Melanesia
35.33
the middle country, of 5 measured · 5 members
 Papua New Guinea40.84Vanuatu28.32
Highest and lowest reading in Melanesia.
- Western Europe
30.87
the middle country, of 7 measured · 9 members
 Switzerland34.61Netherlands26.57
Highest and lowest reading in Western Europe.
- Northern Europe
30.81
the middle country, of 10 measured · 13 members
 Lithuania35.36Norway26.59
Highest and lowest reading in Northern Europe.
- Australia and New Zealand
2 of 2 measured — too few for a middle: Australia, New Zealand.
 New Zealand33.48
 Australia31.29
Highest and lowest reading in Australia and New Zealand.
- Micronesia
1 of 7 measured — too few for a middle: Guam.
 Guam37.93
Highest and lowest reading in Micronesia.
- Northern America
2 of 4 measured — too few for a middle: Canada, United States.
 United States36.27Canada31.86
Highest and lowest reading in Northern America.
- Polynesia
3 of 7 measured — too few for a middle: French Polynesia, Samoa, Tonga.
Samoa45.11 Tonga30.74
Highest and lowest reading in Polynesia.
03The whole field at once
The spread
182 countries, one dot each, on one scale — further right is a higher value. Half the countries are above 38.89; a quarter are above 42.39, and a quarter below 34.86. The bar in each row marks that continent’s middle country.
04All 187 ever measured
Every country
In order, highest value first. “=” marks a position shared with another country. International Labour Organization (ILO) ranks nobody on this measure; the position is derived here by ordering the published values. Neither end of this table is the good end. A short average week means chosen leisure in one country and not enough work to go round in another, and the figure alone does not distinguish them — the position here orders by size, not by merit.
Showing 25 of 187 countries








































































































































Values for 2025. The change column compares 2025 with 2024 only; the sparkline covers the recent editions.
052005–2025 · 21 reference years
Over time
Each point is one year from 2005. Working hours fall slowly almost everywhere as economies grow richer, which is one of the least-remarked-on forms of progress.
- the middle country
- the middle half of countries
- the middle of the 182 countries measured every time
- each continent’s middle country
The same, year by year
| Year | Countries | Middle country | Middle half | Measured every time |
|---|---|---|---|---|
| 2025 | 182 | 38.89 | 34.86 – 42.39 | 38.89 |
| 2024 | 182 | 38.91 | 34.85 – 42.33 | 38.91 |
| 2023 | 184 | 38.81 | 34.89 – 42.67 | 38.81 |
| 2022 | 186 | 39.37 | 34.83 – 42.55 | 39.17 |
| 2021 | 187 | 38.78 | 34.45 – 41.74 | 38.64 |
| 2020 | 187 | 37.21 | 33.45 – 40.92 | 37.07 |
| 2019 | 187 | 38.97 | 35.22 – 42.40 | 38.86 |
| 2018 | 187 | 39.20 | 35.36 – 42.34 | 39.08 |
| 2017 | 187 | 39.25 | 35.21 – 42.33 | 39.21 |
| 2016 | 187 | 39.23 | 35.20 – 42.63 | 39.20 |
| 2015 | 187 | 39.11 | 35.12 – 42.54 | 39.10 |
| 2014 | 187 | 38.96 | 35.37 – 42.59 | 38.96 |
| 2013 | 187 | 39.06 | 35.48 – 42.49 | 39.03 |
| 2012 | 187 | 38.98 | 35.64 – 42.57 | 38.94 |
| 2011 | 187 | 39.17 | 35.56 – 42.72 | 39.14 |
| 2010 | 187 | 39.28 | 35.69 – 42.89 | 39.18 |
| 2009 | 187 | 39.16 | 35.69 – 42.83 | 39.14 |
| 2008 | 187 | 39.40 | 36.04 – 43.24 | 39.39 |
| 2007 | 187 | 39.37 | 36.14 – 43.43 | 39.35 |
| 2006 | 187 | 39.28 | 36.08 – 43.66 | 39.27 |
| 2005 | 187 | 39.32 | 36.06 – 43.63 | 39.27 |
062024 → 2025
Who rose and fell
The biggest changes in value between the two newest editions — reference years recalculated in one report, not two separate publications. Places are shown second, because they also move when other countries do.
Rose most
before → after Costa Rica41.33 → 41.96 · 62nd → 53rd+0.63
 Paraguay40.99 → 41.29 · 69th → 64th+0.30
 Portugal33.20 → 33.46 · 151st → 150th+0.26
 Brazil37.81 → 38.04 · 109th → 102nd+0.23
 Colombia42.14 → 42.34 · 50th → 47th+0.20
Fell most
before → after Serbia38.18 → 37.17 · 101st → 115th−1.01
- South Africa41.80 → 41.06 · 55th → 68th−0.74
 Syria29.23 → 28.53 · 174th → 178th−0.70
- Yemen24.27 → 23.64 · 182nd → 182nd−0.63
 Myanmar42.34 → 41.74 · 46th → 56th−0.60
182 countries were measured in both 2024 and 2025.
07Across every edition
Weekly hours worked in records
The extremes of the statistic. A record reached by more than one country names none of them.
Highest reading on record
54.72
Average weekly hours actually worked per employed person
Lowest reading on record
23.64
Average weekly hours actually worked per employed person
Biggest rise between editions
+8.47
33.24 → 41.71
Biggest fall between editions
−7.09
40.03 → 32.94
Biggest change since first measured
+15.11
26.59 → 41.70
Highest most often
17 of 21
editions, alone at the first-listed end
08By sex
Inside the number
International Labour Organization (ILO) also publishes separate female and male readings. The gap between them, where both exist.
Of the 182 countries with both readings, the women reading is higher in 6, the men reading in 176. The widest gaps each way:
09The measure
About weekly hours worked
This is how many hours the average employed person actually works in a week — not what their contract says, but what they report doing, including overtime and after subtracting leave and sickness.
What the number is: Average weekly hours actually worked per employed person.
10Where it fits
Connections
Its part in the Country Index, the statistics whose values line up most closely with it across countries, and others on the same subject.
In the Country Index
Context, with no vote
This statistic is published in full under Work & Labour and Health & Wellbeing, but does not help decide any Country Index standing.
Work & LabourHealth & WellbeingWhich statistics vote, and why
Moves with
Where weekly hours worked is higher, these tend to be higher too.
- Youth Not in Education, Employment or TrainingILO · 93 countries in commonρ 0.58
- Informal Employment RateILO · 88 countries in commonρ 0.51
- Social Institutions and Gender IndexKeyOECD · 134 countries in commonρ 0.49
Moves against
Where weekly hours worked is higher, these tend to be lower.
- Research and Development SpendingUIS · 82 countries in commonρ −0.69
- World Energy Trilemma IndexWorld Energy Council · 125 countries in commonρ −0.52
- Tertiary Enrolment RatioUIS · 84 countries in commonρ −0.49
Rank correlation (ρ, from −1 to 1) across countries, on each statistic’s newest edition, out of 125 statistics sharing at least 80 countries with this one. Two statistics that move together do not cause each other.
11Keep reading
Explore further
The subject
The countries at either end
12Questions
Weekly hours worked: questions and answers
Which country has the highest weekly hours worked?
Bhutan, at 54.70, among the 182 countries compared in 2025.
Which country has the lowest weekly hours worked?
Yemen, at 23.64, among the 182 countries compared in 2025.
How many countries does the Average Weekly Hours Worked cover?
182 in 2025, and 187 at least once across all editions. The number measured varies from 182 to 187 between editions.
What is the world average weekly hours worked?
This site does not calculate a world average, which would depend on how countries are weighted. In the middle country of the 182 compared in 2025, the figure was 38.89.
Is this International Labour Organization (ILO)’s own ranking?
No. International Labour Organization (ILO) publishes the values but ranks nobody; the position on this page is derived by Nations Inquiry by ordering the published values, and equal values share a position.
How often is the Average Weekly Hours Worked published?
This site holds 21 reference years, 2005–2025, all recalculated in International Labour Organization (ILO)’s 2026 report on one method — not 21 separate publications.
Where does the data come from, and can I download it?
From International Labour Organization (ILO), under CC BY 4.0. An ILO modelled estimate read from ILOSTAT directly (HOW_2EMP_SEX_NB). Years beyond the current one are not imported. Every edition is available on this site’s Datasets pages as a full table, unrounded.
13Method
Sources, method and citation
Source
Average Weekly Hours Worked — International Labour Organization (ILO)
An ILO modelled estimate read from ILOSTAT directly (HOW_2EMP_SEX_NB). Years beyond the current one are not imported.
Newest edition
Report year 2025Data year 2025
Cite the source as: International Labour Organization. ILO modelled estimates. Geneva: ILOSTAT.
Licence: CC BY 4.0, checked 2026-09-10.
How this page reads the numbers
- International Labour Organization (ILO) ranks nobody on this measure. The position is derived by Nations Inquiry by ordering the published values; equal values share a position.
- This statistic has no better end, so the page describes higher and lower values and never calls a country a leader.
- A country is named at an end only when it holds that value alone. Where several share it, the page says how many and names none first.
- Values are stored exactly as published and trimmed only for display. “The middle country” is the median of the countries measured, not a world average.
The full note on this data
21 reference years (2005–2025), covering 182 to 187 countries, an ILO modelled estimate read from ILOSTAT directly (HOW_2EMP_SEX_NB), with the female and male figures stored beside the headline. Hours ACTUALLY worked, not contracted hours. ⚠ NEITHER END IS BETTER, and the ambiguity is real rather than diplomatic: a low figure is a short working week where hours are chosen and underemployment where they are not, and the number alone cannot say which. ⚠ Because it counts hours actually worked, leave, sickness and short time pull it below the contractual week everywhere — it is not a measure of the legal maximum. Read beside output per hour. ⚠ Some recent values are flagged "Model-based extrapolation"; the status is stored per row. The ILO ranks nobody, so no rank is stored; the POSITION is a SIZE ORDER derived here and labelled as ours.
Cite this page
Nations Inquiry (2026). Weekly hours worked by country: Average Weekly Hours Worked, data from International Labour Organization (ILO). https://nationsinquiry.com/statistics/weekly-hours