Loading…
ILO · Labour Income Share
Labour income share by country
How much of national income goes to workers rather than capital?
Nigeria placed first of the 182 countries compared in 2025, at 75.126%, and Venezuela last, at 9.691%. In the middle country the figure was 46.230%. Among the 182 countries measured in every edition since 2004, the middle one moved from 46.159% to 46.230%.
Part ofWork & Labour
Labour income share · 2025
Key statistic · Work & Labour

Highest of 182Nigeria
75.126%012025 · position · derived
Who leads
The three countries at the highest end of 182 compared, the three at the other end, and the first on each continent.
 1
1Photo: Slashme · CC BY-SA 3.0, greyscale
 2
2Photo: Simon Koopmann derivative work: Jjtkk · CC BY-SA 2.0 de, greyscale
 3
3Photo: Marcin Szala · CC BY-SA 3.0, greyscale
Lowest in 2025
- 182
 Venezuela9.691%
 - 181
 Tajikistan18.995%
 - 180
 Zambia25.929%
Positions out of 182. Where a country sits says how it compares with the others measured, and nothing about why.
02Every measured country
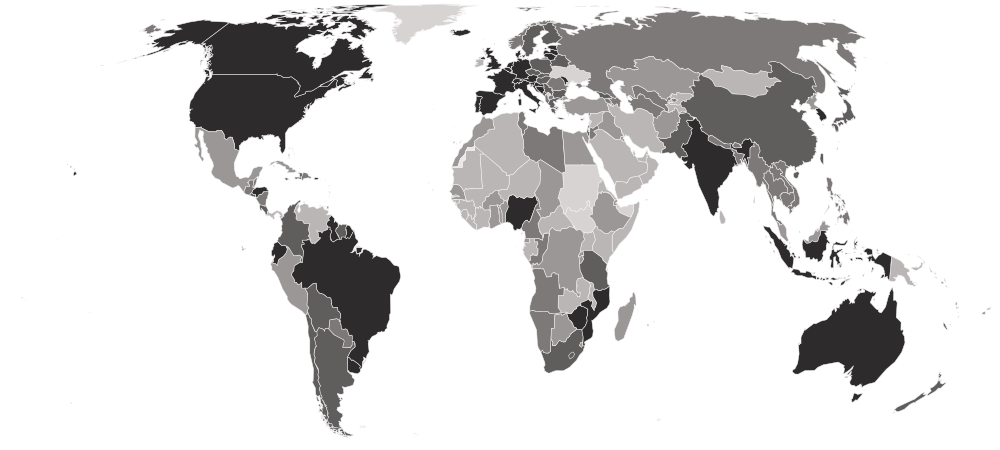
Labour income share on a map
Each country is shaded by its value, in five groups holding the same number of countries. Hover a country for its value, or select it to open its profile. Below the map, each continent’s middle country.
Darker is a higher value — the better end.
- 9.691–37.705%
- 37.739–43.733%
- 43.850–49.161%
- 49.436–55.581%
- 55.807–75.126%
- No reading in 2025 (5 measured in an earlier edition)
- Europe
55.366%
the middle country, of 38 measured · 49 members
 Switzerland71.172%
 Ireland29.228%
Highest and lowest reading in Europe.
- Oceania
51.480%
the middle country, of 11 measured · 21 members
 Vanuatu60.842%
 Papua New Guinea32.566%
Highest and lowest reading in Oceania.
- Americas
50.537%
the middle country, of 33 measured · 48 members
 Brazil59.500%Venezuela9.691%
Highest and lowest reading in Americas.
- Asia
44.206%
the middle country, of 49 measured · 52 members
 India61.825%Tajikistan18.995%
Highest and lowest reading in Asia.
- Africa
40.045%
the middle country, of 51 measured · 55 members
Nigeria75.126%Zambia25.929%Highest and lowest reading in Africa.
- Every region
22 sub-regions, highest middle country first
- Western Europe
62.058%
the middle country, of 7 measured · 9 members
Switzerland71.172% Luxembourg53.080%
Highest and lowest reading in Western Europe.
- Northern Europe
56.469%
the middle country, of 10 measured · 13 members
 Latvia66.504%Ireland29.228%
Highest and lowest reading in Northern Europe.
- Southern Europe
54.905%
the middle country, of 12 measured · 17 members
 Croatia62.910%
 Albania44.539%
Highest and lowest reading in Southern Europe.
- Eastern Asia
51.715%
the middle country, of 8 measured · 8 members
 South Korea58.681%
 Macau30.068%
Highest and lowest reading in Eastern Asia.
- Eastern Europe
51.296%
the middle country, of 9 measured · 10 members
 Moldova60.038%
 Romania44.549%
Highest and lowest reading in Eastern Europe.
- South America
51.185%
the middle country, of 12 measured · 12 members
Brazil59.500%Venezuela9.691%Highest and lowest reading in South America.
- Caribbean
48.396%
the middle country, of 11 measured · 24 members
 Puerto Rico58.997%
 Bahamas34.413%
Highest and lowest reading in Caribbean.
- Southern Asia
48.314%
the middle country, of 9 measured · 9 members
India61.825% Sri Lanka28.146%
Highest and lowest reading in Southern Asia.
- Southern Africa
47.101%
the middle country, of 5 measured · 5 members
 Lesotho54.583%
 Botswana40.045%
Highest and lowest reading in Southern Africa.
- Melanesia
46.935%
the middle country, of 5 measured · 5 members
Vanuatu60.842%Papua New Guinea32.566%Highest and lowest reading in Melanesia.
- Central America
46.671%
the middle country, of 8 measured · 8 members
 Honduras57.363%
 Panama35.592%
Highest and lowest reading in Central America.
- South-eastern Asia
46.225%
the middle country, of 11 measured · 11 members
 Indonesia58.202%
 Timor-Leste31.095%
Highest and lowest reading in South-eastern Asia.
- Central Asia
41.333%
the middle country, of 5 measured · 5 members
 Turkmenistan46.234%Tajikistan18.995%
Highest and lowest reading in Central Asia.
- Northern Africa
40.955%
the middle country, of 5 measured · 6 members
 Tunisia49.161%
 Algeria30.511%
Highest and lowest reading in Northern Africa.
- Middle Africa
40.674%
the middle country, of 9 measured · 9 members
 Cameroon44.374%
 Gabon28.871%
Highest and lowest reading in Middle Africa.
- Western Asia
39.433%
the middle country, of 16 measured · 19 members
 Georgia51.803%
 Bahrain27.479%
Highest and lowest reading in Western Asia.
- Western Africa
38.829%
the middle country, of 16 measured · 16 members
Nigeria75.126% Niger27.758%
Highest and lowest reading in Western Africa.
- Eastern Africa
38.465%
the middle country, of 16 measured · 19 members
 Mozambique61.837%Zambia25.929%
Highest and lowest reading in Eastern Africa.
- Australia and New Zealand
2 of 2 measured — too few for a middle: Australia, New Zealand.
 Australia58.322%
 New Zealand54.068%
Highest and lowest reading in Australia and New Zealand.
- Micronesia
1 of 7 measured — too few for a middle: Guam.
 Guam51.664%
Highest and lowest reading in Micronesia.
- Northern America
2 of 4 measured — too few for a middle: Canada, United States.
 Canada58.697%
 United States55.807%
Highest and lowest reading in Northern America.
- Polynesia
3 of 7 measured — too few for a middle: French Polynesia, Samoa, Tonga.
 French Polynesia51.480%
 Samoa42.110%
Highest and lowest reading in Polynesia.
03The whole field at once
The spread
182 countries, one dot each, on one scale — further right is a higher value. Half the countries are above 46.230%; a quarter are above 53.938%, and a quarter below 39.271%. The bar in each row marks that continent’s middle country.
04All 187 ever measured
Every country
In order, highest value first. “=” marks a position shared with another country. International Labour Organization (ILO) ranks nobody on this measure; the position is derived here by ordering the published values. This moves with the SHAPE of an economy as much as with bargaining power: countries with many self-employed people record labour income differently, so a high or low share is not by itself a verdict on how workers are treated.
Showing 25 of 187 countries







































































































































Values for 2025. The change column compares 2025 with 2024 only; the sparkline covers the recent editions.
052004–2025 · 22 reference years
Over time
Each point is one year from 2004. The long slow decline visible in most rich economies is the pattern the UN's inequality goal is written against.
- the middle country
- the middle half of countries
- the middle of the 182 countries measured every time
- each continent’s middle country
The same, year by year
| Year | Countries | Middle country | Middle half | Measured every time |
|---|---|---|---|---|
| 2025 | 182 | 46.230% | 39.271% – 53.938% | 46.230% |
| 2024 | 182 | 46.060% | 39.358% – 53.914% | 46.060% |
| 2023 | 184 | 45.900% | 38.868% – 53.521% | 46.064% |
| 2022 | 186 | 45.615% | 38.247% – 53.494% | 45.949% |
| 2021 | 187 | 45.433% | 38.721% – 53.236% | 45.712% |
| 2020 | 187 | 47.267% | 40.220% – 55.261% | 47.565% |
| 2019 | 187 | 46.277% | 39.270% – 53.920% | 46.808% |
| 2018 | 187 | 46.187% | 38.604% – 53.767% | 46.364% |
| 2017 | 187 | 46.467% | 40.023% – 53.341% | 46.925% |
| 2016 | 187 | 46.798% | 40.335% – 52.983% | 47.006% |
| 2015 | 187 | 46.876% | 40.750% – 53.435% | 46.929% |
| 2014 | 187 | 47.281% | 39.965% – 53.427% | 47.295% |
| 2013 | 187 | 46.887% | 39.034% – 52.756% | 46.909% |
| 2012 | 187 | 46.231% | 39.039% – 52.602% | 46.396% |
| 2011 | 187 | 45.679% | 38.445% – 52.900% | 46.108% |
| 2010 | 187 | 46.024% | 38.357% – 52.959% | 46.047% |
| 2009 | 187 | 47.071% | 38.956% – 54.279% | 47.479% |
| 2008 | 187 | 45.312% | 37.609% – 52.968% | 45.478% |
| 2007 | 187 | 45.246% | 38.053% – 52.357% | 45.359% |
| 2006 | 187 | 45.670% | 38.117% – 52.499% | 45.786% |
| 2005 | 187 | 46.265% | 37.763% – 52.503% | 46.442% |
| 2004 | 187 | 46.012% | 38.103% – 53.423% | 46.159% |
062024 → 2025
Who rose and fell
The biggest changes in value between the two newest editions — reference years recalculated in one report, not two separate publications. Places are shown second, because they also move when other countries do.
Improved most
before → after Bosnia and Herzegovina53.416% → 56.168% · 49th → 33rd+2.752
 Poland47.825% → 49.592% · 82nd → 71st+1.767
 Lithuania55.197% → 56.765% · 36th → 30th+1.568
 Slovenia60.578% → 61.927% · 14th → 9th+1.349
 Hungary49.989% → 51.296% · 68th → 63rd+1.307
Declined most
before → after- Ireland31.571% → 29.228% · 167th → 174th−2.343
 Kuwait38.980% → 37.739% · 139th → 145th−1.241
 Egypt39.363% → 38.242% · 136th → 141st−1.121
 Ecuador58.278% → 57.409% · 22nd → 28th−0.869
 New Caledonia53.675% → 52.942% · 47th → 53rd−0.733
182 countries were measured in both 2024 and 2025.
07Across every edition
Labour income share in records
The extremes of the statistic. A record reached by more than one country names none of them.
Highest reading on record
75.279%
Labour income share of GDP (%)
Lowest reading on record
9.558%
Labour income share of GDP (%)
Biggest improvement between editions
+27.896
20.692% → 48.588%
Biggest decline between editions
−21.581
48.588% → 27.007%
Most improved since first measured
+30.962
13.318% → 44.280%
At the top most often
12 of 22
editions, alone at the first-listed end
08The measure
About labour income share
The labour income share is how much of a country's national income is paid to workers, rather than going to capital as profit, interest and rent. It is one of the few openly licensed measures of how an economy's output is divided.
What the number is: Labour income share of GDP (%).
What it does not measure
It measures how income is split between work and capital, not how evenly pay is spread between workers.
09Where it fits
Connections
Its part in the Country Index, the statistics whose values line up most closely with it across countries, and others on the same subject.
In the Country Index
A key statistic for Work & Labour
“How much of national income reaches workers rather than owners of capital.”
- Edition used
- 2025 (data 2025)
- Countries
- 182
- Licence
- CC BY 4.0
Moves with
Where labour income share is higher, these tend to be higher too.
- Research and Development SpendingUIS · 82 countries in commonρ 0.59
- V-Dem Electoral Democracy IndexKeyV-Dem Institute, University of Gothenburg · 169 countries in commonρ 0.55
- Voice and AccountabilityWorld Bank Group · 181 countries in commonρ 0.55
Moves against
Where labour income share is higher, these tend to be lower.
- Social Institutions and Gender IndexKeyOECD · 134 countries in commonρ −0.54
- Informal Employment RateILO · 88 countries in commonρ −0.49
- Gender Inequality IndexKeyUNDP Human Development Report Office · 168 countries in commonρ −0.49
Rank correlation (ρ, from −1 to 1) across countries, on each statistic’s newest edition, out of 125 statistics sharing at least 80 countries with this one. Two statistics that move together do not cause each other.
10Analysis
Charts and analysis on labour income share

Countries in Asia with the highest average salaries 2024
Thirteen Asian countries by gross average monthly wage, each carrying its WORLD rank rather than an Asian one — so the numbers skip, from 11th place to 45th.

Countries With The Highest Average Salaries in 2024
The ten highest-paying countries of 2024, their bars coloured by continent, and six more added for comparison — from Australia in 13th place to India in 85th.
11Keep reading
Explore further
The subject
The countries at either end
12Questions
Labour income share: questions and answers
Which country has the highest labour income share?
Nigeria, at 75.126%, among the 182 countries compared in 2025.
Which country has the lowest labour income share?
Venezuela, at 9.691%, among the 182 countries compared in 2025.
How many countries does the Labour Income Share cover?
182 in 2025, and 187 at least once across all editions. The number measured varies from 182 to 187 between editions.
What is the world average labour income share?
This site does not calculate a world average, which would depend on how countries are weighted. In the middle country of the 182 compared in 2025, the figure was 46.230%.
Is this International Labour Organization (ILO)’s own ranking?
No. International Labour Organization (ILO) publishes the values but ranks nobody; the position on this page is derived by Nations Inquiry by ordering the published values, and equal values share a position.
How often is the Labour Income Share published?
This site holds 22 reference years, 2004–2025, all recalculated in International Labour Organization (ILO)’s 2026 report on one method — not 22 separate publications.
Where does the data come from, and can I download it?
From International Labour Organization (ILO), under CC BY 4.0. An ILO modelled estimate read from ILOSTAT directly. Values the ILO flags as model-based extrapolation are kept and marked as such in their own column; years beyond the current one are not imported at all. Every edition is available on this site’s Datasets pages as a full table, unrounded.
13Method
Sources, method and citation
Source
Labour Income Share — International Labour Organization (ILO)
An ILO modelled estimate read from ILOSTAT directly. Values the ILO flags as model-based extrapolation are kept and marked as such in their own column; years beyond the current one are not imported at all.
Newest edition
Report year 2025Data year 2025
Cite the source as: International Labour Organization. ILO modelled estimates. Geneva: ILOSTAT.
Licence: CC BY 4.0, checked 2026-09-10.
How this page reads the numbers
- International Labour Organization (ILO) ranks nobody on this measure. The position is derived by Nations Inquiry by ordering the published values; equal values share a position.
- Which end is better follows the publisher’s own reading of the measure.
- A country is named at an end only when it holds that value alone. Where several share it, the page says how many and names none first.
- Values are stored exactly as published and trimmed only for display. “The middle country” is the median of the countries measured, not a world average.
The full note on this data
22 reference years (2004–2025), covering 182 to 187 countries, an ILO modelled estimate read from ILOSTAT directly (LAP_2GDP_NOC_RT). SDG indicator 10.4.1: how much of national income goes to workers as compensation rather than to capital as profit and rent — one of very few licensed measures of DISTRIBUTION that is not a household survey. ⚠ A falling share is the long-run pattern across most rich economies and is what the SDG target is written against, which is why a higher share sorts first. It moves with the structure of an economy as well as with bargaining power, so a country with a large self-employed sector is not directly comparable with one without. ⚠ SOME RECENT VALUES ARE FLAGGED "Model-based extrapolation" by the ILO and the observation status is stored per row — see the note on that column. ⚠ Years after the current one are not imported: the release runs to 2027 and nothing on this site is a projection. The ILO ranks nobody, so no rank is stored; the POSITION is derived here and labelled as ours.
Photographs
The countries at the top of this statistic, from their profiles: Wikimedia Commons, shown in greyscale, each used under the licence named.
- Nigeria — Slashme, CC BY-SA 3.0
- Switzerland — Simon Koopmann derivative work: Jjtkk, CC BY-SA 2.0 de
- Latvia — Marcin Szala, CC BY-SA 3.0
Cite this page
Nations Inquiry (2026). Labour income share by country: Labour Income Share, data from International Labour Organization (ILO). https://nationsinquiry.com/statistics/labour-income-share