World Bank Group · New Business Density
New business density by country
How many new companies are registered each year for every 1,000 working-age people?
Of the 116 countries compared in 2024, Estonia had the highest reading, 26.760, and Somalia had the lowest reading, 0.020. In the middle country the figure was 2.187. Among the 79 countries measured in every edition since 2006, the middle one moved from 1.799 to 2.662.
Share
Part ofEconomy & Innovation
New business density · 2024
Context statistic

Highest of 116Estonia
26.760012024 · values only
Who leads
The three countries at the highest end of 116 compared, the three at the other end, and the first on each continent.
 1
1Photo: Andrus Uuetalu derivative work: Jjtkk · CC BY-SA 3.0 ee, greyscale
 2
2Photo: Ximonic , Simo Räsänen derivative work: Jjtkk · CC BY-SA 3.0, greyscale
 3
3Photo: Michal Osmenda from Brussels, Belgium · CC BY-SA 2.0, greyscale
Lowest in 2024
 Somalia0.020
 Bangladesh0.065
 Central African Republic0.099
Where a country sits says how it compares with the others measured, and nothing about why.
02Every measured country
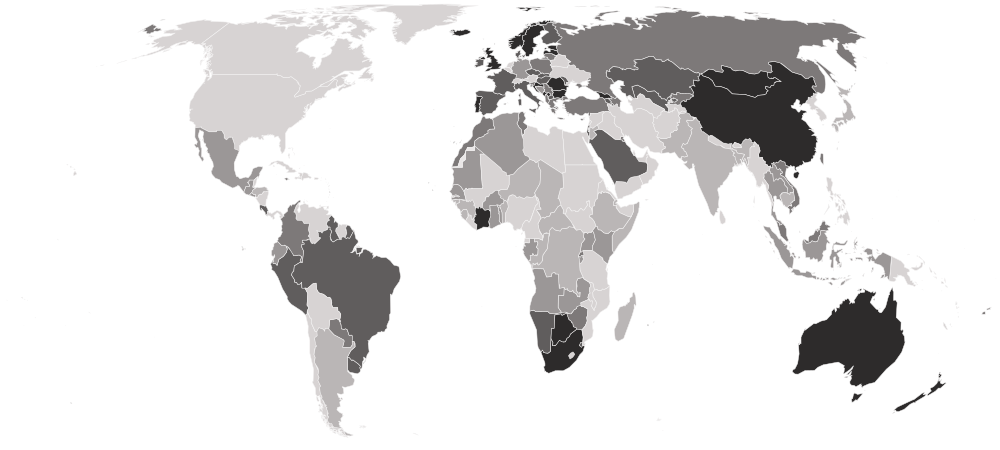
New business density on a map
Each country is shaded by its value, in five groups holding the same number of countries. Hover a country for its value, or select it to open its profile. Below the map, each continent’s middle country.
Darker is a higher value — the better end.
- 0.020–0.732
- 0.765–1.749
- 1.761–2.772
- 2.793–6.849
- 7.021–26.760
- No reading in 2024 (42 measured in an earlier edition)
- Europe
6.308
the middle country, of 34 measured · 49 members
Estonia26.760 Germany1.443
Highest and lowest reading in Europe.
- Asia
1.999
the middle country, of 27 measured · 52 members
 China15.590Bangladesh0.065
Highest and lowest reading in Asia.
- Americas
1.991
the middle country, of 14 measured · 48 members
 Brazil6.667
 Honduras0.374
Highest and lowest reading in Americas.
- Africa
1.040
the middle country, of 37 measured · 55 members
 Cabo Verde21.757Somalia0.020
Highest and lowest reading in Africa.
- Oceania
4 of 21 measured — too few for a middle: Australia, Fiji, New Zealand, Tonga.
 Australia18.061
 Tonga0.697
Highest and lowest reading in Oceania.
- Every region
20 sub-regions, highest middle country first
- Northern Europe
7.052
the middle country, of 10 measured · 13 members
Estonia26.760 Lithuania2.132
Highest and lowest reading in Northern Europe.
- Eastern Europe
4.598
the middle country, of 8 measured · 10 members
 Bulgaria10.456
 Russia2.285
Highest and lowest reading in Eastern Europe.
- Southern Europe
3.673
the middle country, of 13 measured · 17 members
 Montenegro17.862
 Bosnia and Herzegovina1.645
Highest and lowest reading in Southern Europe.
- South America
2.562
the middle country, of 8 measured · 12 members
Brazil6.667 Argentina0.525
Highest and lowest reading in South America.
- Western Asia
2.109
the middle country, of 10 measured · 19 members
 Georgia7.615
 Palestine0.171
Highest and lowest reading in Western Asia.
- South-eastern Asia
1.569
the middle country, of 7 measured · 11 members
 Malaysia2.379
 Cambodia0.455
Highest and lowest reading in South-eastern Asia.
- Central America
1.018
the middle country, of 5 measured · 8 members
 Costa Rica6.312Honduras0.374
Highest and lowest reading in Central America.
- Eastern Africa
0.980
the middle country, of 11 measured · 19 members
 Zimbabwe2.772Somalia0.020
Highest and lowest reading in Eastern Africa.
- Western Africa
0.833
the middle country, of 13 measured · 16 members
Cabo Verde21.757 Niger0.100
Highest and lowest reading in Western Africa.
- Middle Africa
0.267
the middle country, of 6 measured · 9 members
 Gabon1.573Central African Republic0.099
Highest and lowest reading in Middle Africa.
- Australia and New Zealand
2 of 2 measured — too few for a middle: Australia, New Zealand.
Australia18.061 New Zealand16.048
Highest and lowest reading in Australia and New Zealand.
- Caribbean
1 of 24 measured — too few for a middle: Jamaica.
 Jamaica2.599
Highest and lowest reading in Caribbean.
- Central Asia
3 of 5 measured — too few for a middle: Kazakhstan, Kyrgyzstan, Uzbekistan.
 Kazakhstan3.346
 Kyrgyzstan2.153
Highest and lowest reading in Central Asia.
- Eastern Asia
4 of 8 measured — too few for a middle: China, Japan, Mongolia, Taiwan.
China15.590 Japan0.576
Highest and lowest reading in Eastern Asia.
- Melanesia
1 of 5 measured — too few for a middle: Fiji.
 Fiji2.699
Highest and lowest reading in Melanesia.
- Northern Africa
3 of 6 measured — too few for a middle: Algeria, Morocco, Tunisia.
 Morocco2.662
 Algeria0.829
Highest and lowest reading in Northern Africa.
- Polynesia
1 of 7 measured — too few for a middle: Tonga.
Tonga0.697Highest and lowest reading in Polynesia.
- Southern Africa
4 of 5 measured — too few for a middle: Botswana, Eswatini, Namibia, South Africa.
 Botswana13.332
 Eswatini4.392
Highest and lowest reading in Southern Africa.
- Southern Asia
3 of 9 measured — too few for a middle: Bangladesh, India, Pakistan.
 Pakistan0.202Bangladesh0.065
Highest and lowest reading in Southern Asia.
- Western Europe
3 of 9 measured — too few for a middle: France, Germany, Luxembourg.
 Luxembourg19.611Germany1.443
Highest and lowest reading in Western Europe.
03The whole field at once
The spread
116 countries, one dot each, on one scale — further right is a higher value. Half the countries are above 2.187; a quarter are above 6.056, and a quarter below 0.951. The bar in each row marks that continent’s middle country.
Log scale: each gridline is ten times the one before, so countries of very different sizes can be seen on one line.
04All 158 ever measured
Every country
In order, highest value first. No rank or position is shown: too many countries share the same value for an order to mean anything. A registration is not a working business: the top of this table is where incorporating is cheapest and quickest, including for people abroad, as much as where most firms start. Offshore financial centres, where most registrations are shell companies, are left out, as the World Bank leaves them out of its own analysis. China’s figure is Shanghai’s alone, and for Canada and DR Congo only some registries are counted.
Showing 25 of 158 countries




















































































































Values for 2024. The change column compares 2024 with 2023 only; the sparkline covers the recent editions.
052006–2024 · 19 reference years
Over time
Each point is one year from 2006. Registrations react quickly to recessions, reforms and changes to registry rules, so a single year’s jump can be administrative rather than economic.
- the middle country
- the middle half of countries
- the middle of the 79 countries measured every time
- each continent’s middle country
The same, year by year
| Year | Countries | Middle country | Middle half | Measured every time |
|---|---|---|---|---|
| 2024 | 116 | 2.187 | 0.951 – 6.056 | 2.662 |
| 2023 | 122 | 2.255 | 0.974 – 5.797 | 2.552 |
| 2022 | 133 | 2.222 | 0.792 – 5.550 | 2.601 |
| 2021 | 130 | 1.970 | 0.741 – 5.121 | 2.337 |
| 2020 | 143 | 1.783 | 0.607 – 4.182 | 2.149 |
| 2019 | 142 | 1.874 | 0.791 – 4.195 | 2.103 |
| 2018 | 151 | 1.581 | 0.578 – 3.868 | 2.112 |
| 2017 | 148 | 1.521 | 0.529 – 3.765 | 1.977 |
| 2016 | 146 | 1.435 | 0.515 – 3.846 | 1.817 |
| 2015 | 143 | 1.274 | 0.514 – 3.596 | 1.661 |
| 2014 | 142 | 1.262 | 0.394 – 3.662 | 1.598 |
| 2013 | 138 | 1.339 | 0.461 – 3.885 | 1.605 |
| 2012 | 130 | 1.257 | 0.442 – 3.951 | 1.616 |
| 2011 | 126 | 1.136 | 0.461 – 3.902 | 1.530 |
| 2010 | 123 | 1.104 | 0.439 – 3.580 | 1.566 |
| 2009 | 123 | 1.099 | 0.412 – 3.071 | 1.376 |
| 2008 | 118 | 1.252 | 0.370 – 4.109 | 1.560 |
| 2007 | 111 | 1.230 | 0.329 – 3.977 | 1.537 |
| 2006 | 108 | 1.163 | 0.340 – 3.531 | 1.799 |
062023 → 2024
Who rose and fell
The biggest changes in value between the two newest editions — reference years recalculated in one report, not two separate publications. Places are shown second, because they also move when other countries do.
Improved most
before → after- Botswana7.892 → 13.332+5.440
- Cabo Verde18.011 → 21.757+3.745
 Portugal7.377 → 10.995+3.618
 Saudi Arabia1.917 → 5.457+3.540
- Estonia24.847 → 26.760+1.913
Declined most
before → after- China20.068 → 15.590−4.478
- Montenegro22.155 → 17.862−4.293
 Ghana2.391 → 1.370−1.021
 United Kingdom20.152 → 19.191−0.961
 Iceland11.807 → 10.856−0.951
116 countries were measured in both 2023 and 2024. The field changed from 122 to 116 countries, so a place can move for reasons that have nothing to do with the country itself.
07Across every edition
New business density in records
The extremes of the statistic. A record reached by more than one country names none of them.
Highest reading on record
29.405
New limited liability companies registered per 1,000 people aged 15–64
Lowest reading on record
0.011
New limited liability companies registered per 1,000 people aged 15–64
Biggest improvement between editions
+12.632
14.375 → 27.006
Biggest decline between editions
−19.251
19.573 → 0.322
Most improved since first measured
+20.220
1.536 → 21.757
At the top most often
10 of 19
editions, alone at the first-listed end
08The measure
About new business density
New business density counts the limited liability companies registered in a year for every 1,000 people of working age. Collected by the World Bank straight from business registries, it is the standard comparable measure of how many new formal companies a country creates.
What the number is: New limited liability companies registered per 1,000 people aged 15–64.
09Where it fits
Connections
Its part in the Country Index, the statistics whose values line up most closely with it across countries, and others on the same subject.
In the Country Index
Context, with no vote
This statistic is published in full under Economy & Innovation, but does not help decide any Country Index standing.
Moves with
Where new business density is higher, these tend to be higher too.
- Women's Empowerment IndexUNDP Human Development Report Office and UN Women · 82 countries in commonρ 0.72
- Tax Revenue (% of GDP)OECD · 80 countries in commonρ 0.71
- Share of Firms' Payments Made ElectronicallyWorld Bank Group · 110 countries in commonρ 0.70
Moves against
Where new business density is higher, these tend to be lower.
- INFORM Risk IndexKeyEuropean Commission Joint Research Centre, with the Inter-Agency Standing Committee · 114 countries in commonρ −0.70
- Children's Climate Risk IndexUNICEF · 109 countries in commonρ −0.66
- Gender Inequality IndexUNDP Human Development Report Office · 112 countries in commonρ −0.66
Rank correlation (ρ, from −1 to 1) across countries, on each statistic’s newest edition, out of 318 statistics sharing at least 80 countries with this one. Two statistics that move together do not cause each other.
10Keep reading
Explore further
The subject
The countries at either end
More from World Bank Group
11Questions
New business density: questions and answers
Which country has the highest new business density?
Estonia, at 26.760, among the 116 countries compared in 2024.
Which country has the lowest new business density?
Somalia, at 0.020, among the 116 countries compared in 2024.
How many countries does the New Business Density cover?
116 in 2024, and 158 at least once across all editions. The number measured varies from 108 to 151 between editions.
What is the world average new business density?
This site does not calculate a world average, which would depend on how countries are weighted. In the middle country of the 116 compared in 2024, the figure was 2.187.
Is this World Bank Group’s own ranking?
No ranking is shown. World Bank Group publishes values only, and too many countries share the same value for an ordering to mean anything, so none is derived.
How often is the New Business Density published?
This site holds 19 reference years, 2006–2024, all recalculated in World Bank Group’s 2025 report on one method — not 19 separate publications.
Where does the data come from, and can I download it?
From World Bank Group, under CC BY 4.0. From the World Bank’s Entrepreneurship Database, read from its own workbook rather than the indicator API, which lacks the workbook’s footnotes. Only limited liability companies are counted; sole proprietors and informal businesses are not. Every edition is on this site’s Datasets pages as a full table, and downloads as a CSV file with every value unrounded.
12Method
Sources, method and citation
Source
New Business Density — World Bank Group
From the World Bank’s Entrepreneurship Database, read from its own workbook rather than the indicator API, which lacks the workbook’s footnotes. Only limited liability companies are counted; sole proprietors and informal businesses are not.
Newest edition
Report year 2024Data year 2024
Cite the source as: World Bank. Entrepreneurship Database (2025 release). Washington, DC: World Bank Group.
Licence: CC BY 4.0, checked 2026-10-03.
How this page reads the numbers
- No rank or position is shown: World Bank Group publishes values only, and too many countries share the same value for an ordering to mean anything.
- Which end is better follows the publisher’s own reading of the measure.
- A country is named at an end only when it holds that value alone. Where several share it, the page says how many and names none first.
- Values are stored exactly as published and trimmed only for display. “The middle country” is the median of the countries measured, not a world average.
The file itself, column by column — where it came from, what each column holds, and every edition as a CSV — is on its dataset page.
Photographs
The countries at the top of this statistic, from their profiles: Wikimedia Commons, shown in greyscale, each used under the licence named.
- Estonia — Andrus Uuetalu derivative work: Jjtkk, CC BY-SA 3.0 ee
- Cabo Verde — Ximonic , Simo Räsänen derivative work: Jjtkk, CC BY-SA 3.0
- Luxembourg — Michal Osmenda from Brussels, Belgium, CC BY-SA 2.0
Cite this page
Nations Inquiry (2026). New business density by country: New Business Density, data from World Bank Group. https://nationsinquiry.com/statistics/new-business-density