World Bank Group · Bribery Incidence
Bribery incidence by country
What share of firms are asked for a bribe when they deal with officials?
Of the 172 countries compared in the 2026 edition, 6 countries shared the lowest reading, 0.000%, and Iraq had the highest reading, 50.466%. In the middle country the figure was 7.213%. 9 readings from before 2016 are listed but not compared.
Share
Part ofGovernance & Institutions
Bribery incidence · the 2026 edition
Context statistic
6 countries share the lowest value, 0.000% — no single country is named first.
01the 2026 edition · position · derived
Who leads
The three countries at the lowest end of 172 compared, the three at the other end, and the first on each continent.
Lowest in the 2026 edition · shared
6 countries share the lowest reading, 0.000%
No single country is named first: picking one from a shared value would be a choice the data does not make.



02Every measured country
Bribery incidence on a map
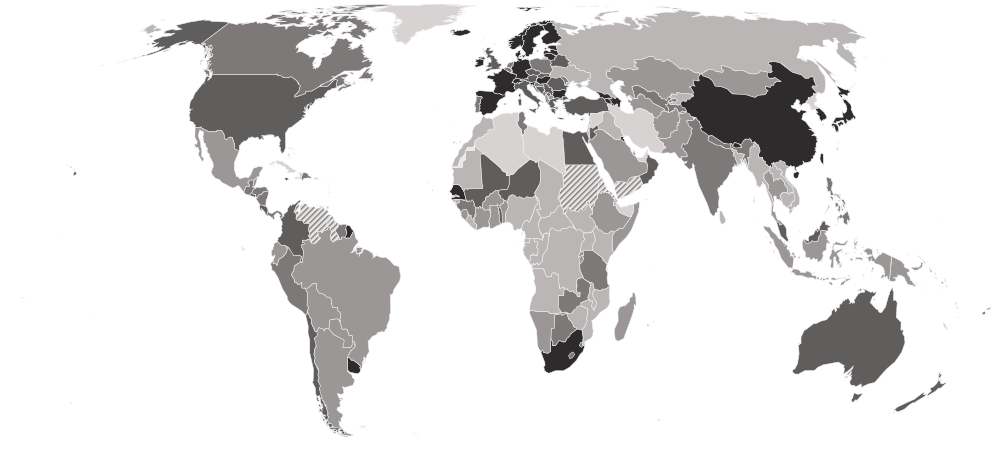
Each country is shaded by its value, in five groups holding the same number of countries. Hover a country for its value, or select it to open its profile. Below the map, each continent’s middle country.
Darker is a lower value — the better end.
- 20.445–50.466%
- 9.488–20.343%
- 5.719–9.397%
- 1.982–5.595%
- 0.000–1.892%
- Hatched: a reading from before 2016, listed but not compared (9)
- No reading in the 2026 edition
- Europe
2.063%
the middle country, of 40 measured · 49 members
4 share 0.000%
 Ukraine37.374%
Lowest and highest reading in Europe.
- Americas
7.113%
the middle country, of 28 measured · 48 members
 Barbados0.000%
 Trinidad and Tobago22.551%
Lowest and highest reading in Americas.
- Asia
8.334%
the middle country, of 45 measured · 52 members
 Japan0.000%
 Iraq50.466%
Lowest and highest reading in Asia.
- Oceania
10.708%
the middle country, of 9 measured · 21 members
 Samoa2.351%
 Kiribati48.113%
Lowest and highest reading in Oceania.
- Africa
17.317%
the middle country, of 50 measured · 55 members
 Senegal0.998%
 Zimbabwe44.462%
Lowest and highest reading in Africa.
- Every region
22 sub-regions, lowest middle country first
- Northern Europe
0.142%
the middle country, of 10 measured · 13 members
3 share 0.000%
 United Kingdom2.067%
Lowest and highest reading in Northern Europe.
- Eastern Asia
0.157%
the middle country, of 6 measured · 8 members
Japan0.000% Mongolia16.087%
Lowest and highest reading in Eastern Asia.
- Western Europe
0.742%
the middle country, of 7 measured · 9 members
 Luxembourg0.000%
 Netherlands6.146%
Lowest and highest reading in Western Europe.
- Southern Europe
3.506%
the middle country, of 13 measured · 17 members
 Spain0.433%
 Albania15.123%
Lowest and highest reading in Southern Europe.
- Eastern Europe
3.785%
the middle country, of 10 measured · 10 members
 Bulgaria0.918%Ukraine37.374%
Lowest and highest reading in Eastern Europe.
- Western Asia
3.856%
the middle country, of 15 measured · 19 members
 Kuwait0.092%Iraq50.466%
Lowest and highest reading in Western Asia.
- Caribbean
5.907%
the middle country, of 8 measured · 24 members
Barbados0.000%Trinidad and Tobago22.551%Lowest and highest reading in Caribbean.
- Southern Africa
7.269%
the middle country, of 5 measured · 5 members
 South Africa1.538%
 Namibia13.774%
Lowest and highest reading in Southern Africa.
- Central America
7.332%
the middle country, of 8 measured · 8 members
 El Salvador3.123%
 Mexico15.817%
Lowest and highest reading in Central America.
- Southern Asia
9.115%
the middle country, of 8 measured · 9 members
 Bhutan0.301%
 Sri Lanka26.235%
Lowest and highest reading in Southern Asia.
- South America
9.615%
the middle country, of 10 measured · 12 members
 Uruguay1.278%
 Paraguay16.078%
Lowest and highest reading in South America.
- Central Asia
10.625%
the middle country, of 5 measured · 5 members
 Uzbekistan7.454%
 Kyrgyzstan31.412%
Lowest and highest reading in Central Asia.
- Western Africa
15.537%
the middle country, of 16 measured · 16 members
Senegal0.998% Mauritania29.440%
Lowest and highest reading in Western Africa.
- Eastern Africa
17.678%
the middle country, of 17 measured · 19 members
 Mauritius5.730%Zimbabwe44.462%
Lowest and highest reading in Eastern Africa.
- South-eastern Asia
19.024%
the middle country, of 11 measured · 11 members
 Singapore0.575%
 Vietnam31.074%
Lowest and highest reading in South-eastern Asia.
- Middle Africa
22.638%
the middle country, of 9 measured · 9 members
 São Tomé and Príncipe13.632%
 Equatorial Guinea40.500%
Lowest and highest reading in Middle Africa.
- Australia and New Zealand
2 of 2 measured — too few for a middle: Australia, New Zealand.
 Australia2.507%
 New Zealand3.976%
Lowest and highest reading in Australia and New Zealand.
- Melanesia
4 of 5 measured — too few for a middle: Fiji, Papua New Guinea, Solomon Islands, Vanuatu.
 Fiji6.894%
 Vanuatu23.475%
Lowest and highest reading in Melanesia.
- Micronesia
1 of 7 measured — too few for a middle: Kiribati.
Kiribati48.113%Lowest and highest reading in Micronesia.
- Northern Africa
3 of 6 measured — too few for a middle: Egypt, Morocco, Tunisia.
 Egypt3.061%
 Morocco29.623%
Lowest and highest reading in Northern Africa.
- Northern America
2 of 4 measured — too few for a middle: Canada, United States.
 United States2.793%
 Canada5.824%
Lowest and highest reading in Northern America.
- Polynesia
2 of 7 measured — too few for a middle: Samoa, Tonga.
Samoa2.351% Tonga10.708%
Lowest and highest reading in Polynesia.
03The whole field at once
The spread
172 countries, one dot each, on one scale — further right is a higher value. Half the countries are above 7.213%; a quarter are above 17.137%, and a quarter below 2.497%. The bar in each row marks that continent’s middle country.
04All 181 ever measured
Every country
In order, highest value first — position 1 is the highest value, the way World Bank Group’s own tables read. “=” marks a position shared with another country. World Bank Group ranks nobody on this measure; the position is derived here by ordering the published values. The Bank counts a firm that declined to answer as one that was asked, so the figures lean high rather than low. A few countries read exactly zero — no surveyed firm reported a request — and share the first position. Survey years differ between countries — check the year beside each reading.
Showing 25 of 181 countries








































































































































Values for the 2026 edition.
05In this edition
Bribery incidence in records
The extremes of the statistic. A record reached by more than one country names none of them.
Highest reading
50.466%
Firms asked for a bribe at least once in six dealings with officials (%)
Lowest reading
Reached 6 times by 6 countries — shared, so no holder is named
0.000%
Firms asked for a bribe at least once in six dealings with officials (%)
06The measure
About bribery incidence
Bribery incidence is the share of private firms that were asked for a bribe — a gift or an informal payment — at least once when dealing with the state: getting an electricity or water connection, a construction permit, an import or operating licence, or meeting tax officials. It comes from the World Bank's Enterprise Surveys and records corruption that firms actually met, not corruption that experts perceive.
What the number is: Firms asked for a bribe at least once in six dealings with officials (%).
What it does not measure
It counts requests reported by formal private firms in six dealings with officials, so the bribery that households, farmers and informal businesses face, and corruption at the top of government, are outside it. A firm that declined to answer is counted as one that was asked.
07Where it fits
Connections
Its part in the Country Index, the statistics whose values line up most closely with it across countries, and others on the same subject.
In the Country Index
Context, with no vote
This statistic is published in full under Governance & Institutions, but does not help decide any Country Index standing.
Moves with
Where bribery incidence is higher, these tend to be higher too.
- Firms Expecting to Make Informal Payments to Public OfficialsWorld Bank Group · 172 countries in commonρ 0.81
- Informal Employment RateILO · 89 countries in commonρ 0.72
- Exclusion by Socio-Economic GroupV-Dem Institute, University of Gothenburg · 160 countries in commonρ 0.66
Moves against
Where bribery incidence is higher, these tend to be lower.
- Climate Readiness (ND-GAIN)Notre Dame Global Adaptation Initiative (ND-GAIN), University of Notre Dame · 167 countries in commonρ −0.70
- Control of CorruptionWorld Bank Group · 172 countries in commonρ −0.68
- Corruption Perceptions IndexKeyTransparency International · 167 countries in commonρ −0.67
Rank correlation (ρ, from −1 to 1) across countries, on each statistic’s newest edition, out of 377 statistics sharing at least 80 countries with this one. Two statistics that move together do not cause each other.
08Keep reading
Explore further
The subject
The data, edition by edition
More from World Bank Group
09Questions
Bribery incidence: questions and answers
Which country has the lowest bribery incidence?
6 countries share the lowest reading, 0.000%, among the 172 compared in the 2026 edition, so no single country is named.
Which country has the highest bribery incidence?
Iraq, at 50.466%, among the 172 countries compared in the 2026 edition.
How many countries does the Bribery Incidence cover?
172 in the 2026 edition, and 181 at least once across all editions.
What is the world average bribery incidence?
This site does not calculate a world average, which would depend on how countries are weighted. In the middle country of the 172 compared in the 2026 edition, the figure was 7.213%.
Is this World Bank Group’s own ranking?
No. World Bank Group publishes the values but ranks nobody; the position on this page is derived by Nations Inquiry by ordering the published values, and equal values share a position.
How often is the Bribery Incidence published?
This site holds one edition, describing 2026.
Where does the data come from, and can I download it?
From World Bank Group, under CC BY 4.0. World Bank Enterprise Surveys on Data360, read from the full-precision bulk file, one reading per country from its most recent survey. Every edition is on this site’s Datasets pages as a full table, and downloads as a CSV file with every value unrounded.
10Method
Sources, method and citation
Source
Bribery Incidence — World Bank Group
World Bank Enterprise Surveys on Data360, read from the full-precision bulk file, one reading per country from its most recent survey.
Newest edition
Report year 2026Data year not recorded
Cite the source as: World Bank. Enterprise Surveys. Washington, DC: World Bank Group.
Licence: CC BY 4.0, checked 2026-10-03.
How this page reads the numbers
- World Bank Group ranks nobody on this measure. The position is derived by Nations Inquiry by ordering the published values; equal values share a position.
- Which end is better follows the publisher’s own reading of the measure.
- A country is named at an end only when it holds that value alone. Where several share it, the page says how many and names none first.
- The file gives each country’s most recent reading, so the rows are from different years. Readings from before 2016 are listed but left out of every comparison on this page.
- Values are stored exactly as published and trimmed only for display. “The middle country” is the median of the countries measured, not a world average.
The file itself, column by column — where it came from, what each column holds, and every edition as a CSV — is on its dataset page.
Cite this page
Nations Inquiry (2026). Bribery incidence by country: Bribery Incidence, data from World Bank Group. https://nationsinquiry.com/statistics/bribery-incidence