Lloyd's Register Foundation · World Risk Poll Resilience Index
Resilience to shocks by country
How well placed do people say they are to cope with a disaster or other shock?
Of the 141 countries compared in 2023, Kuwait had the highest reading, 74, and Afghanistan had the lowest reading, 29. In the middle country the figure was 53.
Share
Part ofRisk & Resilience
Resilience to shocks · 2023
Context statistic

Highest of 141Kuwait
74012023 · values only
Who leads
The three countries at the highest end of 141 compared, the three at the other end, and the first on each continent.
 1
1Photo: Jack Versloot · CC BY 2.0, greyscale
 2
2Photo: Slaza : Sándor Laza · CC BY-SA 3.0, greyscale
 3
3Photo: Simon Koopmann derivative work: Jjtkk · CC BY-SA 2.0 de, greyscale
Lowest in 2023
Where a country sits says how it compares with the others measured, and nothing about why.
02Every measured country
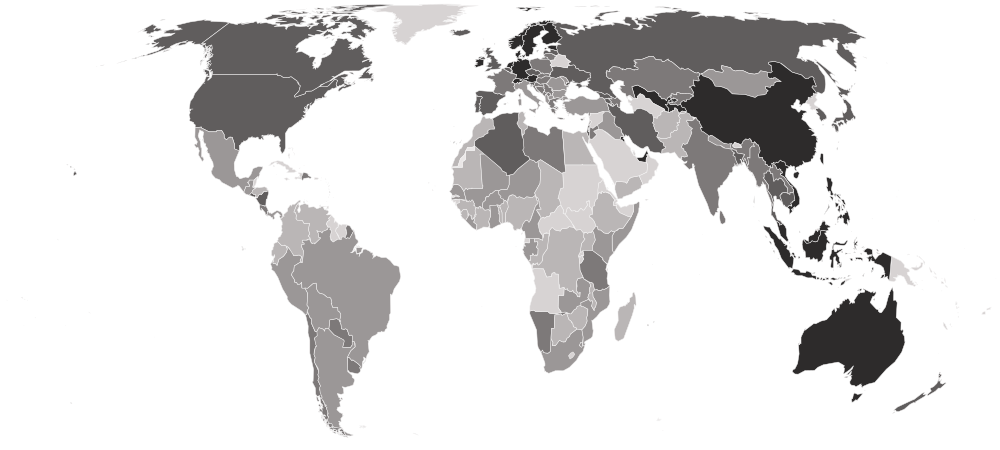
Resilience to shocks on a map
Each country is shaded by its value, in five groups holding the same number of countries. Hover a country for its value, or select it to open its profile. Below the map, each continent’s middle country.
Darker is a higher value — the better end.
- 29–45
- 46–51
- 52–56
- 57–63
- 64–74
- No reading in 2023
- Asia
57
the middle country, of 40 measured · 52 members
Kuwait74 Afghanistan29
Highest and lowest reading in Asia.
- Europe
57
the middle country, of 39 measured · 49 members
3 share 71
2 share 46
Highest and lowest reading in Europe.
- Americas
51
the middle country, of 20 measured · 48 members
2 share 63
 Ecuador42
Highest and lowest reading in Americas.
- Africa
45
the middle country, of 40 measured · 55 members
 Algeria63
 Madagascar36
Highest and lowest reading in Africa.
- Oceania
2 of 21 measured — too few for a middle: Australia, New Zealand.
 Australia64
 New Zealand63
Highest and lowest reading in Oceania.
- Every region
19 sub-regions, highest middle country first
- Western Europe
67
the middle country, of 7 measured · 9 members
 Switzerland71
 France55
Highest and lowest reading in Western Europe.
- Northern Europe
65
the middle country, of 10 measured · 13 members
2 share 71
 Lithuania56
Highest and lowest reading in Northern Europe.
- South-eastern Asia
64
the middle country, of 9 measured · 11 members
 Vietnam73
 Myanmar52
Highest and lowest reading in South-eastern Asia.
- Eastern Asia
59
the middle country, of 6 measured · 8 members
 China66
 Mongolia49
Highest and lowest reading in Eastern Asia.
- Western Asia
56
the middle country, of 14 measured · 19 members
Kuwait74 Yemen31
Highest and lowest reading in Western Asia.
- Southern Europe
53
the middle country, of 13 measured · 17 members
 Slovenia62
 North Macedonia46
Highest and lowest reading in Southern Europe.
- Eastern Europe
52
the middle country, of 9 measured · 10 members
 Czechia63
 Bulgaria46
Highest and lowest reading in Eastern Europe.
- Southern Asia
52
the middle country, of 7 measured · 9 members
 Iran58Afghanistan29
Highest and lowest reading in Southern Asia.
- Central America
51
the middle country, of 7 measured · 8 members
 El Salvador58
 Honduras45
Highest and lowest reading in Central America.
- South America
48
the middle country, of 10 measured · 12 members
 Uruguay55Ecuador42
Highest and lowest reading in South America.
- Eastern Africa
46
the middle country, of 12 measured · 19 members
 Mauritius59Madagascar36
Highest and lowest reading in Eastern Africa.
- Northern Africa
45
the middle country, of 5 measured · 6 members
Algeria63 Tunisia43
Highest and lowest reading in Northern Africa.
- Western Africa
45
the middle country, of 14 measured · 16 members
3 share 48
 Togo41
Highest and lowest reading in Western Africa.
- Middle Africa
43
the middle country, of 5 measured · 9 members
 Gabon48
 Chad40
Highest and lowest reading in Middle Africa.
- Australia and New Zealand
2 of 2 measured — too few for a middle: Australia, New Zealand.
Australia64New Zealand63Highest and lowest reading in Australia and New Zealand.
- Caribbean
1 of 24 measured — too few for a middle: Dominican Republic.
 Dominican Republic55
Highest and lowest reading in Caribbean.
- Central Asia
4 of 5 measured — too few for a middle: Kazakhstan, Kyrgyzstan, Tajikistan, Uzbekistan.
 Uzbekistan68
2 share 55
Highest and lowest reading in Central Asia.
- Northern America
2 of 4 measured — too few for a middle: Canada, United States.
2 share 63
2 share 63
Highest and lowest reading in Northern America.
- Southern Africa
4 of 5 measured — too few for a middle: Botswana, Eswatini, Namibia, South Africa.
 Namibia52
 Botswana44
Highest and lowest reading in Southern Africa.
03The whole field at once
The spread
141 countries, one dot each, on one scale — further right is a higher value. Half the countries are above 53; a quarter are above 60, and a quarter below 47. The bar in each row marks that continent’s middle country.
04All 141 ever measured
Every country
In order, highest value first. No rank or position is shown: too many countries share the same value for an order to mean anything. Scores are printed as whole numbers and each carries a margin of error of about four points, so many countries tie and neighbours a few points apart cannot be told apart. The Foundation calls 17 scores indicative because some society questions were not asked there — including the two highest — and Saudi Arabia has no score at all. It is what people report about themselves, which is why some Gulf states and Vietnam lead.
Showing 25 of 141 countries










































































































Values for 2023.
05In this edition
Resilience to shocks in records
The extremes of the statistic. A record reached by more than one country names none of them.
Highest reading
74
Resilience Index, 0–100 (higher = more reported capacity to cope with a shock; the mean of individual, household, community and societal sub-indices)
Lowest reading
29
Resilience Index, 0–100 (higher = more reported capacity to cope with a shock; the mean of individual, household, community and societal sub-indices)
06The parts of the index
Inside the number
Lloyd's Register Foundation publishes the parts the headline is built from. Each part’s highest and lowest country, and its middle value.
| Part | Highest | Lowest | Middle country |
|---|---|---|---|
| Individual sub-index (0–100)141 countries |  Sweden72 Sweden72 | Afghanistan16 | 44 |
| Household sub-index (0–100)141 countries | Vietnam79 | Madagascar28 | 54 |
| Community sub-index (0–100)141 countries |  United Arab Emirates81 United Arab Emirates81 | Afghanistan27 | 57 |
| Societal sub-index (0–100)141 countries |  Tajikistan96 Tajikistan96 | Yemen24 | 59 |
07The measure
About resilience to shocks
The World Risk Poll Resilience Index measures how well placed people say they are to cope with a shock such as a disaster, from a survey of about a thousand adults in each country carried out by Gallup for the Lloyd's Register Foundation. It averages four dimensions — the individual, the household, the community and society — each scored from 0 to 100, so a higher score means more capacity to absorb and recover.
What the number is: Resilience Index, 0–100 (higher = more reported capacity to cope with a shock; the mean of individual, household, community and societal sub-indices).
What it does not measure
It records what people say about their own agency, savings, disaster plans, neighbours and government, not the hazards a country faces or how its institutions perform when one strikes. Some countries' scores rest on incomplete society questions and are only indicative.
08Where it fits
Connections
Its part in the Country Index, the statistics whose values line up most closely with it across countries, and others on the same subject.
In the Country Index
Context, with no vote
This statistic is published in full under Risk & Resilience, but does not help decide any Country Index standing.
Moves with
Where resilience to shocks is higher, these tend to be higher too.
- Inequality-adjusted Human Development IndexUNDP Human Development Report Office · 134 countries in commonρ 0.75
- Learning-Adjusted Years of SchoolWorld Bank Group · 135 countries in commonρ 0.73
- Human Capital IndexWorld Bank Group · 135 countries in commonρ 0.73
Moves against
Where resilience to shocks is higher, these tend to be lower.
- Gender Inequality IndexUNDP Human Development Report Office · 136 countries in commonρ −0.73
- Coefficient of Human InequalityUNDP Human Development Report Office · 134 countries in commonρ −0.73
- Adolescent Birth Rate (Ages 15–19)UN DESA Population Division · 141 countries in commonρ −0.71
Rank correlation (ρ, from −1 to 1) across countries, on each statistic’s newest edition, out of 352 statistics sharing at least 80 countries with this one. Two statistics that move together do not cause each other.
09Keep reading
Explore further
The subject
The data, edition by edition
The countries at either end
10Questions
Resilience to shocks: questions and answers
Which country has the highest resilience to shocks?
Kuwait, at 74, among the 141 countries compared in 2023.
Which country has the lowest resilience to shocks?
Afghanistan, at 29, among the 141 countries compared in 2023.
How many countries does the World Risk Poll Resilience Index cover?
141 in 2023.
What is the world average resilience to shocks?
This site does not calculate a world average, which would depend on how countries are weighted. In the middle country of the 141 compared in 2023, the figure was 53.
Is this Lloyd's Register Foundation’s own ranking?
No ranking is shown. Lloyd's Register Foundation publishes values only, and too many countries share the same value for an ordering to mean anything, so none is derived.
How often is the World Risk Poll Resilience Index published?
This site holds one edition, describing 2023.
Where does the data come from, and can I download it?
From Lloyd's Register Foundation, under CC BY-SA 4.0. Read from the country table printed in Appendix ii of the Lloyd's Register Foundation's World Risk Poll 2024 report, through the Foundation's own machine-readable copy of that table in its public data repository. Only the Foundation's printed country figures are used; nothing is recalculated from the poll's individual interviews. The index uses some Gallup World Poll questions, but only the Foundation's published index and sub-indices are held here. Every edition is on this site’s Datasets pages as a full table, and downloads as a CSV file with every value unrounded.
11Method
Sources, method and citation
Source
World Risk Poll Resilience Index — Lloyd's Register Foundation
Read from the country table printed in Appendix ii of the Lloyd's Register Foundation's World Risk Poll 2024 report, through the Foundation's own machine-readable copy of that table in its public data repository. Only the Foundation's printed country figures are used; nothing is recalculated from the poll's individual interviews. The index uses some Gallup World Poll questions, but only the Foundation's published index and sub-indices are held here.
Newest edition
Report year 2024Data year 2023
Cite the source as: Lloyd's Register Foundation (2024). World Risk Poll 2024 Report: Resilience in a Changing World. London: Lloyd's Register Foundation. https://doi.org/10.60743/c0rm-h862
Licence: CC BY-SA 4.0, checked 2026-10-03.
How this page reads the numbers
- No rank or position is shown: Lloyd's Register Foundation publishes values only, and too many countries share the same value for an ordering to mean anything.
- Which end is better follows the publisher’s own reading of the measure.
- A country is named at an end only when it holds that value alone. Where several share it, the page says how many and names none first.
- Values are stored exactly as published and trimmed only for display. “The middle country” is the median of the countries measured, not a world average.
The file itself, column by column — where it came from, what each column holds, and every edition as a CSV — is on its dataset page.
Photographs
The countries at the top of this statistic, from their profiles: Wikimedia Commons, shown in greyscale, each used under the licence named.
- Kuwait — Jack Versloot, CC BY 2.0
- Vietnam — Slaza : Sándor Laza, CC BY-SA 3.0
- Switzerland — Simon Koopmann derivative work: Jjtkk, CC BY-SA 2.0 de
Cite this page
Nations Inquiry (2026). Resilience to shocks by country: World Risk Poll Resilience Index, data from Lloyd's Register Foundation. https://nationsinquiry.com/statistics/resilience-index