ILO · Unemployment Benefit Coverage
Unemployment benefit coverage by country
What share of unemployed people receive an unemployment benefit?
Of the 200 countries compared in the 2024 edition, 9 countries shared the highest reading, 100.0%, and 104 countries shared the lowest reading, 0.0%. In the middle country the figure was 0.0%.
Share
Unemployment benefit coverage · the 2024 edition
Context statistic
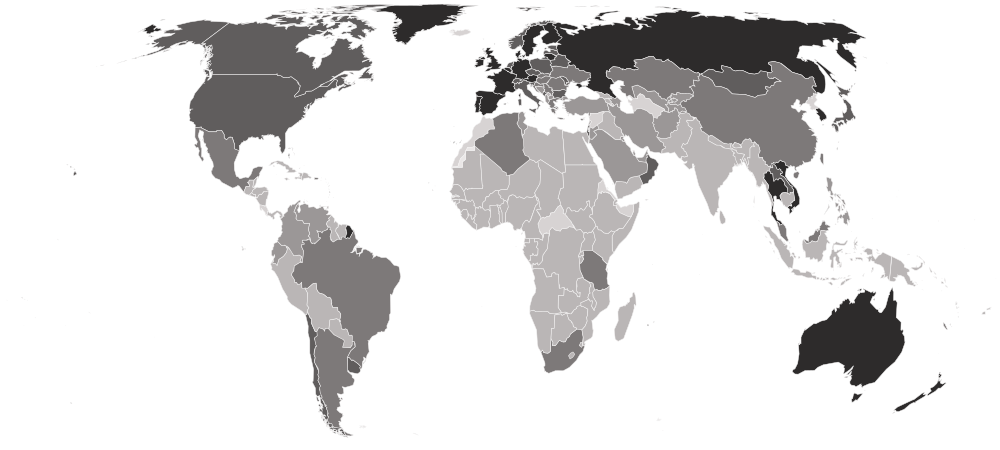
9 countries share the highest value, 100.0% — no single country is named first.
01the 2024 edition · values only
Who leads
The three countries at the highest end of 200 compared, the three at the other end, and the first on each continent.
Highest in the 2024 edition · shared
9 countries share the highest reading, 100.0%
No single country is named first: picking one from a shared value would be a choice the data does not make.
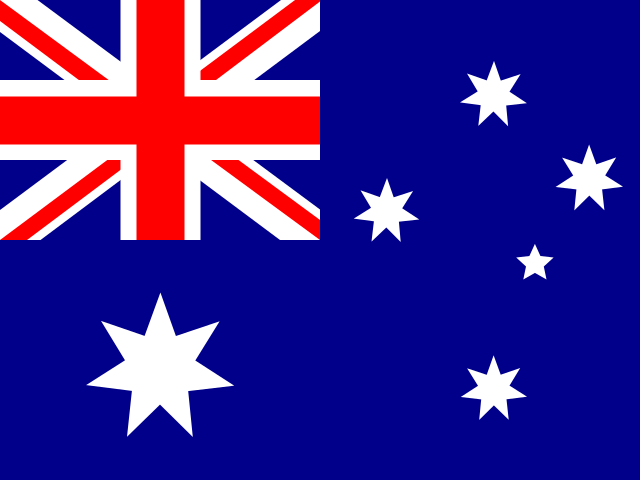

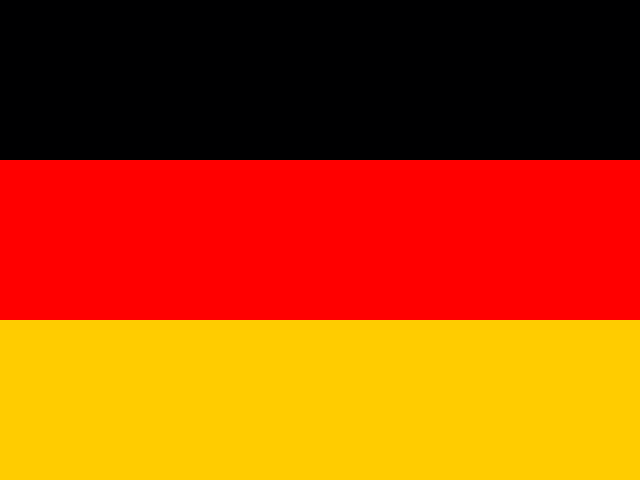
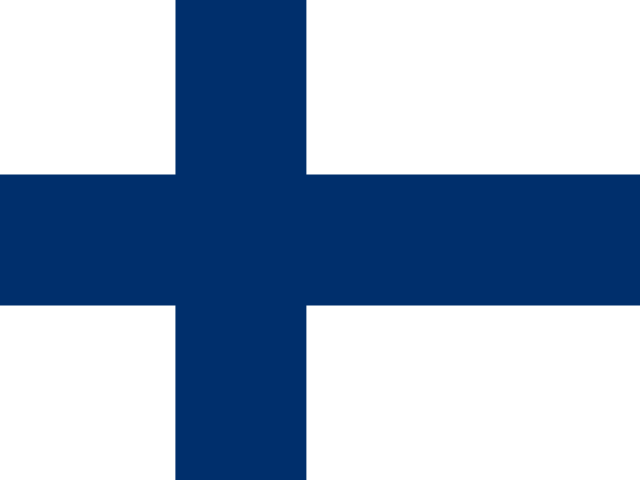


Highest on each continent
- Africa
 Seychelles18.0%
- Americas
 Greenland95.6%
- Asia
 South Korea100.0%
- Europe
6 countries share 100.0%
- Oceania
2 countries share 100.0%
- Every region
02Every measured country
Unemployment benefit coverage on a map
Each country is shaded by its value, in five groups holding the same number of countries. Hover a country for its value, or select it to open its profile. Below the map, each continent’s middle country.
Darker is a higher value — the better end.
- 0.0%
- 0.3–6.8%
- 6.9–23.2%
- 23.3–56.7%
- 57.2–100.0%
- No reading in the 2024 edition
- Europe
48.8%
the middle country, of 42 measured · 49 members
6 share 100.0%
 Kosovo0.0%
Highest and lowest reading in Europe.
- Asia
2.1%
the middle country, of 48 measured · 52 members
South Korea100.0%19 share 0.0%
Highest and lowest reading in Asia.
- Africa
0.0%
the middle country, of 51 measured · 55 members
Seychelles18.0%44 share 0.0%
Highest and lowest reading in Africa.
- Americas
0.0%
the middle country, of 43 measured · 48 members
Greenland95.6%27 share 0.0%
Highest and lowest reading in Americas.
- Oceania
0.0%
the middle country, of 16 measured · 21 members
2 share 100.0%
13 share 0.0%
Highest and lowest reading in Oceania.
- Every region
22 sub-regions, highest middle country first
- Western Europe
99.5%
the middle country, of 8 measured · 9 members
4 share 100.0%
 Switzerland55.4%
Highest and lowest reading in Western Europe.
- Northern Europe
84.1%
the middle country, of 10 measured · 13 members
2 share 100.0%
 Norway43.3%
Highest and lowest reading in Northern Europe.
- Eastern Europe
28.4%
the middle country, of 10 measured · 10 members
 Russia61.9%
 Romania9.9%
Highest and lowest reading in Eastern Europe.
- Eastern Asia
21.9%
the middle country, of 7 measured · 8 members
South Korea100.0% Macau6.8%
Highest and lowest reading in Eastern Asia.
- Southern Europe
20.8%
the middle country, of 14 measured · 17 members
 Portugal62.3%Kosovo0.0%
Highest and lowest reading in Southern Europe.
- South America
4.4%
the middle country, of 12 measured · 12 members
 Uruguay31.4%
5 share 0.0%
Highest and lowest reading in South America.
- Western Asia
1.6%
the middle country, of 17 measured · 19 members
 Bahrain46.6%
6 share 0.0%
Highest and lowest reading in Western Asia.
- Caribbean
0.0%
the middle country, of 20 measured · 24 members
 Barbados88.0%
15 share 0.0%
Highest and lowest reading in Caribbean.
- Central America
0.0%
the middle country, of 7 measured · 8 members
 Mexico8.3%
6 share 0.0%
Highest and lowest reading in Central America.
- Eastern Africa
0.0%
the middle country, of 17 measured · 19 members
Seychelles18.0%14 share 0.0%
Highest and lowest reading in Eastern Africa.
- Melanesia
0.0%
the middle country, of 5 measured · 5 members
 New Caledonia14.6%
4 share 0.0%
Highest and lowest reading in Melanesia.
- Micronesia
0.0%
the middle country, of 5 measured · 7 members
5 share 0.0%
5 share 0.0%
Highest and lowest reading in Micronesia.
- Middle Africa
0.0%
the middle country, of 8 measured · 9 members
8 share 0.0%
8 share 0.0%
Highest and lowest reading in Middle Africa.
- Northern Africa
0.0%
the middle country, of 5 measured · 6 members
 Algeria13.1%
3 share 0.0%
Highest and lowest reading in Northern Africa.
- South-eastern Asia
0.0%
the middle country, of 11 measured · 11 members
 Thailand62.8%
6 share 0.0%
Highest and lowest reading in South-eastern Asia.
- Southern Africa
0.0%
the middle country, of 5 measured · 5 members
 South Africa14.1%
4 share 0.0%
Highest and lowest reading in Southern Africa.
- Southern Asia
0.0%
the middle country, of 9 measured · 9 members
 Iran5.3%
7 share 0.0%
Highest and lowest reading in Southern Asia.
- Western Africa
0.0%
the middle country, of 16 measured · 16 members
 Cabo Verde6.0%
15 share 0.0%
Highest and lowest reading in Western Africa.
- Australia and New Zealand
2 of 2 measured — too few for a middle: Australia, New Zealand.
2 share 100.0%
2 share 100.0%
Highest and lowest reading in Australia and New Zealand.
- Central Asia
4 of 5 measured — too few for a middle: Kazakhstan, Kyrgyzstan, Tajikistan, Uzbekistan.
 Kazakhstan23.2%
 Kyrgyzstan0.3%
Highest and lowest reading in Central Asia.
- Northern America
4 of 4 measured — too few for a middle: Bermuda, Canada, Greenland, United States.
Greenland95.6% Bermuda0.0%
Highest and lowest reading in Northern America.
- Polynesia
4 of 7 measured — too few for a middle: Cook Islands, Samoa, Tonga, Tuvalu.
4 share 0.0%
4 share 0.0%
Highest and lowest reading in Polynesia.
03The whole field at once
The spread
200 countries, one dot each, on one scale — further right is a higher value. Half the countries are above 0.0%; a quarter are above 22.0%, and a quarter below 0.0%. The bar in each row marks that continent’s middle country.
04All 200 ever measured
Every country
In order, highest value first. No rank or position is shown: too many countries share the same value for an order to mean anything. In many countries the figure is exactly zero, because there is no unemployment benefit to receive — a real reading, not missing data. That is also why no position is shown: a list in which half the countries share last place orders nothing. A high figure says nothing about how many people are out of work.
Showing 25 of 200 countries
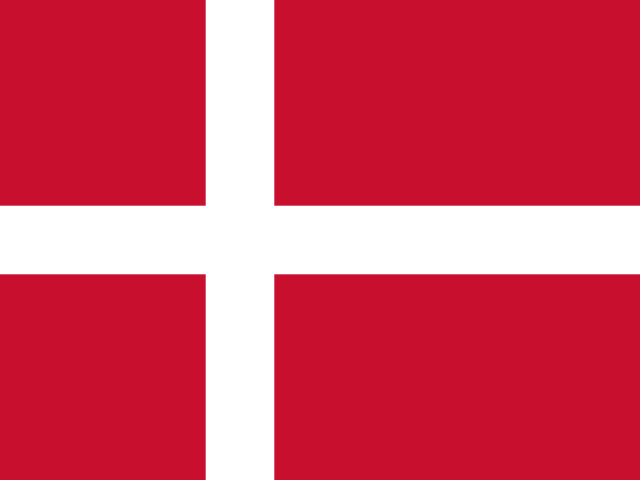
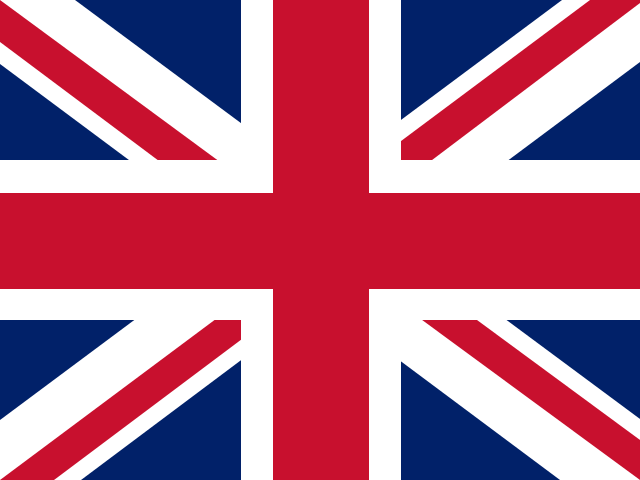

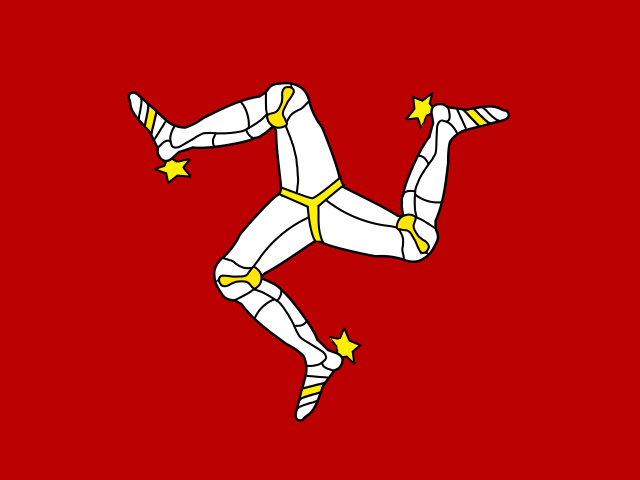
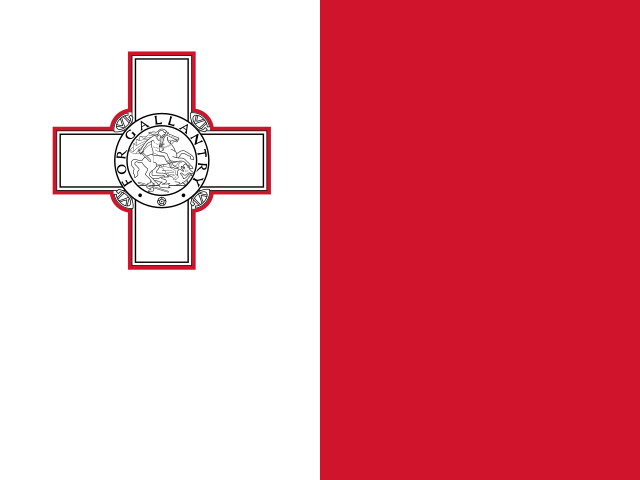





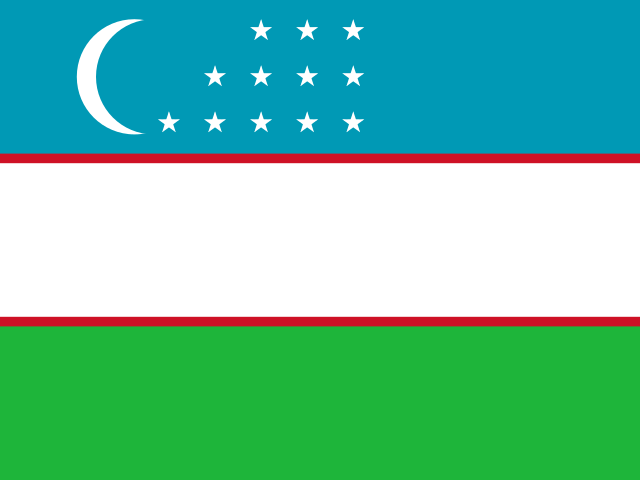
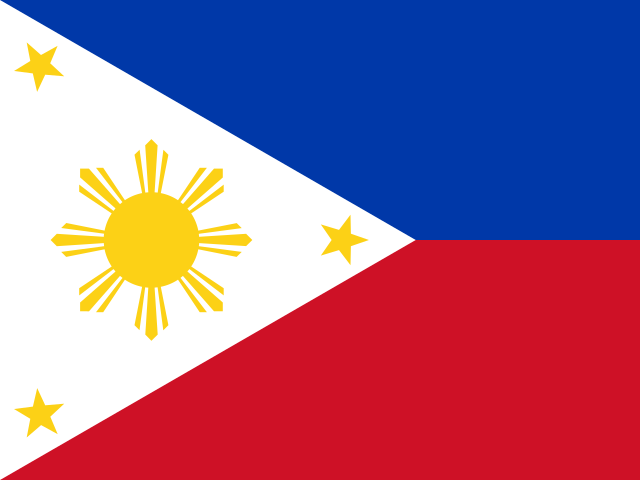
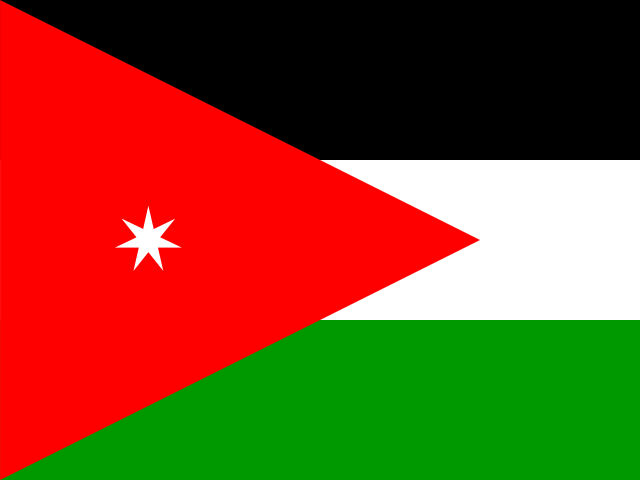
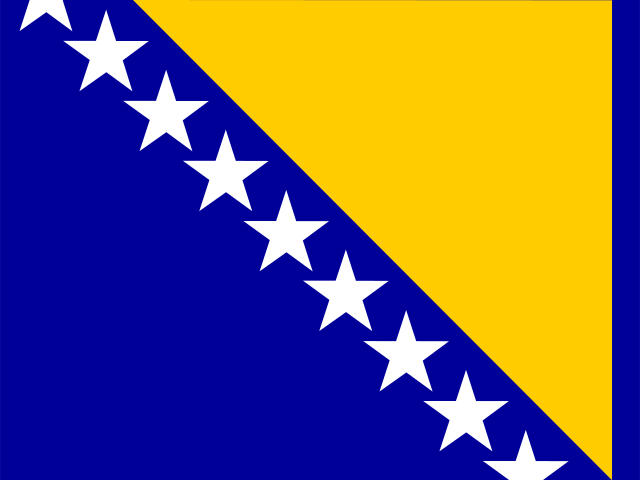






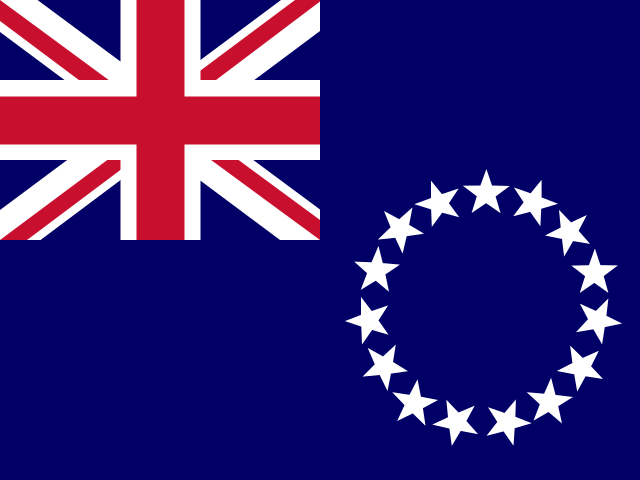



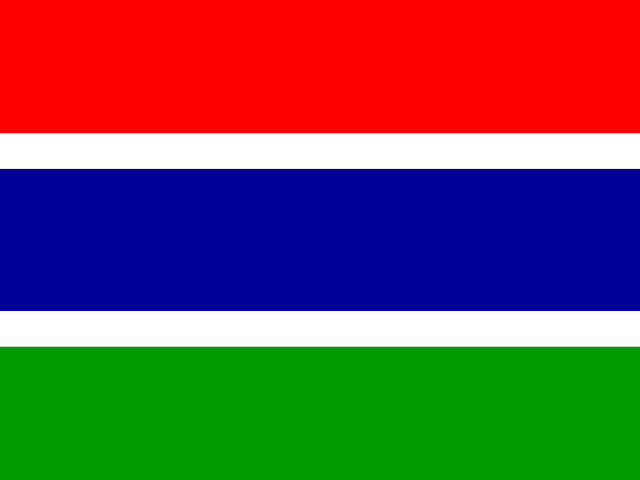
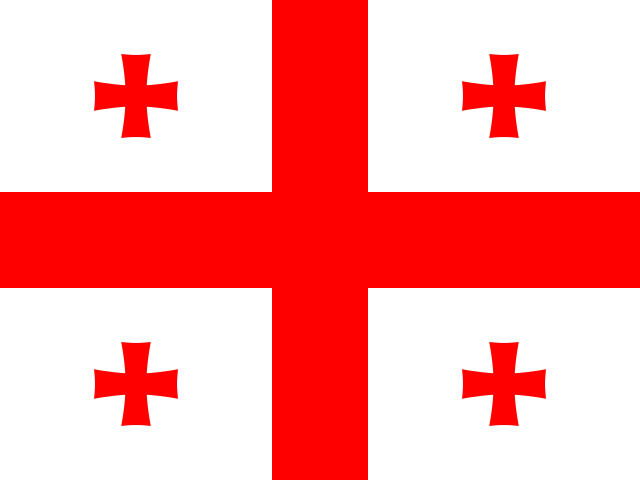
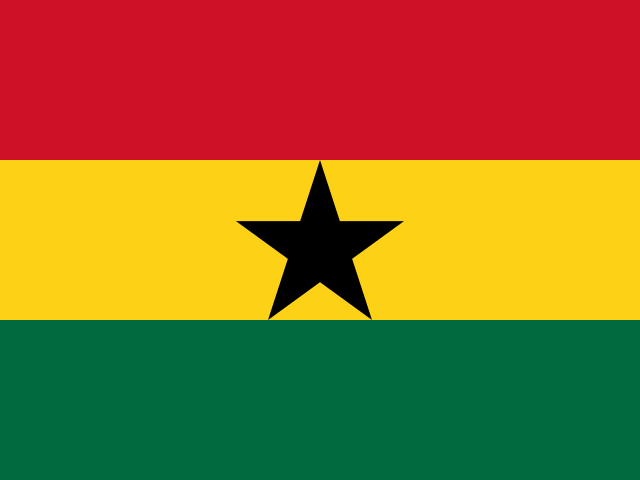
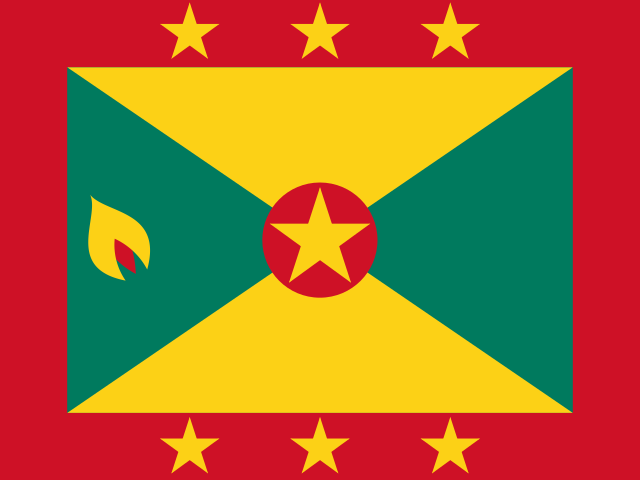



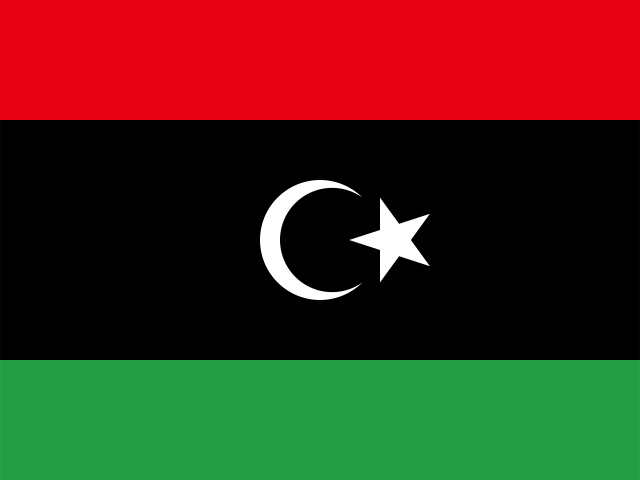
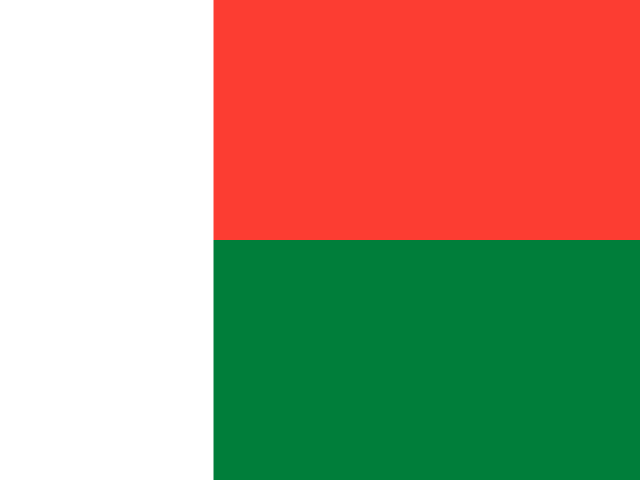

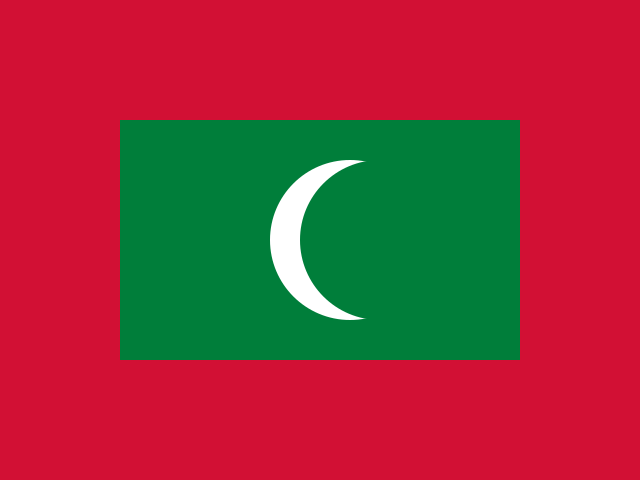
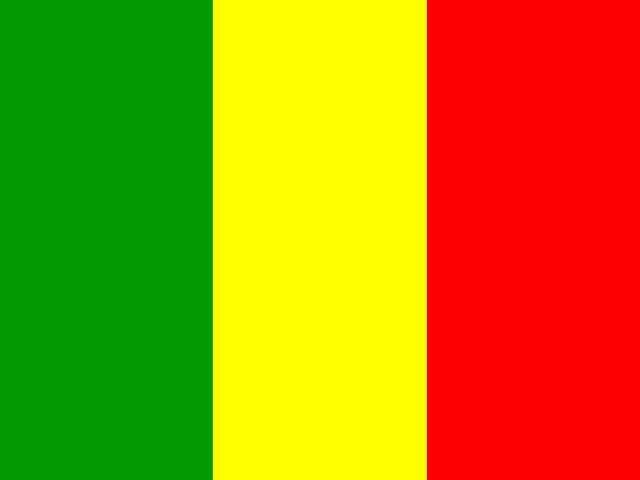









Values for the 2024 edition.
05In this edition
Unemployment benefit coverage in records
The extremes of the statistic. A record reached by more than one country names none of them.
Highest reading
Reached 9 times by 9 countries — shared, so no holder is named
100.0%
Unemployed people receiving unemployment benefits (%)
Lowest reading
Reached 104 times by 104 countries — shared, so no holder is named
0.0%
Unemployed people receiving unemployment benefits (%)
06By sex
Inside the number
International Labour Organization (ILO) also publishes separate female and male readings. The gap between them, where both exist.
Of the 140 countries with both readings, the women reading is higher in 15, the men reading in 13, and they are equal in 112. The widest gaps each way:
07The measure
About unemployment benefit coverage
This is the share of unemployed people who actually receive an unemployment benefit. It is the unemployment part of the United Nations’ measure of social protection, and it answers a question the unemployment rate cannot: when people lose work, does anything replace their income?
What the number is: Unemployed people receiving unemployment benefits (%).
Benefit records set against the unemployed
The figure divides one count by another. On top are the people receiving an unemployment cash benefit, as governments report them each year to the ILO through its Social Security Inquiry, an administrative questionnaire checked with each country’s labour ministry or social security body. Benefits funded by contributions, such as unemployment insurance, count alongside those paid out of general revenue, such as unemployment assistance. Underneath is the number of people who are unemployed. The two are counted separately — one from benefit records, the other as unemployment — so the ratio says how far a country’s schemes reach its unemployed, not which of them are paid.
Why the share moves without a law changing
Coverage can rise or fall when nothing about the benefit itself has changed, because both halves of the ratio move. Entitlements run out: people who stay out of work for longer than a scheme pays drop out of the top count while remaining in the bottom one, so a slump that leaves many people jobless for a long time can pull coverage down. A sudden wave of lay-offs among people with long contribution records can push it up. A change in a country’s figure is worth reading beside its unemployment rate before it is read as a change of policy.
Reach, not generosity
This is effective coverage — the people actually paid — which is not the same as legal coverage, the people a law would entitle. A country can promise benefits to every employee and still show a low figure if most of its unemployed worked informally, never paid contributions for long enough, or have used up their entitlement. Nor does the share say how much a benefit pays, how long it lasts or what conditions come with it: a country paying a small sum to nearly every unemployed person and one paying a generous sum to a few can read the same.
08Where it fits
Connections
Its part in the Country Index, the statistics whose values line up most closely with it across countries, and others on the same subject or from the same publisher.
In the Country Index
Context, with no vote
This statistic is published in full under Work & Labour and Development & Human Capital, but does not help decide any Country Index standing.
Work & LabourDevelopment & Human CapitalWhich statistics vote, and why
Moves with
Where unemployment benefit coverage is higher, these tend to be higher too.
- Women's Empowerment IndexUNDP Human Development Report Office and UN Women · 112 countries in commonρ 0.82
- Inequality-adjusted Human Development IndexUNDP Human Development Report Office · 165 countries in commonρ 0.80
- Human Capital IndexWorld Bank Group · 168 countries in commonρ 0.80
Moves against
Where unemployment benefit coverage is higher, these tend to be lower.
- Gender Inequality IndexUNDP Human Development Report Office · 168 countries in commonρ −0.77
- Climate Vulnerability (ND-GAIN)KeyNotre Dame Global Adaptation Initiative (ND-GAIN), University of Notre Dame · 181 countries in commonρ −0.76
- Prevalence of UndernourishmentFAO · 158 countries in commonρ −0.76
Rank correlation (ρ, from −1 to 1) across countries, on each statistic’s newest edition, out of 380 statistics sharing at least 80 countries with this one. Two statistics that move together do not cause each other.
On the same subject
09Credits
Sources and citation
Source
- Publisher
- Unemployment Benefit Coverage — International Labour Organization (ILO)The unemployment part of SDG indicator 1.3.1, from the ILO’s World Social Protection Report, read from ILOSTAT directly.
- Newest edition
- 2024, each row with its own reading year
- Licence
- CC BY 4.0, checked October 3, 2026
- Editions
- 2024
- Cite the source
- International Labour Organization. World Social Protection Report. Geneva: ILO.
Reading this page
- No rank or position is shown: ILO publishes values only, and this site has not ordered them. Ranks, positions and standings
- The file, column by column, with every edition as a CSV
Cite this page
Nations Inquiry (2026). Unemployment benefit coverage by country: Unemployment Benefit Coverage, data from International Labour Organization (ILO). https://nationsinquiry.com/statistics/unemployment-benefit-coverage