World Bank Group · Senior Management Time Spent on Government Regulation
Management time on regulation by country
How much of a manager's week goes on dealing with government regulation?
Of the 172 countries compared in the 2026 edition, Tonga had the highest reading, 31.325%, and Hong Kong had the lowest reading, 0.025%. In the middle country the figure was 6.810%. 9 readings from before 2016 are listed but not compared.
Share
Part ofGovernance & Institutions
Management time on regulation · the 2026 edition
Context statistic

Highest of 172Tonga
31.325%01the 2026 edition · values only
The highest and the lowest
The three countries with the highest values of 172 compared, the three with the lowest, and the highest on each continent. This statistic has no better end, so no country is shown as leading.
- 1
- 2

- 3

Lowest in the 2026 edition
 Hong Kong0.025%
 Kiribati0.135%
 South Korea0.227%
This statistic has no better end: the two ends describe size, not success.
02Every measured country
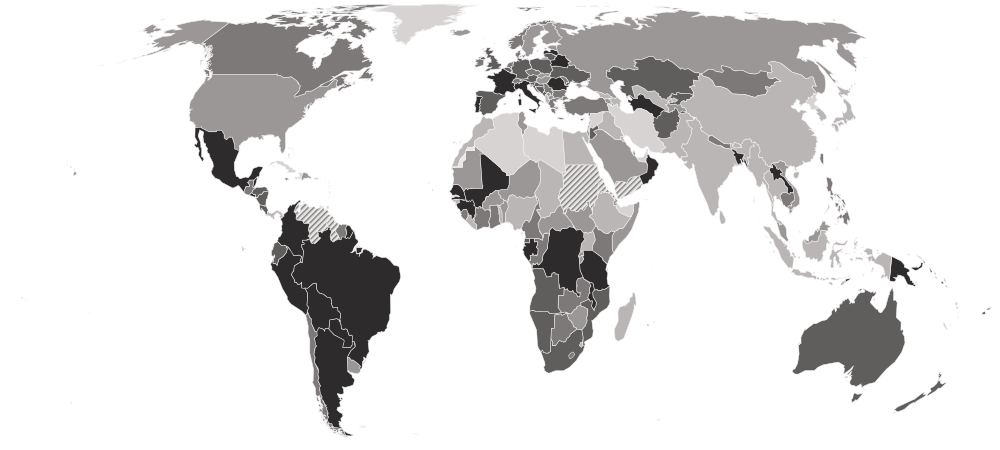
Management time on regulation on a map
Each country is shaded by its value, in five groups holding the same number of countries. Hover a country for its value, or select it to open its profile. Below the map, each continent’s middle country.
Darker is a higher value. This statistic has no better end, so the shades describe size, not success.
- 0.025–3.561%
- 3.610–5.924%
- 5.945–7.648%
- 7.797–11.104%
- 11.647–31.325%
- Hatched: a reading from before 2016, listed but not compared (9)
- No reading in the 2026 edition
- Oceania
10.421%
the middle country, of 9 measured · 21 members
Tonga31.325%Kiribati0.135%Highest and lowest reading in Oceania.
- Americas
8.247%
the middle country, of 28 measured · 48 members
 Colombia26.169%
 Grenada1.848%
Highest and lowest reading in Americas.
- Europe
7.652%
the middle country, of 40 measured · 49 members
 France15.474%
 Albania2.673%
Highest and lowest reading in Europe.
- Africa
6.081%
the middle country, of 50 measured · 55 members
Comoros30.075% Morocco0.606%
Highest and lowest reading in Africa.
- Asia
4.482%
the middle country, of 45 measured · 52 members
 Laos19.953%Hong Kong0.025%
Highest and lowest reading in Asia.
- Every region
22 sub-regions, highest middle country first
- South America
12.478%
the middle country, of 10 measured · 12 members
Colombia26.169% Uruguay5.859%
Highest and lowest reading in South America.
- Central America
10.235%
the middle country, of 8 measured · 8 members
 El Salvador20.975%
 Panama3.351%
Highest and lowest reading in Central America.
- Western Europe
9.599%
the middle country, of 7 measured · 9 members
France15.474% Switzerland5.986%
Highest and lowest reading in Western Europe.
- Southern Europe
8.810%
the middle country, of 13 measured · 17 members
 Portugal13.180%Albania2.673%
Highest and lowest reading in Southern Europe.
- Middle Africa
8.735%
the middle country, of 9 measured · 9 members
 DR Congo19.030%
 Chad1.136%
Highest and lowest reading in Middle Africa.
- Central Asia
8.391%
the middle country, of 5 measured · 5 members
 Turkmenistan13.521%
 Uzbekistan1.603%
Highest and lowest reading in Central Asia.
- Southern Africa
7.488%
the middle country, of 5 measured · 5 members
 South Africa9.739%
 Eswatini3.510%
Highest and lowest reading in Southern Africa.
- Eastern Europe
7.284%
the middle country, of 10 measured · 10 members
 Romania15.074%
 Hungary3.641%
Highest and lowest reading in Eastern Europe.
- Northern Europe
7.157%
the middle country, of 10 measured · 13 members
 Latvia13.603%
 Iceland3.610%
Highest and lowest reading in Northern Europe.
- Eastern Africa
5.861%
the middle country, of 17 measured · 19 members
Comoros30.075% Ethiopia1.874%
Highest and lowest reading in Eastern Africa.
- Western Africa
5.523%
the middle country, of 16 measured · 16 members
 Cabo Verde21.342%
 Liberia1.195%
Highest and lowest reading in Western Africa.
- Caribbean
5.196%
the middle country, of 8 measured · 24 members
 Antigua and Barbuda14.257%Grenada1.848%
Highest and lowest reading in Caribbean.
- South-eastern Asia
4.482%
the middle country, of 11 measured · 11 members
Laos19.953% Thailand0.298%
Highest and lowest reading in South-eastern Asia.
- Southern Asia
4.409%
the middle country, of 8 measured · 9 members
 Bangladesh13.298%
 Pakistan0.248%
Highest and lowest reading in Southern Asia.
- Western Asia
4.382%
the middle country, of 15 measured · 19 members
 Oman18.053%
 Azerbaijan1.056%
Highest and lowest reading in Western Asia.
- Eastern Asia
0.996%
the middle country, of 6 measured · 8 members
 Mongolia7.213%Hong Kong0.025%
Highest and lowest reading in Eastern Asia.
- Australia and New Zealand
2 of 2 measured — too few for a middle: Australia, New Zealand.
 New Zealand11.063%
 Australia8.090%
Highest and lowest reading in Australia and New Zealand.
- Melanesia
4 of 5 measured — too few for a middle: Fiji, Papua New Guinea, Solomon Islands, Vanuatu.
 Papua New Guinea13.022%
 Vanuatu8.117%
Highest and lowest reading in Melanesia.
- Micronesia
1 of 7 measured — too few for a middle: Kiribati.
Kiribati0.135%Highest and lowest reading in Micronesia.
- Northern Africa
3 of 6 measured — too few for a middle: Egypt, Morocco, Tunisia.
 Tunisia5.924%Morocco0.606%
Highest and lowest reading in Northern Africa.
- Northern America
2 of 4 measured — too few for a middle: Canada, United States.
 Canada6.905%
 United States5.754%
Highest and lowest reading in Northern America.
- Polynesia
2 of 7 measured — too few for a middle: Samoa, Tonga.
Tonga31.325% Samoa5.688%
Highest and lowest reading in Polynesia.
03The whole field at once
The spread
172 countries, one dot each, on one scale — further right is a higher value. Half the countries are above 6.810%; a quarter are above 10.218%, and a quarter below 4.194%. The bar in each row marks that continent’s middle country.
Log scale: each gridline is ten times the one before, so countries of very different sizes can be seen on one line.
04All 181 ever measured
Every country
In order, highest value first. No rank or position is shown: too many countries share the same value for an order to mean anything. A low share is not automatically a good sign: it can mean efficient rules, or rules that are not enforced, and the figure moves with neither a country's income nor any measure of how well it is governed. That is why no better end is set and no positions are shown. Survey years differ between countries — check the year beside each reading.
Showing 25 of 181 countries







































































































































Values for the 2026 edition.
05In this edition
Management time on regulation in records
The extremes of the statistic. A record reached by more than one country names none of them.
Highest reading
31.325%
Senior management time spent dealing with government regulation (% of a typical week)
Lowest reading
0.025%
Senior management time spent dealing with government regulation (% of a typical week)
06The measure
About management time on regulation
This is the share of a senior manager's working week spent dealing with government regulation — permits, inspections, taxes, labour and customs rules — as managers in the World Bank's Enterprise Surveys estimate it. It is often read as the time cost of red tape.
What the number is: Senior management time spent dealing with government regulation (% of a typical week).
07Where it fits
Connections
Its part in the Country Index, the statistics whose values line up most closely with it across countries, and others on the same subject.
In the Country Index
Context, with no vote
This statistic is published in full under Governance & Institutions, but does not help decide any Country Index standing.
Moves with
Where management time on regulation is higher, these tend to be higher too.
No statistic lines up this closely.
Moves against
Where management time on regulation is higher, these tend to be lower.
No statistic lines up this closely.
Rank correlation (ρ, from −1 to 1) across countries, on each statistic’s newest edition, out of 377 statistics sharing at least 80 countries with this one. Two statistics that move together do not cause each other.
08Keep reading
Explore further
The subject
The data, edition by edition
More from World Bank Group
09Questions
Management time on regulation: questions and answers
Which country has the highest management time on regulation?
Tonga, at 31.325%, among the 172 countries compared in the 2026 edition.
Which country has the lowest management time on regulation?
Hong Kong, at 0.025%, among the 172 countries compared in the 2026 edition.
How many countries does the Senior Management Time Spent on Government Regulation cover?
172 in the 2026 edition, and 181 at least once across all editions.
What is the world average management time on regulation?
This site does not calculate a world average, which would depend on how countries are weighted. In the middle country of the 172 compared in the 2026 edition, the figure was 6.810%.
Is this World Bank Group’s own ranking?
No ranking is shown. World Bank Group publishes values only, and too many countries share the same value for an ordering to mean anything, so none is derived.
How often is the Senior Management Time Spent on Government Regulation published?
This site holds one edition, describing 2026.
Where does the data come from, and can I download it?
From World Bank Group, under CC BY 4.0. World Bank Enterprise Surveys on Data360, read from the full-precision bulk file, one reading per country from its most recent survey. Every edition is on this site’s Datasets pages as a full table, and downloads as a CSV file with every value unrounded.
10Method
Sources, method and citation
Source
Senior Management Time Spent on Government Regulation — World Bank Group
World Bank Enterprise Surveys on Data360, read from the full-precision bulk file, one reading per country from its most recent survey.
Newest edition
Report year 2026Data year not recorded
Cite the source as: World Bank. Enterprise Surveys. Washington, DC: World Bank Group.
Licence: CC BY 4.0, checked 2026-10-03.
How this page reads the numbers
- No rank or position is shown: World Bank Group publishes values only, and too many countries share the same value for an ordering to mean anything.
- This statistic has no better end, so the page describes higher and lower values and never calls a country a leader.
- A country is named at an end only when it holds that value alone. Where several share it, the page says how many and names none first.
- The file gives each country’s most recent reading, so the rows are from different years. Readings from before 2016 are listed but left out of every comparison on this page.
- Values are stored exactly as published and trimmed only for display. “The middle country” is the median of the countries measured, not a world average.
The file itself, column by column — where it came from, what each column holds, and every edition as a CSV — is on its dataset page.
Cite this page
Nations Inquiry (2026). Management time on regulation by country: Senior Management Time Spent on Government Regulation, data from World Bank Group. https://nationsinquiry.com/statistics/management-time-regulation