World Bank Group · GDP per Person Employed
GDP per person employed by country
How much does the economy produce for each person in work?
Luxembourg placed first of the 168 countries compared in 2025, at 262,554, and Burundi last, at 2,456. In the middle country the figure was 47,384. Among the 165 countries measured in every edition since 1991, the middle one moved from 25,863 to 47,327.
Share
Part ofWork & Labour
GDP per person employed · 2025
Context statistic


Highest of 168Luxembourg
262,554012025 · position · derived
Who leads
The three countries at the highest end of 168 compared, the three at the other end, and the first on each continent.
 1
Photo: Michal Osmenda from Brussels, Belgium · CC BY-SA 2.0, greyscale
 2
Photo: derivative work: Jjtkk · CC BY-SA 2.0, greyscale
 3
Photo: Bill Cameron · CC BY-SA 3.0, greyscale
Lowest in 2025
- 168
 Burundi2,456
- 167
 Central African Republic3,180
- 166
 Madagascar3,296
Positions out of 168. Where a country sits says how it compares with the others measured, and nothing about why.
02Every measured country
GDP per person employed on a map
Each country is shaded by its value, in five groups holding the same number of countries. Hover a country for its value, or select it to open its profile. Below the map, each continent’s middle country.
Darker is a higher value — the better end.
- 2,456–14,763
- 14,821–33,517
- 34,046–58,609
- 60,717–99,046
- 100,238–262,554
- No reading in 2025 (9 measured in an earlier edition)
- Europe
101,615
the middle country, of 38 measured · 49 members
Luxembourg262,554 Moldova29,824
Highest and lowest reading in Europe.
- Asia
49,706
the middle country, of 43 measured · 52 members
 Singapore233,454
 Timor-Leste9,323
Highest and lowest reading in Asia.
- Americas
44,224
the middle country, of 29 measured · 48 members
 Guyana243,175
 Haiti7,115
Highest and lowest reading in Americas.
- Oceania
27,577
the middle country, of 8 measured · 21 members
 Australia114,582
 Solomon Islands4,519
Highest and lowest reading in Oceania.
- Africa
13,793
the middle country, of 50 measured · 55 members
 Gabon73,046Burundi2,456
Highest and lowest reading in Africa.
- Every region
21 sub-regions, highest middle country first
- Western Europe
131,259
the middle country, of 7 measured · 9 members
Luxembourg262,554 Germany125,086
Highest and lowest reading in Western Europe.
- Northern Europe
117,340
the middle country, of 10 measured · 13 members
 Ireland259,304
 Latvia80,906
Highest and lowest reading in Northern Europe.
- Eastern Asia
93,467
the middle country, of 6 measured · 8 members
 Macau204,817
 Mongolia45,908
Highest and lowest reading in Eastern Asia.
- Southern Europe
90,831
the middle country, of 12 measured · 17 members
 Italy131,481
 Albania47,604
Highest and lowest reading in Southern Europe.
- Eastern Europe
84,278
the middle country, of 9 measured · 10 members
 Romania100,238Moldova29,824
Highest and lowest reading in Eastern Europe.
- Western Asia
72,892
the middle country, of 13 measured · 19 members
 Qatar149,105
 Jordan46,257
Highest and lowest reading in Western Asia.
- Northern Africa
49,529
the middle country, of 5 measured · 6 members
 Algeria62,891
 Morocco32,242
Highest and lowest reading in Northern Africa.
- Southern Africa
47,440
the middle country, of 5 measured · 5 members
 Botswana50,029
 Lesotho8,639
Highest and lowest reading in Southern Africa.
- Caribbean
46,062
the middle country, of 8 measured · 24 members
 Puerto Rico124,954Haiti7,115
Highest and lowest reading in Caribbean.
- South America
41,840
the middle country, of 11 measured · 12 members
Guyana243,175 Bolivia20,435
Highest and lowest reading in South America.
- Central America
32,313
the middle country, of 8 measured · 8 members
 Panama81,808
 Nicaragua17,638
Highest and lowest reading in Central America.
- Central Asia
30,845
the middle country, of 5 measured · 5 members
 Kazakhstan82,765
 Kyrgyzstan20,907
Highest and lowest reading in Central Asia.
- Southern Asia
29,179
the middle country, of 8 measured · 9 members
 Iran57,468
 Pakistan17,800
Highest and lowest reading in Southern Asia.
- South-eastern Asia
27,957
the middle country, of 11 measured · 11 members
Singapore233,454Timor-Leste9,323Highest and lowest reading in South-eastern Asia.
- Middle Africa
18,979
the middle country, of 9 measured · 9 members
Gabon73,046Central African Republic3,180Highest and lowest reading in Middle Africa.
- Western Africa
11,082
the middle country, of 16 measured · 16 members
 Mauritania31,135
 Liberia3,737
Highest and lowest reading in Western Africa.
- Eastern Africa
9,575
the middle country, of 15 measured · 19 members
 Mauritius60,930Burundi2,456
Highest and lowest reading in Eastern Africa.
- Australia and New Zealand
2 of 2 measured — too few for a middle: Australia, New Zealand.
Australia114,582 New Zealand87,948
Highest and lowest reading in Australia and New Zealand.
- Melanesia
4 of 5 measured — too few for a middle: Fiji, Papua New Guinea, Solomon Islands, Vanuatu.
 Fiji35,266Solomon Islands4,519
Highest and lowest reading in Melanesia.
- Northern America
2 of 4 measured — too few for a middle: Canada, United States.
 United States156,983
 Canada113,563
Highest and lowest reading in Northern America.
- Polynesia
2 of 7 measured — too few for a middle: Samoa, Tonga.
 Samoa31,817
 Tonga23,337
Highest and lowest reading in Polynesia.
03The whole field at once
The spread
168 countries, one dot each, on one scale — further right is a higher value. Half the countries are above 47,384; a quarter are above 87,086, and a quarter below 19,269. The bar in each row marks that continent’s middle country.
04All 177 ever measured
Every country
In order, highest value first. “=” marks a position shared with another country. World Bank Group ranks nobody on this measure; the position is derived here by ordering the published values. This divides output by the people working, where GDP per capita divides it by everybody — so a country with few people in work can rank higher here than its living standards suggest. It is also per worker rather than per hour, which flatters countries with long working weeks.
Showing 25 of 177 countries


































































































































Values for 2025. The change column compares 2025 with 2024 only; the sparkline covers the recent editions.
051991–2025 · 35 reference years
Over time
Each point is one year from 1991, at constant prices, so the line shows real productivity growth rather than inflation.
- the middle country
- the middle half of countries
- the middle of the 165 countries measured every time
- each continent’s middle country
The same, year by year
| Year | Countries | Middle country | Middle half | Measured every time |
|---|---|---|---|---|
| 2025 | 168 | 47,384 | 19,269 – 87,086 | 47,327 |
| 2024 | 171 | 45,524 | 18,951 – 86,129 | 45,304 |
| 2023 | 172 | 43,771 | 18,312 – 83,135 | 43,618 |
| 2022 | 176 | 42,983 | 18,065 – 87,098 | 42,990 |
| 2021 | 177 | 42,347 | 17,907 – 83,953 | 43,721 |
| 2020 | 177 | 39,107 | 17,237 – 79,272 | 39,107 |
| 2019 | 177 | 42,385 | 17,420 – 81,204 | 42,385 |
| 2018 | 177 | 40,288 | 17,413 – 77,897 | 40,288 |
| 2017 | 177 | 40,207 | 16,806 – 75,864 | 40,207 |
| 2016 | 177 | 40,291 | 15,772 – 74,789 | 40,291 |
| 2015 | 177 | 40,241 | 15,563 – 76,336 | 40,241 |
| 2014 | 177 | 41,621 | 15,080 – 75,606 | 41,621 |
| 2013 | 177 | 40,103 | 14,456 – 74,392 | 38,494 |
| 2012 | 176 | 40,028 | 14,259 – 75,352 | 37,135 |
| 2011 | 176 | 39,623 | 13,587 – 71,623 | 37,566 |
| 2010 | 176 | 38,903 | 13,302 – 72,254 | 37,868 |
| 2009 | 176 | 36,886 | 13,032 – 70,296 | 35,999 |
| 2008 | 176 | 37,396 | 12,407 – 73,008 | 36,176 |
| 2007 | 176 | 37,103 | 12,020 – 73,516 | 36,465 |
| 2006 | 176 | 35,390 | 12,043 – 70,618 | 34,900 |
| 2005 | 176 | 34,574 | 11,789 – 69,247 | 32,731 |
| 2004 | 176 | 33,190 | 11,719 – 66,709 | 31,522 |
| 2003 | 176 | 31,365 | 11,484 – 64,459 | 29,672 |
| 2002 | 176 | 30,736 | 11,139 – 61,812 | 28,089 |
| 2001 | 175 | 28,833 | 11,369 – 58,198 | 27,740 |
| 2000 | 175 | 28,458 | 11,201 – 58,408 | 28,458 |
| 1999 | 174 | 27,553 | 11,070 – 56,952 | 26,793 |
| 1998 | 174 | 27,258 | 10,705 – 57,696 | 26,623 |
| 1997 | 174 | 27,095 | 10,240 – 54,924 | 26,099 |
| 1996 | 173 | 25,846 | 9,686 – 53,641 | 25,846 |
| 1995 | 173 | 25,442 | 9,464 – 55,923 | 25,442 |
| 1994 | 172 | 24,970 | 9,136 – 53,227 | 24,735 |
| 1993 | 171 | 26,103 | 9,534 – 53,020 | 25,188 |
| 1992 | 171 | 24,874 | 9,996 – 51,185 | 24,605 |
| 1991 | 171 | 25,985 | 10,955 – 52,296 | 25,863 |
062024 → 2025
Who rose and fell
The biggest changes in value between the two newest editions — reference years recalculated in one report, not two separate publications. Places are shown second, because they also move when other countries do.
Improved most
before → after- Guyana204,862 → 243,175 · 4th → 3rd+38,312
- Ireland234,509 → 259,304 · 2nd → 2nd+24,795
- Macau194,417 → 204,817 · 5th → 5th+10,400
- Singapore226,352 → 233,454 · 3rd → 4th+7,102
- Kazakhstan75,824 → 82,765 · 51st → 46th+6,941
Declined most
before → after Equatorial Guinea42,814 → 39,505 · 92nd → 97th−3,309
 Iraq57,002 → 54,291 · 71st → 72nd−2,710
- Iran59,472 → 57,468 · 66th → 69th−2,004
 Oman73,789 → 72,192 · 53rd → 54th−1,597
- Qatar150,468 → 149,105 · 10th → 10th−1,364
168 countries were measured in both 2024 and 2025. The field changed from 171 to 168 countries, so a place can move for reasons that have nothing to do with the country itself.
07Across every edition
GDP per person employed in records
The extremes of the statistic. A record reached by more than one country names none of them.
Highest reading on record
320,336
GDP per person employed (constant 2021 international $)
Lowest reading on record
1,151
GDP per person employed (constant 2021 international $)
Biggest improvement between editions
+76,048
107,509 → 183,557
Biggest decline between editions
−122,452
226,560 → 104,108
Most improved since first measured
+226,914
16,261 → 243,175
At the top most often
27 of 35
editions, alone at the first-listed end
08The measure
About GDP per person employed
GDP per person employed is how much a country’s economy produces for each person working in it — labour productivity, converted at purchasing power parities so countries can be compared. It is the closest thing there is to a ceiling on what a country’s wages can be.
What the number is: GDP per person employed (constant 2021 international $).
09Where it fits
Connections
Its part in the Country Index, the statistics whose values line up most closely with it across countries, and others on the same subject.
In the Country Index
Context, with no vote
This statistic is published in full under Work & Labour, but does not help decide any Country Index standing.
Moves with
Where GDP per person employed is higher, these tend to be higher too.
- Labour Productivity per Hour WorkedILO · 168 countries in commonρ 0.99
- GDP per Capita (PPP)KeyWorld Bank Group · 168 countries in commonρ 0.98
- Historical GDP per Capita (Maddison)GGDC · 152 countries in commonρ 0.97
Moves against
Where GDP per person employed is higher, these tend to be lower.
- Vulnerable EmploymentKeyILO · 168 countries in commonρ −0.90
- Self-Employment RateILO · 168 countries in commonρ −0.89
- Employment in AgricultureILO · 168 countries in commonρ −0.89
Rank correlation (ρ, from −1 to 1) across countries, on each statistic’s newest edition, out of 377 statistics sharing at least 80 countries with this one. Two statistics that move together do not cause each other.
10Analysis
Charts and analysis on GDP per person employed
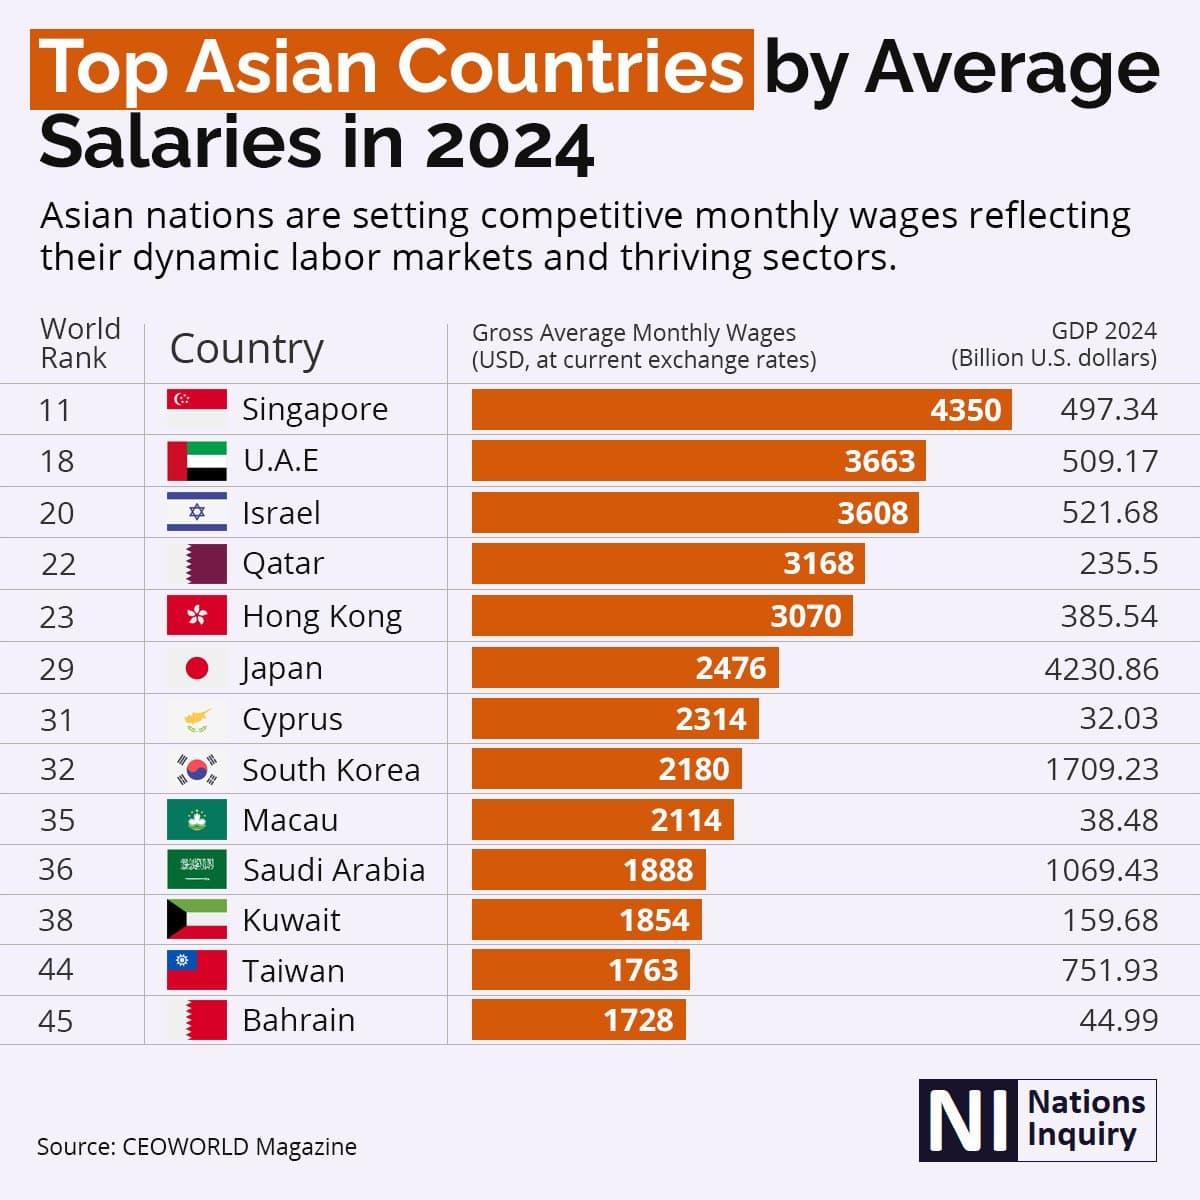
Countries in Asia with the highest average salaries 2024
Thirteen Asian countries by gross average monthly wage, each carrying its WORLD rank rather than an Asian one — so the numbers skip, from 11th place to 45th.

Countries With The Highest Average Salaries in 2024
The ten highest-paying countries of 2024, their bars coloured by continent, and six more added for comparison — from Australia in 13th place to India in 85th.

Countries With The Lowest Average Salaries in 2024
The bottom ten of 196 countries, and six more added for comparison. Niger, Madagascar and Liberia are all published at US$47 a month and still carry three different ranks.
11Keep reading
Explore further
The subject
The countries at either end
More from World Bank Group
12Questions
GDP per person employed: questions and answers
Which country has the highest GDP per person employed?
Luxembourg, at 262,554, among the 168 countries compared in 2025.
Which country has the lowest GDP per person employed?
Burundi, at 2,456, among the 168 countries compared in 2025.
How many countries does the GDP per Person Employed cover?
168 in 2025, and 177 at least once across all editions. The number measured varies from 168 to 177 between editions.
What is the world average GDP per person employed?
This site does not calculate a world average, which would depend on how countries are weighted. In the middle country of the 168 compared in 2025, the figure was 47,384.
Is this World Bank Group’s own ranking?
No. World Bank Group publishes the values but ranks nobody; the position on this page is derived by Nations Inquiry by ordering the published values, and equal values share a position.
How often is the GDP per Person Employed published?
This site holds 35 reference years, 1991–2025, all recalculated in World Bank Group’s 2026 report on one method — not 35 separate publications.
Where does the data come from, and can I download it?
From World Bank Group, under CC BY 4.0. World Bank staff estimates, published via its indicator API (SL.GDP.PCAP.EM.KD), built from employment, population and GDP data. Every edition is on this site’s Datasets pages as a full table, and downloads as a CSV file with every value unrounded.
13Method
Sources, method and citation
Source
GDP per Person Employed — World Bank Group
World Bank staff estimates, published via its indicator API (SL.GDP.PCAP.EM.KD), built from employment, population and GDP data.
Newest edition
Report year 2025Data year 2025
Cite the source as: World Bank. World Development Indicators. Washington, DC: World Bank Group.
Licence: CC BY 4.0, checked 2026-09-10.
How this page reads the numbers
- World Bank Group ranks nobody on this measure. The position is derived by Nations Inquiry by ordering the published values; equal values share a position.
- Which end is better follows the publisher’s own reading of the measure.
- A country is named at an end only when it holds that value alone. Where several share it, the page says how many and names none first.
- Values are stored exactly as published and trimmed only for display. “The middle country” is the median of the countries measured, not a world average.
The file itself, column by column — where it came from, what each column holds, and every edition as a CSV — is on its dataset page.
Photographs
The countries at the top of this statistic, from their profiles: Wikimedia Commons, shown in greyscale, each used under the licence named.
- Luxembourg — Michal Osmenda from Brussels, Belgium, CC BY-SA 2.0
- Ireland — derivative work: Jjtkk, CC BY-SA 2.0
- Guyana — Bill Cameron, CC BY-SA 3.0
Cite this page
Nations Inquiry (2026). GDP per person employed by country: GDP per Person Employed, data from World Bank Group. https://nationsinquiry.com/statistics/gdp-per-worker