Loading…
World Bank Group · GDP Growth
GDP growth by country
How fast did the economy grow in real terms?
Guyana placed first of the 186 countries compared in 2025, at 19.3360, and Equatorial Guinea last, at -5.8468. In the middle country the figure was 3.3961. Among the 104 countries measured in every edition since 1961, the middle one moved from 4.8791 to 3.0736.
Part ofEconomy & Innovation
GDP growth · 2025
Context statistic

Highest of 186Guyana
19.3360012025 · position · derived
Who leads
The three countries at the highest end of 186 compared, the three at the other end, and the first on each continent.
 1
1Photo: Bill Cameron · CC BY-SA 3.0, greyscale
 2
2Photo: Maher A. A. Abdussalam · CC0, greyscale
 3
3Photo: derivative work: Jjtkk · CC BY-SA 2.0, greyscale
Lowest in 2025
- 186
 Equatorial Guinea-5.8468
 - 185
 Iran-2.8260
 - 184
 Haiti-2.7129
Positions out of 186. Where a country sits says how it compares with the others measured, and nothing about why.
02Every measured country
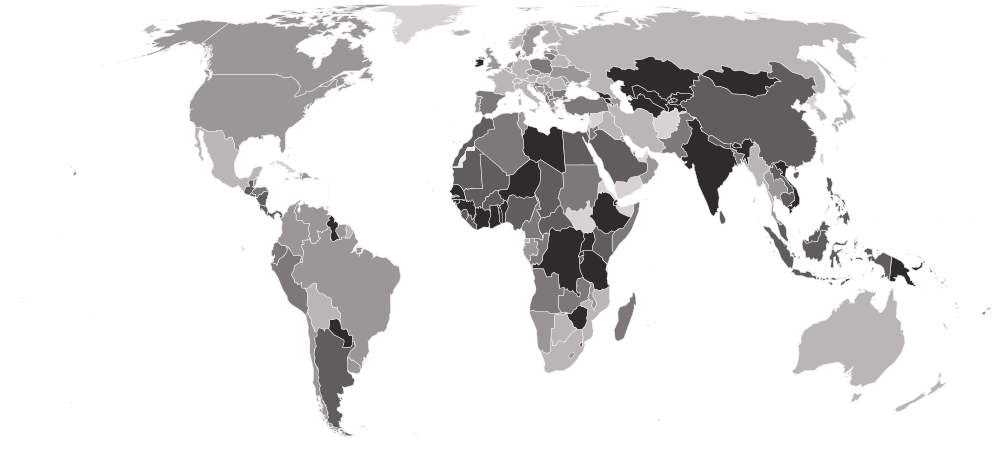
GDP growth on a map
Each country is shaded by its value, in five groups holding the same number of countries. Hover a country for its value, or select it to open its profile. Below the map, each continent’s middle country.
Darker is a higher value — the better end.
- -5.8468–1.3504
- 1.3884–2.8000
- 2.8250–3.8155
- 3.8680–5.5995
- 5.6379–19.3360
- No reading in 2025 (28 measured in an earlier edition)
- Africa
4.5474
the middle country, of 52 measured · 55 members
 Libya13.3717Equatorial Guinea-5.8468
Highest and lowest reading in Africa.
- Asia
4.4666
the middle country, of 44 measured · 52 members
 Kyrgyzstan11.0960Iran-2.8260
Highest and lowest reading in Asia.
- Oceania
2.9268
the middle country, of 14 measured · 21 members
 Palau6.2864
 New Zealand0.4629
Highest and lowest reading in Oceania.
- Americas
2.7000
the middle country, of 35 measured · 48 members
Guyana19.3360Haiti-2.7129Highest and lowest reading in Americas.
- Europe
1.8215
the middle country, of 41 measured · 49 members
 Ireland12.3376
 Finland0.1734
Highest and lowest reading in Europe.
- Every region
22 sub-regions, highest middle country first
- Central Asia
7.6996
the middle country, of 5 measured · 5 members
Kyrgyzstan11.0960 Turkmenistan6.3000
Highest and lowest reading in Central Asia.
- Western Africa
5.9238
the middle country, of 16 measured · 16 members
 Benin8.0741
 Nigeria4.0134
Highest and lowest reading in Western Africa.
- South-eastern Asia
5.0259
the middle country, of 11 measured · 11 members
 Vietnam8.0188
 Myanmar-2.0118
Highest and lowest reading in South-eastern Asia.
- Southern Asia
4.6921
the middle country, of 8 measured · 9 members
 Bhutan8.0050Iran-2.8260
Highest and lowest reading in Southern Asia.
- Eastern Africa
4.4364
the middle country, of 16 measured · 19 members
 Ethiopia9.7715
 Mozambique-0.5235
Highest and lowest reading in Eastern Africa.
- Northern Africa
4.1038
the middle country, of 6 measured · 6 members
Libya13.3717 Tunisia2.4931
Highest and lowest reading in Northern Africa.
- Central America
4.0930
the middle country, of 8 measured · 8 members
 Nicaragua4.9235
 Mexico0.5617
Highest and lowest reading in Central America.
- Eastern Asia
4.0794
the middle country, of 6 measured · 8 members
 Mongolia6.8439
 South Korea1.0070
Highest and lowest reading in Eastern Asia.
- Western Asia
3.2063
the middle country, of 14 measured · 19 members
 Georgia7.4616
 Iraq-2.1557
Highest and lowest reading in Western Asia.
- Middle Africa
3.1335
the middle country, of 9 measured · 9 members
 DR Congo5.7592Equatorial Guinea-5.8468
Highest and lowest reading in Middle Africa.
- Southern Europe
2.7848
the middle country, of 14 measured · 17 members
 Malta3.9616
 Italy0.5396
Highest and lowest reading in Southern Europe.
- Caribbean
2.6886
the middle country, of 13 measured · 24 members
 Antigua and Barbuda4.9980Haiti-2.7129
Highest and lowest reading in Caribbean.
- South America
2.5506
the middle country, of 12 measured · 12 members
Guyana19.3360 Bolivia-1.5824
Highest and lowest reading in South America.
- Micronesia
2.2831
the middle country, of 5 measured · 7 members
Palau6.2864 Micronesia1.0626
Highest and lowest reading in Micronesia.
- Southern Africa
1.7302
the middle country, of 5 measured · 5 members
 Eswatini4.1939
 Botswana-0.7339
Highest and lowest reading in Southern Africa.
- Eastern Europe
1.5608
the middle country, of 10 measured · 10 members
 Poland3.5727
 Hungary0.5095
Highest and lowest reading in Eastern Europe.
- Northern Europe
1.4658
the middle country, of 10 measured · 13 members
Ireland12.3376Finland0.1734Highest and lowest reading in Northern Europe.
- Western Europe
0.8409
the middle country, of 7 measured · 9 members
 Netherlands1.7846
 Germany0.2396
Highest and lowest reading in Western Europe.
- Australia and New Zealand
2 of 2 measured — too few for a middle: Australia, New Zealand.
 Australia1.3504New Zealand0.4629
Highest and lowest reading in Australia and New Zealand.
- Melanesia
4 of 5 measured — too few for a middle: Fiji, Papua New Guinea, Solomon Islands, Vanuatu.
 Papua New Guinea5.6379
 Vanuatu3.0536
Highest and lowest reading in Melanesia.
- Northern America
2 of 4 measured — too few for a middle: Canada, United States.
 United States2.1614
 Canada1.7427
Highest and lowest reading in Northern America.
- Polynesia
3 of 7 measured — too few for a middle: Samoa, Tonga, Tuvalu.
 Samoa4.2044
 Tuvalu1.6393
Highest and lowest reading in Polynesia.
03The whole field at once
The spread
186 countries, one dot each, on one scale — further right is a higher value. Half the countries are above 3.3961; a quarter are above 4.9583, and a quarter below 1.7865. The bar in each row marks that continent’s middle country.
04All 214 ever measured
Every country
In order, highest value first. “=” marks a position shared with another country. World Bank Group ranks nobody on this measure; the position is derived here by ordering the published values. This is a rate, not a level, and that is the thing to hold on to: the top of any year’s list is usually a small economy rebounding from a bad year or opening an oil field, not a rich country. Equatorial Guinea’s 150% in 1997 and Iraq’s −64% in 1991 are both real, and both say more about the year before than about the country.
Showing 25 of 214 countries





































































































































































Values for 2025. The change column compares 2025 with 2024 only; the sparkline covers the recent editions.
051961–2025 · 65 reference years
Over time
Each point is one year from 1961. A single year tells you almost nothing; the shape of a decade tells you a great deal.
- the middle country
- the middle half of countries
- the middle of the 104 countries measured every time
- each continent’s middle country
The same, year by year
| Year | Countries | Middle country | Middle half | Measured every time |
|---|---|---|---|---|
| 2025 | 186 | 3.3961 | 1.7865 – 4.9583 | 3.0736 |
| 2024 | 200 | 3.3829 | 1.6630 – 4.8559 | 3.3371 |
| 2023 | 204 | 3.1727 | 1.1878 – 4.9858 | 2.7848 |
| 2022 | 209 | 4.2530 | 2.4653 – 6.3703 | 4.4594 |
| 2021 | 210 | 5.1060 | 3.0923 – 8.0362 | 5.7795 |
| 2020 | 210 | -3.8364 | -8.3090 – -1.1817 | -3.8364 |
| 2019 | 210 | 2.7475 | 1.2207 – 4.9131 | 2.3188 |
| 2018 | 211 | 3.1492 | 1.5443 – 4.8431 | 3.1993 |
| 2017 | 210 | 3.3090 | 1.5526 – 4.8195 | 3.4591 |
| 2016 | 210 | 3.0830 | 1.4579 – 4.7370 | 3.3317 |
| 2015 | 211 | 2.9203 | 1.1306 – 4.4698 | 2.9565 |
| 2014 | 210 | 3.1327 | 1.4497 – 5.0049 | 3.6945 |
| 2013 | 209 | 3.2561 | 1.1377 – 5.3151 | 3.3829 |
| 2012 | 209 | 3.0111 | 0.2158 – 5.7832 | 3.9777 |
| 2011 | 210 | 3.7697 | 1.4468 – 6.2217 | 3.7968 |
| 2010 | 210 | 4.1094 | 1.5622 – 6.4808 | 4.9993 |
| 2009 | 209 | -0.0403 | -4.1667 – 3.5389 | 0.1291 |
| 2008 | 206 | 3.7463 | 0.9939 – 6.2938 | 3.2601 |
| 2007 | 205 | 5.4216 | 3.1000 – 7.6333 | 5.1098 |
| 2006 | 204 | 5.4139 | 3.4699 – 7.5956 | 5.1193 |
| 2005 | 204 | 4.7400 | 2.6797 – 7.0361 | 4.3314 |
| 2004 | 204 | 5.0152 | 3.0984 – 7.0651 | 4.6660 |
| 2003 | 204 | 3.9419 | 1.5327 – 6.5426 | 3.3310 |
| 2002 | 200 | 3.4302 | 1.0457 – 5.3543 | 3.0264 |
| 2001 | 200 | 3.0569 | 1.2198 – 5.1923 | 2.6701 |
| 2000 | 199 | 4.1484 | 2.4822 – 5.9198 | 4.1197 |
| 1999 | 199 | 3.3000 | 0.7704 – 5.1516 | 3.2442 |
| 1998 | 199 | 3.7742 | 1.8565 – 5.5531 | 3.7330 |
| 1997 | 197 | 4.4009 | 2.2372 – 6.3977 | 4.3825 |
| 1996 | 197 | 4.2235 | 1.7317 – 6.6049 | 4.2528 |
| 1995 | 196 | 4.1098 | 2.1222 – 6.3945 | 3.9880 |
| 1994 | 195 | 3.6279 | 0.9788 – 5.8617 | 3.6703 |
| 1993 | 195 | 2.1898 | -0.9675 – 5.3326 | 2.6576 |
| 1992 | 194 | 1.9148 | -2.9762 – 6.4676 | 2.0582 |
| 1991 | 194 | 1.8568 | -1.1460 – 5.1062 | 2.6030 |
| 1990 | 176 | 3.4131 | -0.2517 – 5.6733 | 3.3394 |
| 1989 | 175 | 3.7677 | 0.8467 – 5.8046 | 3.7773 |
| 1988 | 174 | 4.8924 | 1.7319 – 7.5366 | 4.3494 |
| 1987 | 171 | 3.4546 | 1.1628 – 6.3445 | 2.9812 |
| 1986 | 169 | 3.5678 | 1.0082 – 5.5997 | 3.4637 |
| 1985 | 168 | 3.0915 | 0.7296 – 5.2386 | 3.1023 |
| 1984 | 165 | 3.8207 | 0.4967 – 5.7524 | 3.7145 |
| 1983 | 165 | 1.9091 | -1.9667 – 4.5838 | 1.4921 |
| 1982 | 163 | 1.8108 | -1.1114 – 3.7389 | 2.0068 |
| 1981 | 161 | 3.3219 | -0.1325 – 6.0062 | 3.3338 |
| 1980 | 152 | 2.6697 | -0.5610 – 6.6494 | 2.9261 |
| 1979 | 151 | 4.3512 | 2.1273 – 7.4242 | 4.3737 |
| 1978 | 151 | 5.2719 | 1.8075 – 7.9738 | 4.9234 |
| 1977 | 146 | 4.0498 | 1.4364 – 7.7148 | 4.2744 |
| 1976 | 145 | 5.4280 | 1.6645 – 8.7784 | 5.4103 |
| 1975 | 143 | 2.1001 | -0.6499 – 6.0919 | 2.2117 |
| 1974 | 142 | 5.3392 | 2.8961 – 7.8399 | 5.1521 |
| 1973 | 142 | 5.3785 | 1.9009 – 7.7813 | 5.6166 |
| 1972 | 142 | 4.9222 | 1.9147 – 7.9095 | 5.2899 |
| 1971 | 142 | 4.4538 | 2.3217 – 6.8614 | 4.4538 |
| 1970 | 119 | 5.6199 | 3.0115 – 8.6499 | 5.6639 |
| 1969 | 119 | 5.8647 | 3.4609 – 8.4373 | 5.9443 |
| 1968 | 119 | 5.1804 | 2.7898 – 7.9803 | 5.0666 |
| 1967 | 118 | 4.4911 | 2.0610 – 6.9561 | 4.4911 |
| 1966 | 115 | 4.7708 | 1.6337 – 7.4496 | 4.6929 |
| 1965 | 112 | 5.0874 | 2.2650 – 8.1839 | 5.0874 |
| 1964 | 112 | 6.0113 | 3.8091 – 8.0175 | 5.8793 |
| 1963 | 112 | 5.1068 | 2.4044 – 8.1986 | 5.3127 |
| 1962 | 112 | 4.9059 | 2.9692 – 7.5536 | 5.0161 |
| 1961 | 107 | 4.8923 | 2.0690 – 6.9811 | 4.8791 |
062024 → 2025
Who rose and fell
The biggest changes in value between the two newest editions — reference years recalculated in one report, not two separate publications. Places are shown second, because they also move when other countries do.
Improved most
before → after Palestine-22.8573 → 4.3444 · 200th → 64th+27.2018
 Sudan-13.9643 → 3.0643 · 199th → 101st+17.0286
 Timor-Leste-9.1007 → 6.9754 · 197th → 18th+16.0761
- Libya1.9000 → 13.3717 · 143rd → 2nd+11.4718
- Ireland2.5995 → 12.3376 · 127th → 3rd+9.7381
Declined most
before → after- Guyana43.8193 → 19.3360 · 1st → 1st−24.4833
- Iran3.6631 → -2.8260 · 87th → 185th−6.4891
- Equatorial Guinea0.3962 → -5.8468 · 174th → 186th−6.2430
- Palau12.0060 → 6.2864 · 2nd → 30th−5.7196
 Saint Lucia4.7689 → -0.5741 · 52nd → 178th−5.3430
186 countries were measured in both 2024 and 2025. The field changed from 200 to 186 countries, so a place can move for reasons that have nothing to do with the country itself.
07Across every edition
GDP growth in records
The extremes of the statistic. A record reached by more than one country names none of them.
Highest reading on record
149.9730
GDP growth (annual %)
Lowest reading on record
-64.0471
GDP growth (annual %)
Biggest improvement between editions
+137.1653
-50.3385 → 86.8267
Biggest decline between editions
−126.1985
149.9730 → 23.7745
Most improved since first measured
+32.2299
-27.2700 → 4.9599
At the top most often
5 of 65
editions, alone at the first-listed end
08The measure
About GDP growth
GDP growth is the annual percentage change in a country’s real output, measured at constant local prices so inflation is out of it. It is the number governments are judged on quarterly — and the one that says least about a country on its own.
What the number is: GDP growth (annual %).
09Where it fits
Connections
Its part in the Country Index, the statistics whose values line up most closely with it across countries, and others on the same subject.
In the Country Index
Context, with no vote
This statistic is published in full under Economy & Innovation, but does not help decide any Country Index standing.
Moves with
Where GDP growth is higher, these tend to be higher too.
- Informal Employment RateILO · 92 countries in commonρ 0.48
- Vulnerable EmploymentKeyILO · 169 countries in commonρ 0.46
- Self-Employment RateILO · 169 countries in commonρ 0.46
Moves against
Where GDP growth is higher, these tend to be lower.
- Research and Development SpendingUIS · 82 countries in commonρ −0.51
- General Government ConsumptionWorld Bank Group · 132 countries in commonρ −0.50
- Inequality-adjusted Human Development IndexUNDP Human Development Report Office · 164 countries in commonρ −0.45
Rank correlation (ρ, from −1 to 1) across countries, on each statistic’s newest edition, out of 125 statistics sharing at least 80 countries with this one. Two statistics that move together do not cause each other.
10Keep reading
Explore further
The subject
More from World Bank Group
11Questions
GDP growth: questions and answers
Which country has the highest GDP growth?
Guyana, at 19.3360, among the 186 countries compared in 2025.
Which country has the lowest GDP growth?
Equatorial Guinea, at -5.8468, among the 186 countries compared in 2025.
How many countries does the GDP Growth cover?
186 in 2025, and 214 at least once across all editions. The number measured varies from 107 to 211 between editions.
What is the world average GDP growth?
This site does not calculate a world average, which would depend on how countries are weighted. In the middle country of the 186 compared in 2025, the figure was 3.3961.
Is this World Bank Group’s own ranking?
No. World Bank Group publishes the values but ranks nobody; the position on this page is derived by Nations Inquiry by ordering the published values, and equal values share a position.
How often is the GDP Growth published?
This site holds 65 reference years, 1961–2025, all recalculated in World Bank Group’s 2026 report on one method — not 65 separate publications.
Where does the data come from, and can I download it?
From World Bank Group, under CC BY 4.0. Pulled from the World Bank’s indicator API (NY.GDP.MKTP.KD.ZG). One year of growth is not a verdict on a country, so this is left out of the Country Index. Every edition is available on this site’s Datasets pages as a full table, unrounded.
12Method
Sources, method and citation
Source
GDP Growth — World Bank Group
Pulled from the World Bank’s indicator API (NY.GDP.MKTP.KD.ZG). One year of growth is not a verdict on a country, so this is left out of the Country Index.
Newest edition
Report year 2025Data year 2025
Cite the source as: World Bank. World Development Indicators. Washington, DC: World Bank Group.
Licence: CC BY 4.0, checked 2026-09-06.
How this page reads the numbers
- World Bank Group ranks nobody on this measure. The position is derived by Nations Inquiry by ordering the published values; equal values share a position.
- Which end is better follows the publisher’s own reading of the measure.
- A country is named at an end only when it holds that value alone. Where several share it, the page says how many and names none first.
- Values are stored exactly as published and trimmed only for display. “The middle country” is the median of the countries measured, not a world average.
The full note on this data
65 reference years (1961–2025), covering 107 to 211 countries — the longest and widest series on the site — pulled from the World Bank’s indicator API (NY.GDP.MKTP.KD.ZG). The annual percentage change in real GDP, measured at constant local prices so inflation is out of it. ⚠ A RATE, NOT A LEVEL, and this is the thing to hold on to when reading the table: the top of any year’s list is usually a small economy rebounding from a bad year or opening an oil field, not a rich country. Equatorial Guinea’s 150% in 1997 and Iraq’s −64% in 1991 are both real, and both say more about the year before than about the country. ⚠ A statistic, not an index, and left out of the Country Index: one year of growth is not a verdict on a country. ⚠ These are not 65 published reports — see `restatedByReport`. No rank is published, so none is stored; the POSITION shown on the statistics page is derived here by ordering the score, and labelled as ours.
Photographs
The countries at the top of this statistic, from their profiles: Wikimedia Commons, shown in greyscale, each used under the licence named.
- Guyana — Bill Cameron, CC BY-SA 3.0
- Libya — Maher A. A. Abdussalam, CC0
- Ireland — derivative work: Jjtkk, CC BY-SA 2.0
Cite this page
Nations Inquiry (2026). GDP growth by country: GDP Growth, data from World Bank Group. https://nationsinquiry.com/statistics/gdp-growth