World Bank Group · Comprehensive Wealth per Capita
Comprehensive wealth per person by country
How much does a country own per person — its buildings, natural resources, people’s earning power and foreign assets together?
Switzerland placed first of the 150 countries compared in 2020, at 1,246,092, and Gambia last, at 4,276. In the middle country the figure was 46,486. Among the 137 countries measured in every edition since 1995, the middle one moved from 35,238 to 48,271.
Share
Comprehensive wealth per person · 2020
Context statistic

Highest of 150Switzerland
1,246,092012020 · position · derived
Who leads
The three countries at the highest end of 150 compared, the three at the other end, and the first on each continent.
 1
1Photo: Simon Koopmann derivative work: Jjtkk · CC BY-SA 2.0 de, greyscale
 2
2Photo: Ximonic , Simo Räsänen · CC BY-SA 3.0, greyscale
 3
3Photo: Hansueli Krapf · CC BY-SA 3.0, greyscale

Lowest in 2020
- 150
 Gambia4,276
 - 149
 Central African Republic5,262
 - 148
 Burundi5,423
Positions out of 150. Where a country sits says how it compares with the others measured, and nothing about why.
Highest on each continent
- Africa
 Mauritius76,347
 - Americas
 United States751,632
 - Asia
 Qatar901,777
 - EuropeSwitzerland1,246,092
- Oceania
 Australia851,877
4 of 21 measured
- Every region
02Every measured country
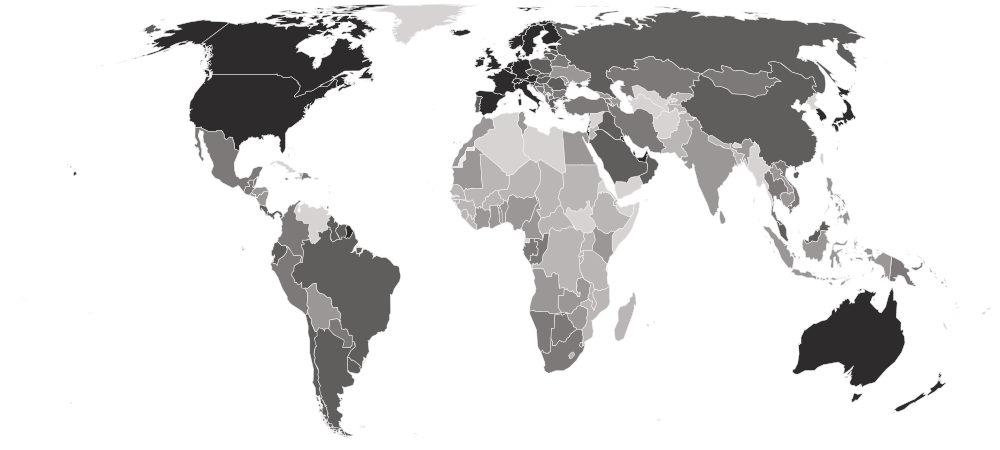
Comprehensive wealth per person on a map
Each country is shaded by its value, in five groups holding the same number of countries. Hover a country for its value, or select it to open its profile. Below the map, each continent’s middle country.
Darker is a higher value — the better end.
- 4,276–14,724
- 14,962–30,677
- 32,815–68,210
- 69,870–202,911
- 206,330–1,246,092
- No reading in 2020 (1 measured in an earlier edition)
- Europe
202,911
the middle country, of 39 measured · 49 members
Switzerland1,246,092 Moldova16,471
Highest and lowest reading in Europe.
- Americas
68,992
the middle country, of 26 measured · 48 members
United States751,632 Haiti9,725
Highest and lowest reading in Americas.
- Asia
47,908
the middle country, of 36 measured · 52 members
Qatar901,777 Kyrgyzstan9,920
Highest and lowest reading in Asia.
- Africa
13,792
the middle country, of 45 measured · 55 members
Mauritius76,347Gambia4,276Highest and lowest reading in Africa.
- Oceania
4 of 21 measured — too few for a middle: Australia, New Zealand, Papua New Guinea, Solomon Islands.
Australia851,877 Papua New Guinea33,223
Highest and lowest reading in Oceania.
- Every region
20 sub-regions, highest middle country first
- Western Europe
597,229
the middle country, of 7 measured · 9 members
Switzerland1,246,092 Belgium463,404
Highest and lowest reading in Western Europe.
- Northern Europe
457,558
the middle country, of 10 measured · 13 members
 Norway1,153,866
 Lithuania147,170
Highest and lowest reading in Northern Europe.
- Southern Europe
101,151
the middle country, of 12 measured · 17 members
 Malta272,153
 Montenegro27,479
Highest and lowest reading in Southern Europe.
- Western Asia
95,363
the middle country, of 14 measured · 19 members
Qatar901,777 Jordan14,724
Highest and lowest reading in Western Asia.
- Eastern Europe
92,655
the middle country, of 10 measured · 10 members
 Czechia202,911Moldova16,471
Highest and lowest reading in Eastern Europe.
- South America
74,030
the middle country, of 11 measured · 12 members
 Uruguay174,093
 Bolivia29,483
Highest and lowest reading in South America.
- Caribbean
57,577
the middle country, of 5 measured · 24 members
 Saint Lucia94,456Haiti9,725
Highest and lowest reading in Caribbean.
- Southern Africa
45,849
the middle country, of 5 measured · 5 members
 South Africa50,458
 Lesotho9,682
Highest and lowest reading in Southern Africa.
- Central America
34,511
the middle country, of 8 measured · 8 members
 Costa Rica128,534
 Nicaragua17,344
Highest and lowest reading in Central America.
- South-eastern Asia
30,559
the middle country, of 8 measured · 11 members
 Singapore704,239
 Cambodia15,148
Highest and lowest reading in South-eastern Asia.
- Middle Africa
20,869
the middle country, of 7 measured · 9 members
 Gabon45,584Central African Republic5,262
Highest and lowest reading in Middle Africa.
- Southern Asia
15,869
the middle country, of 7 measured · 9 members
 Maldives74,501
 Pakistan10,770
Highest and lowest reading in Southern Asia.
- Western Africa
13,250
the middle country, of 15 measured · 16 members
 Ghana26,499Gambia4,276
Highest and lowest reading in Western Africa.
- Eastern Africa
12,083
the middle country, of 14 measured · 19 members
Mauritius76,347Burundi5,423Highest and lowest reading in Eastern Africa.
- Australia and New Zealand
2 of 2 measured — too few for a middle: Australia, New Zealand.
Australia851,877 New Zealand598,370
Highest and lowest reading in Australia and New Zealand.
- Central Asia
3 of 5 measured — too few for a middle: Kazakhstan, Kyrgyzstan, Tajikistan.
 Kazakhstan58,056Kyrgyzstan9,920
Highest and lowest reading in Central Asia.
- Eastern Asia
4 of 8 measured — too few for a middle: China, Japan, Mongolia, South Korea.
 Japan517,524
 Mongolia48,271
Highest and lowest reading in Eastern Asia.
- Melanesia
2 of 5 measured — too few for a middle: Papua New Guinea, Solomon Islands.
 Solomon Islands39,681Papua New Guinea33,223
Highest and lowest reading in Melanesia.
- Northern Africa
4 of 6 measured — too few for a middle: Egypt, Morocco, Sudan, Tunisia.
 Tunisia21,150
 Sudan8,604
Highest and lowest reading in Northern Africa.
- Northern America
2 of 4 measured — too few for a middle: Canada, United States.
United States751,632 Canada591,339
Highest and lowest reading in Northern America.
03The whole field at once
The spread
150 countries, one dot each, on one scale — further right is a higher value. Half the countries are above 46,486; a quarter are above 142,636, and a quarter below 17,349. The bar in each row marks that continent’s middle country.
04All 151 ever measured
Every country
In order, highest value first. “=” marks a position shared with another country. World Bank Group ranks nobody on this measure; the position is derived here by ordering the published values. Wealth is valued at market prices, so oil and mineral exporters rise and fall with commodity prices, and the earning power of people — the largest part almost everywhere — is valued by what they are paid. A high figure means large assets per person, not that they are well shared.
Showing 25 of 151 countries










































































































Values for 2020. The change column compares 2020 with 2019 only; the sparkline covers the recent editions.
051995–2020 · 26 reference years
Over time
Each point is one year from 1995 to 2020, all recalculated in one 2024 release and measured in real 2019 dollars, so the slope shows whether a country’s assets per person grew or shrank.
- the middle country
- the middle half of countries
- the middle of the 137 countries measured every time
- each continent’s middle country
The same, year by year
| Year | Countries | Middle country | Middle half | Measured every time |
|---|---|---|---|---|
| 2020 | 150 | 46,486 | 17,349 – 142,636 | 48,271 |
| 2019 | 151 | 46,959 | 17,127 – 136,706 | 48,587 |
| 2018 | 150 | 47,119 | 16,978 – 134,507 | 48,479 |
| 2017 | 150 | 44,249 | 16,682 – 132,329 | 48,694 |
| 2016 | 150 | 43,049 | 16,858 – 131,884 | 48,591 |
| 2015 | 150 | 42,235 | 16,549 – 127,395 | 48,540 |
| 2014 | 150 | 41,484 | 16,256 – 124,134 | 47,185 |
| 2013 | 149 | 42,180 | 16,118 – 120,094 | 47,060 |
| 2012 | 149 | 39,122 | 16,746 – 116,005 | 45,420 |
| 2011 | 149 | 38,674 | 17,197 – 113,220 | 43,931 |
| 2010 | 149 | 37,394 | 17,570 – 127,501 | 42,351 |
| 2009 | 149 | 38,010 | 17,221 – 120,547 | 42,574 |
| 2008 | 149 | 38,098 | 16,462 – 119,808 | 42,596 |
| 2007 | 149 | 39,009 | 16,307 – 112,274 | 41,064 |
| 2006 | 147 | 38,792 | 16,257 – 117,040 | 40,640 |
| 2005 | 147 | 37,729 | 16,578 – 118,779 | 41,315 |
| 2004 | 147 | 36,545 | 16,604 – 111,744 | 40,848 |
| 2003 | 147 | 36,278 | 16,389 – 111,705 | 40,186 |
| 2002 | 147 | 35,737 | 16,121 – 114,057 | 39,287 |
| 2001 | 146 | 36,039 | 15,628 – 116,845 | 39,325 |
| 2000 | 145 | 36,437 | 15,352 – 118,021 | 38,912 |
| 1999 | 143 | 36,273 | 15,234 – 120,165 | 38,998 |
| 1998 | 141 | 37,614 | 15,379 – 124,284 | 37,962 |
| 1997 | 141 | 36,509 | 14,475 – 120,526 | 37,435 |
| 1996 | 139 | 36,023 | 14,016 – 118,730 | 36,262 |
| 1995 | 137 | 35,238 | 13,613 – 119,521 | 35,238 |
062019 → 2020
Who rose and fell
The biggest changes in value between the two newest editions — reference years recalculated in one report, not two separate publications. Places are shown second, because they also move when other countries do.
Improved most
before → after- Singapore656,932 → 704,239 · 10th → 9th+47,307
- Qatar854,708 → 901,777 · 5th → 5th+47,070
- Switzerland1,210,058 → 1,246,092 · 1st → 1st+36,034
- Norway1,118,807 → 1,153,866 · 2nd → 2nd+35,059
 Netherlands634,877 → 658,764 · 11th → 11th+23,887
Declined most
before → after- Uruguay176,897 → 174,093 · 32nd → 32nd−2,803
 Saudi Arabia117,501 → 115,155 · 41st → 43rd−2,345
 Iraq77,220 → 75,571 · 55th → 56th−1,649
 Greece104,488 → 102,912 · 46th → 46th−1,576
- Gabon46,959 → 45,584 · 76th → 77th−1,375
150 countries were measured in both 2019 and 2020. The field changed from 151 to 150 countries, so a place can move for reasons that have nothing to do with the country itself.
07Across every edition
Comprehensive wealth per person in records
The extremes of the statistic. A record reached by more than one country names none of them.
Highest reading on record
1,421,483
National comprehensive wealth per person (real chained 2019 US$)
Lowest reading on record
192
National comprehensive wealth per person (real chained 2019 US$)
Biggest improvement between editions
+460,910
944,604 → 1,405,515
Biggest decline between editions
−152,172
774,320 → 622,148
Most improved since first measured
+447,043
257,196 → 704,239
At the top most often
17 of 26
editions, alone at the first-listed end
08The measure
About comprehensive wealth per person
Comprehensive wealth is the World Bank’s estimate of everything a country owns, divided by its population: buildings, machinery and infrastructure; forests, farmland, fisheries and mineral deposits; the earning power of its people; and what it is owed abroad minus what it owes. It asks whether a country’s prosperity rests on assets that will last.
What the number is: National comprehensive wealth per person (real chained 2019 US$).
09Where it fits
Connections
Its part in the Country Index, the statistics whose values line up most closely with it across countries, and others on the same subject.
In the Country Index
Context, with no vote
This statistic is published in full under Economy & Innovation and Development & Human Capital, but does not help decide any Country Index standing.
Economy & InnovationDevelopment & Human CapitalWhich statistics vote, and why
Moves with
Where comprehensive wealth per person is higher, these tend to be higher too.
- Human Capital Wealth per CapitaWorld Bank Group · 150 countries in commonρ 0.97
- Historical GDP per Capita (Maddison)GGDC · 144 countries in commonρ 0.94
- GDP per Capita (PPP)KeyWorld Bank Group · 148 countries in commonρ 0.93
Moves against
Where comprehensive wealth per person is higher, these tend to be lower.
- Employment in AgricultureILO · 147 countries in commonρ −0.86
- Agriculture, Forestry and Fishing Value Added (% of GDP)World Bank Group · 135 countries in commonρ −0.86
- Stillbirth RateUN IGME · 150 countries in commonρ −0.84
Rank correlation (ρ, from −1 to 1) across countries, on each statistic’s newest edition, out of 365 statistics sharing at least 80 countries with this one. Two statistics that move together do not cause each other.
10Keep reading
Explore further
The countries at either end
More from World Bank Group
11Questions
Comprehensive wealth per person: questions and answers
Which country has the highest comprehensive wealth per person?
Switzerland, at 1,246,092, among the 150 countries compared in 2020.
Which country has the lowest comprehensive wealth per person?
Gambia, at 4,276, among the 150 countries compared in 2020.
How many countries does the Comprehensive Wealth per Capita cover?
150 in 2020, and 151 at least once across all editions. The number measured varies from 137 to 151 between editions.
What is the world average comprehensive wealth per person?
This site does not calculate a world average, which would depend on how countries are weighted. In the middle country of the 150 compared in 2020, the figure was 46,486.
Is this World Bank Group’s own ranking?
No. World Bank Group publishes the values but ranks nobody; the position on this page is derived by Nations Inquiry by ordering the published values, and equal values share a position.
How often is the Comprehensive Wealth per Capita published?
This site holds 26 reference years, 1995–2020, all recalculated in World Bank Group’s 2024 report on one method — not 26 separate publications.
Where does the data come from, and can I download it?
From World Bank Group, under CC BY 4.0. From the World Bank’s The Changing Wealth of Nations 2024, through its indicator API (Wealth Accounts, NW.TOW.PC). The parts are not shown beside the total, because the Bank’s chained figures do not add up to it. Every edition is on this site’s Datasets pages as a full table, and downloads as a CSV file with every value unrounded.
12Method
Sources, method and citation
Source
Comprehensive Wealth per Capita — World Bank Group
From the World Bank’s The Changing Wealth of Nations 2024, through its indicator API (Wealth Accounts, NW.TOW.PC). The parts are not shown beside the total, because the Bank’s chained figures do not add up to it.
Newest edition
Report year 2020Data year 2020
Cite the source as: World Bank. 2024. The Changing Wealth of Nations 2024: Revisiting the Measurement of Comprehensive Wealth. Washington, DC: World Bank.
Licence: CC BY 4.0, checked 2026-10-03.
How this page reads the numbers
- World Bank Group ranks nobody on this measure. The position is derived by Nations Inquiry by ordering the published values; equal values share a position.
- Which end is better follows the publisher’s own reading of the measure.
- A country is named at an end only when it holds that value alone. Where several share it, the page says how many and names none first.
- Values are stored exactly as published and trimmed only for display. “The middle country” is the median of the countries measured, not a world average.
The file itself, column by column — where it came from, what each column holds, and every edition as a CSV — is on its dataset page.
Photographs
The countries at the top of this statistic, from their profiles: Wikimedia Commons, shown in greyscale, each used under the licence named.
- Switzerland — Simon Koopmann derivative work: Jjtkk, CC BY-SA 2.0 de
- Norway — Ximonic , Simo Räsänen, CC BY-SA 3.0
- Iceland — Hansueli Krapf, CC BY-SA 3.0
Cite this page
Nations Inquiry (2026). Comprehensive wealth per person by country: Comprehensive Wealth per Capita, data from World Bank Group. https://nationsinquiry.com/statistics/comprehensive-wealth-per-capita