World Bank Group · Human Capital Wealth per Capita
Human capital wealth per person by country
What are a country’s people worth to its economy, valued by their expected lifetime earnings?
Switzerland placed first of the 151 countries compared in 2020, at 735,422, and Central African Republic last, at 700. In the middle country the figure was 25,230. Among the 148 countries measured in every edition since 1995, the middle one moved from 16,606 to 25,814.
Share
Human capital wealth per person · 2020
Context statistic

Highest of 151Switzerland
735,422012020 · position · derived
Who leads
The three countries at the highest end of 151 compared, the three at the other end, and the first on each continent.
 1
1Photo: Simon Koopmann derivative work: Jjtkk · CC BY-SA 2.0 de, greyscale
 2
2Photo: Michal Osmenda from Brussels, Belgium · CC BY-SA 2.0, greyscale
 3
3Photo: Hansueli Krapf · CC BY-SA 3.0, greyscale
Lowest in 2020
- 151
 Central African Republic700
 - 150
 Burundi2,244
 - 149
 Niger2,301
Positions out of 151. Where a country sits says how it compares with the others measured, and nothing about why.
Highest on each continent
- Africa
 Mauritius45,708
 - Americas
 United States503,350
 - Asia
 Singapore431,983
 - EuropeSwitzerland735,422
- Oceania
 Australia407,797
4 of 21 measured
- Every region
02Every measured country
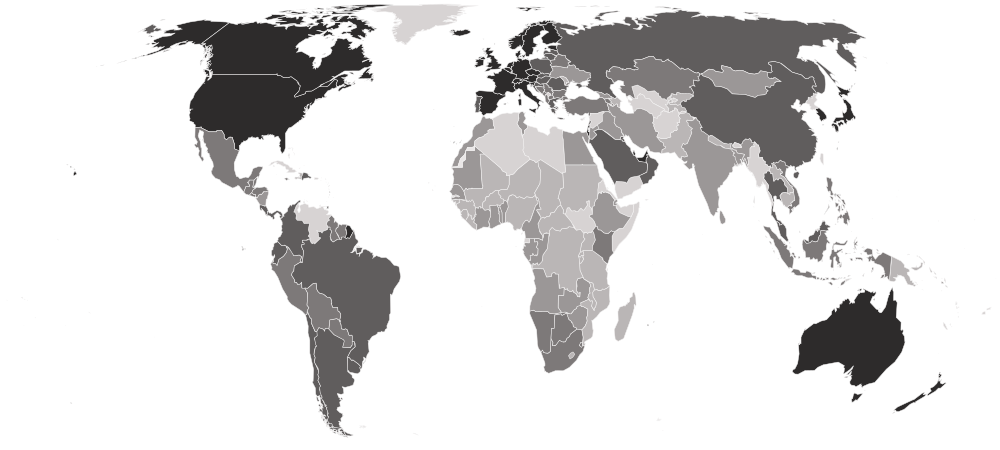
Human capital wealth per person on a map
Each country is shaded by its value, in five groups holding the same number of countries. Hover a country for its value, or select it to open its profile. Below the map, each continent’s middle country.
Darker is a higher value — the better end.
- 700–7,425
- 7,436–15,864
- 15,986–44,738
- 45,405–133,922
- 139,609–735,422
- No reading in 2020
- Europe
139,609
the middle country, of 39 measured · 49 members
Switzerland735,422 Moldova4,742
Highest and lowest reading in Europe.
- Americas
45,071
the middle country, of 26 measured · 48 members
United States503,350 Haiti6,131
Highest and lowest reading in Americas.
- Asia
19,051
the middle country, of 36 measured · 52 members
Singapore431,983 Tajikistan3,385
Highest and lowest reading in Asia.
- Africa
7,985
the middle country, of 46 measured · 55 members
Mauritius45,708Central African Republic700Highest and lowest reading in Africa.
- Oceania
4 of 21 measured — too few for a middle: Australia, New Zealand, Papua New Guinea, Solomon Islands.
Australia407,797 Papua New Guinea7,214
Highest and lowest reading in Oceania.
- Every region
20 sub-regions, highest middle country first
- Western Europe
360,923
the middle country, of 7 measured · 9 members
Switzerland735,422 Austria287,604
Highest and lowest reading in Western Europe.
- Northern Europe
333,995
the middle country, of 10 measured · 13 members
 Iceland586,976
 Latvia95,696
Highest and lowest reading in Northern Europe.
- Southern Europe
80,674
the middle country, of 12 measured · 17 members
 Malta214,489
 Albania17,778
Highest and lowest reading in Southern Europe.
- Eastern Europe
58,382
the middle country, of 10 measured · 10 members
 Czechia139,609Moldova4,742
Highest and lowest reading in Eastern Europe.
- Western Asia
51,180
the middle country, of 14 measured · 19 members
 Israel316,068
 Azerbaijan6,945
Highest and lowest reading in Western Asia.
- South America
47,192
the middle country, of 11 measured · 12 members
 Uruguay119,024
 Suriname18,784
Highest and lowest reading in South America.
- Caribbean
45,405
the middle country, of 5 measured · 24 members
 Trinidad and Tobago66,553Haiti6,131
Highest and lowest reading in Caribbean.
- Southern Africa
27,680
the middle country, of 5 measured · 5 members
 South Africa34,698
 Lesotho6,430
Highest and lowest reading in Southern Africa.
- Central America
24,431
the middle country, of 8 measured · 8 members
 Costa Rica103,848
 Nicaragua11,080
Highest and lowest reading in Central America.
- South-eastern Asia
18,635
the middle country, of 8 measured · 11 members
Singapore431,983 Laos6,754
Highest and lowest reading in South-eastern Asia.
- Middle Africa
12,076
the middle country, of 8 measured · 9 members
 Gabon15,345Central African Republic700
Highest and lowest reading in Middle Africa.
- Southern Asia
9,607
the middle country, of 7 measured · 9 members
 Maldives78,127
 Nepal4,833
Highest and lowest reading in Southern Asia.
- Eastern Africa
7,742
the middle country, of 14 measured · 19 members
Mauritius45,708Burundi2,244Highest and lowest reading in Eastern Africa.
- Western Africa
6,121
the middle country, of 15 measured · 16 members
 Côte d’Ivoire15,864Niger2,301
Highest and lowest reading in Western Africa.
- Australia and New Zealand
2 of 2 measured — too few for a middle: Australia, New Zealand.
Australia407,797 New Zealand305,807
Highest and lowest reading in Australia and New Zealand.
- Central Asia
3 of 5 measured — too few for a middle: Kazakhstan, Kyrgyzstan, Tajikistan.
 Kazakhstan18,880Tajikistan3,385
Highest and lowest reading in Central Asia.
- Eastern Asia
4 of 8 measured — too few for a middle: China, Japan, Mongolia, South Korea.
 Japan231,116
 Mongolia12,679
Highest and lowest reading in Eastern Asia.
- Melanesia
2 of 5 measured — too few for a middle: Papua New Guinea, Solomon Islands.
 Solomon Islands11,526Papua New Guinea7,214
Highest and lowest reading in Melanesia.
- Northern Africa
4 of 6 measured — too few for a middle: Egypt, Morocco, Sudan, Tunisia.
 Tunisia14,702
 Sudan3,824
Highest and lowest reading in Northern Africa.
- Northern America
2 of 4 measured — too few for a middle: Canada, United States.
United States503,350 Canada351,375
Highest and lowest reading in Northern America.
03The whole field at once
The spread
151 countries, one dot each, on one scale — further right is a higher value. Half the countries are above 25,230; a quarter are above 90,839, and a quarter below 9,521. The bar in each row marks that continent’s middle country.
Log scale: each gridline is ten times the one before, so countries of very different sizes can be seen on one line.
04All 151 ever measured
Every country
In order, highest value first. “=” marks a position shared with another country. World Bank Group ranks nobody on this measure; the position is derived here by ordering the published values. Because human capital is valued by earnings, a country with high wages reads high even if its schools are weak, and a low-wage country reads low however well its children learn. For what schooling and health deliver directly, compare the Human Capital Index.
Showing 25 of 151 countries






































































































Values for 2020. The change column compares 2020 with 2019 only; the sparkline covers the recent editions.
051995–2020 · 26 reference years
Over time
Each point is one year from 1995 to 2020, all recalculated in one 2024 release in real 2019 dollars, so a rising line means the earning power of the population, per person, grew.
- the middle country
- the middle half of countries
- the middle of the 148 countries measured every time
- each continent’s middle country
The same, year by year
| Year | Countries | Middle country | Middle half | Measured every time |
|---|---|---|---|---|
| 2020 | 151 | 25,230 | 9,521 – 90,839 | 25,814 |
| 2019 | 151 | 24,198 | 9,575 – 87,847 | 25,033 |
| 2018 | 151 | 23,285 | 9,635 – 87,015 | 24,215 |
| 2017 | 151 | 22,489 | 9,581 – 86,845 | 22,991 |
| 2016 | 151 | 21,883 | 9,585 – 83,548 | 22,297 |
| 2015 | 151 | 21,185 | 9,325 – 83,397 | 21,991 |
| 2014 | 151 | 21,670 | 9,058 – 82,499 | 22,295 |
| 2013 | 151 | 20,607 | 8,960 – 82,489 | 21,563 |
| 2012 | 151 | 20,311 | 8,759 – 81,018 | 22,000 |
| 2011 | 150 | 20,964 | 8,706 – 80,260 | 21,453 |
| 2010 | 150 | 20,744 | 8,490 – 80,132 | 21,127 |
| 2009 | 150 | 20,638 | 8,468 – 79,120 | 20,958 |
| 2008 | 150 | 20,473 | 8,358 – 84,730 | 21,128 |
| 2007 | 150 | 19,625 | 8,504 – 84,448 | 20,690 |
| 2006 | 148 | 20,410 | 8,276 – 84,374 | 20,410 |
| 2005 | 148 | 20,057 | 8,115 – 80,229 | 20,057 |
| 2004 | 148 | 19,765 | 7,970 – 77,814 | 19,765 |
| 2003 | 148 | 19,260 | 7,956 – 76,254 | 19,260 |
| 2002 | 148 | 19,219 | 8,078 – 74,731 | 19,219 |
| 2001 | 148 | 18,810 | 7,972 – 72,316 | 18,810 |
| 2000 | 148 | 18,360 | 7,750 – 70,762 | 18,360 |
| 1999 | 148 | 17,984 | 7,519 – 71,325 | 17,984 |
| 1998 | 148 | 17,357 | 7,297 – 71,126 | 17,357 |
| 1997 | 148 | 17,010 | 7,087 – 68,475 | 17,010 |
| 1996 | 148 | 16,667 | 6,910 – 65,944 | 16,667 |
| 1995 | 148 | 16,606 | 6,784 – 65,846 | 16,606 |
062019 → 2020
Who rose and fell
The biggest changes in value between the two newest editions — reference years recalculated in one report, not two separate publications. Places are shown second, because they also move when other countries do.
Improved most
before → after- Singapore409,692 → 431,983 · 8th → 8th+22,291
 Qatar260,999 → 282,997 · 21st → 20th+21,998
 Luxembourg628,483 → 646,928 · 2nd → 2nd+18,445
 Ireland363,135 → 371,230 · 11th → 10th+8,095
 Slovenia176,790 → 184,577 · 25th → 25th+7,787
Declined most
before → after Saudi Arabia65,583 → 62,744 · 48th → 50th−2,839
 Norway500,956 → 500,361 · 4th → 5th−595
 Senegal8,065 → 7,478 · 119th → 119th−587
 Philippines18,632 → 18,047 · 85th → 86th−584
 United Arab Emirates236,732 → 236,331 · 22nd → 22nd−401
151 countries were measured in both 2019 and 2020.
07Across every edition
Human capital wealth per person in records
The extremes of the statistic. A record reached by more than one country names none of them.
Highest reading on record
735,422
Human capital per person — present value of future earnings (real chained 2019 US$)
Lowest reading on record
628
Human capital per person — present value of future earnings (real chained 2019 US$)
Biggest improvement between editions
+26,743
492,513 → 519,256
Biggest decline between editions
−32,614
356,283 → 323,668
Most improved since first measured
+247,169
184,814 → 431,983
At the top most often
26 of 26
editions, alone at the first-listed end
08The measure
About human capital wealth per person
Human capital wealth is the World Bank’s estimate of what a country’s people are worth to its economy: the expected lifetime earnings of everyone of working age, valued today and divided by the population. It counts people as an asset — the largest one most countries have.
What the number is: Human capital per person — present value of future earnings (real chained 2019 US$).
09Where it fits
Connections
Its part in the Country Index, the statistics whose values line up most closely with it across countries, and others on the same subject.
In the Country Index
Context, with no vote
This statistic is published in full under Work & Labour and Development & Human Capital, but does not help decide any Country Index standing.
Work & LabourDevelopment & Human CapitalWhich statistics vote, and why
Moves with
Where human capital wealth per person is higher, these tend to be higher too.
- Comprehensive Wealth per CapitaWorld Bank Group · 150 countries in commonρ 0.97
- Actual Individual Consumption per Capita (PPP)World Bank Group · 147 countries in commonρ 0.93
- GDP per Capita (PPP)KeyWorld Bank Group · 149 countries in commonρ 0.93
Moves against
Where human capital wealth per person is higher, these tend to be lower.
- Employment in AgricultureILO · 148 countries in commonρ −0.88
- Agriculture, Forestry and Fishing Value Added (% of GDP)World Bank Group · 136 countries in commonρ −0.86
- Gender Inequality IndexUNDP Human Development Report Office · 149 countries in commonρ −0.86
Rank correlation (ρ, from −1 to 1) across countries, on each statistic’s newest edition, out of 365 statistics sharing at least 80 countries with this one. Two statistics that move together do not cause each other.
10Keep reading
Explore further
The subject
The countries at either end
More from World Bank Group
11Questions
Human capital wealth per person: questions and answers
Which country has the highest human capital wealth per person?
Switzerland, at 735,422, among the 151 countries compared in 2020.
Which country has the lowest human capital wealth per person?
Central African Republic, at 700, among the 151 countries compared in 2020.
How many countries does the Human Capital Wealth per Capita cover?
151 in 2020. The number measured varies from 148 to 151 between editions.
What is the world average human capital wealth per person?
This site does not calculate a world average, which would depend on how countries are weighted. In the middle country of the 151 compared in 2020, the figure was 25,230.
Is this World Bank Group’s own ranking?
No. World Bank Group publishes the values but ranks nobody; the position on this page is derived by Nations Inquiry by ordering the published values, and equal values share a position.
How often is the Human Capital Wealth per Capita published?
This site holds 26 reference years, 1995–2020, all recalculated in World Bank Group’s 2024 report on one method — not 26 separate publications.
Where does the data come from, and can I download it?
From World Bank Group, under CC BY 4.0. From the World Bank’s The Changing Wealth of Nations 2024, through its indicator API (Wealth Accounts, NW.HCA.PC). The Bank’s separate figures for women and men are shares of this total rather than rates for each, so they are not shown. Every edition is on this site’s Datasets pages as a full table, and downloads as a CSV file with every value unrounded.
12Method
Sources, method and citation
Source
Human Capital Wealth per Capita — World Bank Group
From the World Bank’s The Changing Wealth of Nations 2024, through its indicator API (Wealth Accounts, NW.HCA.PC). The Bank’s separate figures for women and men are shares of this total rather than rates for each, so they are not shown.
Newest edition
Report year 2020Data year 2020
Cite the source as: World Bank. 2024. The Changing Wealth of Nations 2024: Revisiting the Measurement of Comprehensive Wealth. Washington, DC: World Bank.
Licence: CC BY 4.0, checked 2026-10-03.
How this page reads the numbers
- World Bank Group ranks nobody on this measure. The position is derived by Nations Inquiry by ordering the published values; equal values share a position.
- Which end is better follows the publisher’s own reading of the measure.
- A country is named at an end only when it holds that value alone. Where several share it, the page says how many and names none first.
- Values are stored exactly as published and trimmed only for display. “The middle country” is the median of the countries measured, not a world average.
The file itself, column by column — where it came from, what each column holds, and every edition as a CSV — is on its dataset page.
Photographs
The countries at the top of this statistic, from their profiles: Wikimedia Commons, shown in greyscale, each used under the licence named.
- Switzerland — Simon Koopmann derivative work: Jjtkk, CC BY-SA 2.0 de
- Luxembourg — Michal Osmenda from Brussels, Belgium, CC BY-SA 2.0
- Iceland — Hansueli Krapf, CC BY-SA 3.0
Cite this page
Nations Inquiry (2026). Human capital wealth per person by country: Human Capital Wealth per Capita, data from World Bank Group. https://nationsinquiry.com/statistics/human-capital-per-capita