World Bank Group (ESMAP), data by Solargis · Photovoltaic Power Potential (PVOUT)
Solar power potential by country
How much electricity would a solar panel generate in each country?
Of the 209 countries compared in 2020, Namibia had the highest reading, 5.3791, and Ireland had the lowest reading, 2.5126. In the middle country the figure was 4.2728.
Part ofEnergy
Solar power potential · 2020
Context statistic

Highest of 209Namibia
5.3791012020 · values only
The highest and the lowest
The three countries with the highest values of 209 compared, the three with the lowest, and the highest on each continent. This statistic has no better end, so no country is shown as leading.
- 1
- 2

- 3

Lowest in 2020
 Ireland2.5126
 United Kingdom2.6127
 Norway2.7612
This statistic has no better end: the two ends describe size, not success.
02Every measured country
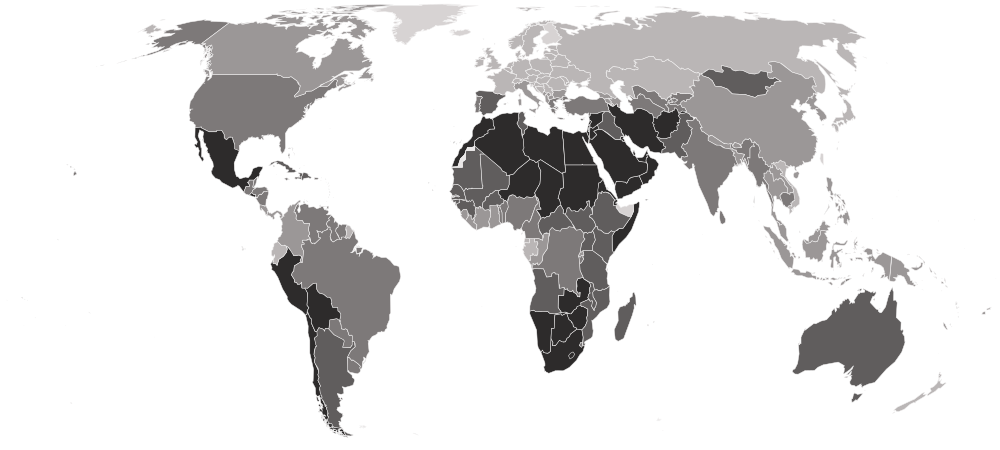
Solar power potential on a map
Each country is shaded by its value, in five groups holding the same number of countries. Hover a country for its value, or select it to open its profile. Below the map, each continent’s middle country.
Darker is a higher value. This statistic has no better end, so the shades describe size, not success.
- 2.5126–3.6850
- 3.6894–4.1063
- 4.1085–4.4042
- 4.4127–4.7579
- 4.7617–5.3791
- No reading in 2020
- Africa
4.5379
the middle country, of 54 measured · 55 members
Namibia5.3791 São Tomé and Príncipe3.4681
Highest and lowest reading in Africa.
- Americas
4.4281
the middle country, of 44 measured · 48 members
Chile5.3647 Ecuador3.4015
Highest and lowest reading in Americas.
- Asia
4.2403
the middle country, of 50 measured · 52 members
Jordan5.3150 Hong Kong3.2718
Highest and lowest reading in Asia.
- Oceania
4.0078
the middle country, of 19 measured · 21 members
 Kiribati4.8231
 Vanuatu3.5305
Highest and lowest reading in Oceania.
- Europe
3.3596
the middle country, of 42 measured · 49 members
 Malta4.5618Ireland2.5126
Highest and lowest reading in Europe.
- Every region
22 sub-regions, highest middle country first
- Southern Africa
5.1069
the middle country, of 5 measured · 5 members
Namibia5.3791 Eswatini4.3186
Highest and lowest reading in Southern Africa.
- Northern Africa
4.9749
the middle country, of 6 measured · 6 members
 Egypt5.2467
 Tunisia4.7445
Highest and lowest reading in Northern Africa.
- Western Asia
4.8614
the middle country, of 18 measured · 19 members
Jordan5.3150 Georgia3.7084
Highest and lowest reading in Western Asia.
- Caribbean
4.6273
the middle country, of 21 measured · 24 members
 Aruba4.9646
 Dominica3.9702
Highest and lowest reading in Caribbean.
- Micronesia
4.5320
the middle country, of 7 measured · 7 members
Kiribati4.8231 Micronesia3.8880
Highest and lowest reading in Micronesia.
- Eastern Africa
4.5055
the middle country, of 18 measured · 19 members
 Eritrea4.8948
 Rwanda4.1021
Highest and lowest reading in Eastern Africa.
- Western Africa
4.4475
the middle country, of 16 measured · 16 members
 Niger4.8370
 Liberia3.8833
Highest and lowest reading in Western Africa.
- South America
4.3294
the middle country, of 12 measured · 12 members
Chile5.3647Ecuador3.4015Highest and lowest reading in South America.
- Southern Asia
4.3220
the middle country, of 9 measured · 9 members
 Afghanistan5.0159
 Bangladesh3.8806
Highest and lowest reading in Southern Asia.
- Central Asia
4.2688
the middle country, of 5 measured · 5 members
 Turkmenistan4.3678
 Kazakhstan3.6850
Highest and lowest reading in Central Asia.
- Middle Africa
4.2556
the middle country, of 9 measured · 9 members
 Chad4.8374São Tomé and Príncipe3.4681
Highest and lowest reading in Middle Africa.
- Central America
4.2199
the middle country, of 8 measured · 8 members
 Mexico4.9241
 Panama3.9655
Highest and lowest reading in Central America.
- Polynesia
4.0529
the middle country, of 5 measured · 7 members
 French Polynesia4.3941
 American Samoa3.9826
Highest and lowest reading in Polynesia.
- South-eastern Asia
3.9009
the middle country, of 11 measured · 11 members
 Timor-Leste4.3391
 Singapore3.5513
Highest and lowest reading in South-eastern Asia.
- Southern Europe
3.8814
the middle country, of 15 measured · 17 members
Malta4.5618 Slovenia3.4345
Highest and lowest reading in Southern Europe.
- Eastern Asia
3.8163
the middle country, of 7 measured · 8 members
 Mongolia4.7573Hong Kong3.2718
Highest and lowest reading in Eastern Asia.
- Melanesia
3.6919
the middle country, of 5 measured · 5 members
 New Caledonia3.9764Vanuatu3.5305
Highest and lowest reading in Melanesia.
- Eastern Europe
3.3257
the middle country, of 10 measured · 10 members
 Bulgaria3.7028
 Belarus2.9485
Highest and lowest reading in Eastern Europe.
- Western Europe
3.1031
the middle country, of 8 measured · 9 members
 France3.3861
 Netherlands2.8647
Highest and lowest reading in Western Europe.
- Northern Europe
2.8369
the middle country, of 9 measured · 13 members
 Lithuania2.8704Ireland2.5126
Highest and lowest reading in Northern Europe.
- Australia and New Zealand
2 of 2 measured — too few for a middle: Australia, New Zealand.
 Australia4.7071
 New Zealand3.6774
Highest and lowest reading in Australia and New Zealand.
- Northern America
3 of 4 measured — too few for a middle: Bermuda, Canada, United States.
 United States4.3584
 Canada3.8155
Highest and lowest reading in Northern America.
03The whole field at once
The spread
209 countries, one dot each, on one scale — further right is a higher value. Half the countries are above 4.2728; a quarter are above 4.6823, and a quarter below 3.8155. The bar in each row marks that continent’s middle country.
04All 209 ever measured
Every country
In order, highest value first. No rank or position is shown: too many countries share the same value for an order to mean anything. Neither end is better: this is geography, like land area. Deserts and dry tropics read highest and cloudy northern countries lowest, and a high figure says nothing about how much solar power a country actually generates. For a few very large countries the figure covers only the land south of 60°N or north of 45°S.
Showing 25 of 209 countries



































































































































































Values for 2020.
05In this edition
Solar power potential in records
The extremes of the statistic. A record reached by more than one country names none of them.
Highest reading
5.3791
Practical solar power potential (kWh per kWp per day, long-term average)
Lowest reading
2.5126
Practical solar power potential (kWh per kWp per day, long-term average)
06The measure
About solar power potential
This is how much electricity a solar panel would generate in a country: the kilowatt-hours a day produced by one kilowatt of panels in a typical solar farm, averaged over the country’s usable land and many years of weather. It measures the sunshine a country has to work with, not what it has built.
What the number is: Practical solar power potential (kWh per kWp per day, long-term average).
07Where it fits
Connections
Its part in the Country Index, the statistics whose values line up most closely with it across countries, and others on the same subject.
In the Country Index
Context, with no vote
This statistic is published in full under Energy, but does not help decide any Country Index standing.
Moves with
Where solar power potential is higher, these tend to be higher too.
- Learning PovertyWorld Bank Group and UNESCO Institute for Statistics · 107 countries in commonρ 0.58
- Coefficient of Human InequalityUNDP Human Development Report Office · 167 countries in commonρ 0.57
- Youth Not in Education, Employment or TrainingILO · 95 countries in commonρ 0.57
Moves against
Where solar power potential is higher, these tend to be lower.
- Minimum Proficiency in Mathematics, End of Lower SecondaryUIS · 96 countries in commonρ −0.68
- Minimum Proficiency in Reading, End of Lower SecondaryUIS · 90 countries in commonρ −0.60
- Researchers per Million InhabitantsUIS · 125 countries in commonρ −0.55
Rank correlation (ρ, from −1 to 1) across countries, on each statistic’s newest edition, out of 312 statistics sharing at least 80 countries with this one. Two statistics that move together do not cause each other.
08Keep reading
Explore further
The subject
The data, edition by edition
09Questions
Solar power potential: questions and answers
Which country has the highest solar power potential?
Namibia, at 5.3791, among the 209 countries compared in 2020.
Which country has the lowest solar power potential?
Ireland, at 2.5126, among the 209 countries compared in 2020.
How many countries does the Photovoltaic Power Potential (PVOUT) cover?
209 in 2020.
What is the world average solar power potential?
This site does not calculate a world average, which would depend on how countries are weighted. In the middle country of the 209 compared in 2020, the figure was 4.2728.
Is this World Bank Group (ESMAP), data by Solargis’s own ranking?
No ranking is shown. World Bank Group (ESMAP), data by Solargis publishes values only, and too many countries share the same value for an ordering to mean anything, so none is derived.
How often is the Photovoltaic Power Potential (PVOUT) published?
This site holds one edition, describing 2020.
Where does the data come from, and can I download it?
From World Bank Group (ESMAP), data by Solargis, under CC BY 4.0. From the World Bank and ESMAP’s Global Photovoltaic Power Potential by Country study, with data by Solargis, read from the workbook on the World Bank’s Data Catalog. Only Solargis’s own columns are used; the other publishers’ figures in the same sheet are left out. Every edition is on this site’s Datasets pages as a full table, and downloads as a CSV file with every value unrounded.
10Method
Sources, method and citation
Source
Photovoltaic Power Potential (PVOUT) — World Bank Group (ESMAP), data by Solargis
From the World Bank and ESMAP’s Global Photovoltaic Power Potential by Country study, with data by Solargis, read from the workbook on the World Bank’s Data Catalog. Only Solargis’s own columns are used; the other publishers’ figures in the same sheet are left out.
Newest edition
Report year 2020Data year 2020
Cite the source as: ESMAP. 2020. Global Photovoltaic Power Potential by Country. Washington, DC: World Bank. Data: Solargis.
Licence: CC BY 4.0, checked 2026-09-29.
How this page reads the numbers
- No rank or position is shown: World Bank Group (ESMAP), data by Solargis publishes values only, and too many countries share the same value for an ordering to mean anything.
- This statistic has no better end, so the page describes higher and lower values and never calls a country a leader.
- A country is named at an end only when it holds that value alone. Where several share it, the page says how many and names none first.
- Values are stored exactly as published and trimmed only for display. “The middle country” is the median of the countries measured, not a world average.
The file itself, column by column — where it came from, what each column holds, and every edition as a CSV — is on its dataset page.
Cite this page
Nations Inquiry (2026). Solar power potential by country: Photovoltaic Power Potential (PVOUT), data from World Bank Group (ESMAP), data by Solargis. https://nationsinquiry.com/statistics/solar-pv-potential