UNICEF · Institutional Deliveries
Births in a health facility by country
What share of births take place in a hospital or clinic?
Of the 125 countries compared in the 2025 edition, 4 countries shared the highest reading, 100.0%, and Somalia had the lowest reading, 20.7%. In the middle country the figure was 94.7%. 46 readings from before 2015 are listed but not compared.
Share
Births in a health facility · the 2025 edition
Context statistic
4 countries share the highest value, 100.0% — no single country is named first.
01the 2025 edition · values only
Who leads
The three countries at the highest end of 125 compared, the three at the other end, and the first on each continent.
Highest in the 2025 edition · shared
4 countries share the highest reading, 100.0%
No single country is named first: picking one from a shared value would be a choice the data does not make.
02Every measured country
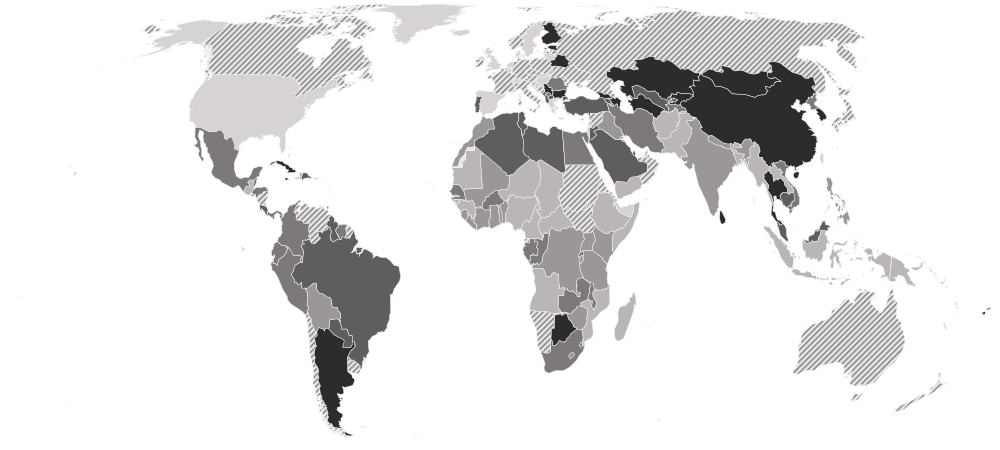
Births in a health facility on a map
Each country is shaded by its value, in five groups holding the same number of countries. Hover a country for its value, or select it to open its profile. Below the map, each continent’s middle country.
Darker is a higher value — the better end.
- 20.7–79.0%
- 79.4–91.4%
- 91.5–96.9%
- 97.0–99.3%
- 99.4–100.0%
- Hatched: a reading from before 2015, listed but not compared (46)
- No reading in the 2025 edition
- Europe
99.1%
the middle country, of 11 measured · 49 members
 Serbia100.0%
 Romania94.9%
Highest and lowest reading in Europe.
- Asia
98.0%
the middle country, of 38 measured · 52 members
3 share 100.0%
 Myanmar37.1%
Highest and lowest reading in Asia.
- Americas
96.9%
the middle country, of 21 measured · 48 members
 Cuba99.8%
 Haiti39.4%
Highest and lowest reading in Americas.
- Oceania
90.6%
the middle country, of 9 measured · 21 members
 Fiji99.7%
 Papua New Guinea54.7%
Highest and lowest reading in Oceania.
- Africa
85.0%
the middle country, of 46 measured · 55 members
 Botswana99.7%
 Somalia20.7%
Highest and lowest reading in Africa.
- Every region
19 sub-regions, highest middle country first
- Central Asia
99.5%
the middle country, of 5 measured · 5 members
 Turkmenistan100.0%
 Tajikistan94.7%
Highest and lowest reading in Central Asia.
- Western Asia
99.1%
the middle country, of 10 measured · 19 members
 Qatar100.0%
 Yemen46.9%
Highest and lowest reading in Western Asia.
- Southern Europe
99.0%
the middle country, of 6 measured · 17 members
Serbia100.0%2 share 98.6%
Highest and lowest reading in Southern Europe.
- Caribbean
98.2%
the middle country, of 6 measured · 24 members
Cuba99.8%Haiti39.4%Highest and lowest reading in Caribbean.
- Northern Africa
98.0%
the middle country, of 5 measured · 6 members
 Libya99.3%
 Morocco86.1%
Highest and lowest reading in Northern Africa.
- South America
96.9%
the middle country, of 9 measured · 12 members
 Argentina99.5%
 Bolivia80.2%
Highest and lowest reading in South America.
- Central America
95.7%
the middle country, of 6 measured · 8 members
 Costa Rica97.8%
 Guatemala65.0%
Highest and lowest reading in Central America.
- South-eastern Asia
92.4%
the middle country, of 10 measured · 11 members
2 share 99.5%
Myanmar37.1%Highest and lowest reading in South-eastern Asia.
- Eastern Africa
83.9%
the middle country, of 13 measured · 19 members
 Malawi96.9%Somalia20.7%
Highest and lowest reading in Eastern Africa.
- Western Africa
80.7%
the middle country, of 16 measured · 16 members
 Cabo Verde97.0%
 Nigeria43.3%
Highest and lowest reading in Western Africa.
- Southern Asia
79.4%
the middle country, of 9 measured · 9 members
 Sri Lanka99.5%
 Afghanistan66.3%
Highest and lowest reading in Southern Asia.
- Middle Africa
75.2%
the middle country, of 8 measured · 9 members
 São Tomé and Príncipe95.4%
 Chad27.2%
Highest and lowest reading in Middle Africa.
- Eastern Asia
4 of 8 measured — too few for a middle: China, Mongolia, North Korea, South Korea.
 South Korea100.0%
 North Korea92.2%
Highest and lowest reading in Eastern Asia.
- Eastern Europe
3 of 10 measured — too few for a middle: Belarus, Bulgaria, Romania.
 Bulgaria99.7%Romania94.9%
Highest and lowest reading in Eastern Europe.
- Melanesia
4 of 5 measured — too few for a middle: Fiji, Papua New Guinea, Solomon Islands, Vanuatu.
Fiji99.7%Papua New Guinea54.7%Highest and lowest reading in Melanesia.
- Micronesia
2 of 7 measured — too few for a middle: Kiribati, Nauru.
 Nauru98.7%
 Kiribati86.1%
Highest and lowest reading in Micronesia.
- Northern Europe
2 of 13 measured — too few for a middle: Estonia, Finland.
 Finland99.9%
 Estonia99.4%
Highest and lowest reading in Northern Europe.
- Polynesia
3 of 7 measured — too few for a middle: Samoa, Tonga, Tuvalu.
 Tuvalu98.5%
 Samoa88.6%
Highest and lowest reading in Polynesia.
- Southern Africa
4 of 5 measured — too few for a middle: Botswana, Eswatini, Lesotho, South Africa.
Botswana99.7% Lesotho91.4%
Highest and lowest reading in Southern Africa.
03The whole field at once
The spread
125 countries, one dot each, on one scale — further right is a higher value. Half the countries are above 94.7%; a quarter are above 98.7%, and a quarter below 81.2%. The bar in each row marks that continent’s middle country.
04All 171 ever measured
Every country
In order, highest value first. No rank or position is shown: too many countries share the same value for an order to mean anything. Most countries are at or near 100%, so the top of the table cannot be told apart and no position is derived; the measure separates the countries where many women still give birth at home. High-income countries rarely run these surveys, so many of them are missing or show an old reading.
Showing 25 of 171 countries







































































































































Values for the 2025 edition.
05In this edition
Births in a health facility in records
The extremes of the statistic. A record reached by more than one country names none of them.
Highest reading
Reached 4 times by 4 countries — shared, so no holder is named
100.0%
Live births delivered in a health facility (%)
Lowest reading
20.7%
Live births delivered in a health facility (%)
06The measure
About births in a health facility
This is the share of births that take place in a hospital, clinic or other health facility rather than at home. A facility birth is the main route to a skilled attendant and to emergency care if something goes wrong, which is why it is tracked alongside maternal and newborn deaths.
What the number is: Live births delivered in a health facility (%).
07Where it fits
Connections
Its part in the Country Index, the statistics whose values line up most closely with it across countries, and others on the same subject.
In the Country Index
Context, with no vote
This statistic is published in full under Health & Wellbeing and Gender & Equality, but does not help decide any Country Index standing.
Health & WellbeingGender & EqualityWhich statistics vote, and why
Moves with
Where births in a health facility is higher, these tend to be higher too.
- Postnatal Care for Newborns Within Two DaysUNICEF · 97 countries in commonρ 0.86
- Completeness of Birth RegistrationUNICEF · 118 countries in commonρ 0.82
- Primary Completion RateUIS · 116 countries in commonρ 0.81
Moves against
Where births in a health facility is higher, these tend to be lower.
- Stunting Prevalence in Children Under FiveKeyUNICEF, WHO and World Bank Group (Joint Malnutrition Estimates) · 117 countries in commonρ −0.83
- Global Multidimensional Poverty IndexOPHI · 102 countries in commonρ −0.81
- Children's Climate Risk IndexUNICEF · 108 countries in commonρ −0.79
Rank correlation (ρ, from −1 to 1) across countries, on each statistic’s newest edition, out of 325 statistics sharing at least 80 countries with this one. Two statistics that move together do not cause each other.
08Keep reading
Explore further
The subject
The data, edition by edition
09Questions
Births in a health facility: questions and answers
Which country has the highest births in a health facility?
4 countries share the highest reading, 100.0%, among the 125 compared in the 2025 edition, so no single country is named.
Which country has the lowest births in a health facility?
Somalia, at 20.7%, among the 125 countries compared in the 2025 edition.
How many countries does the Institutional Deliveries cover?
125 in the 2025 edition, and 171 at least once across all editions.
What is the world average births in a health facility?
This site does not calculate a world average, which would depend on how countries are weighted. In the middle country of the 125 compared in the 2025 edition, the figure was 94.7%.
Is this UNICEF’s own ranking?
No ranking is shown. UNICEF publishes values only, and too many countries share the same value for an ordering to mean anything, so none is derived.
How often is the Institutional Deliveries published?
This site holds one edition, describing 2025.
Where does the data come from, and can I download it?
From UNICEF, under CC BY 3.0 IGO. From UNICEF's Maternal and Newborn Health Coverage Database, read from UNICEF's own data warehouse. Where a country has several surveys, UNICEF's own priority flag decides which is used. Every edition is on this site’s Datasets pages as a full table, and downloads as a CSV file with every value unrounded.
10Method
Sources, method and citation
Source
Institutional Deliveries — UNICEF
From UNICEF's Maternal and Newborn Health Coverage Database, read from UNICEF's own data warehouse. Where a country has several surveys, UNICEF's own priority flag decides which is used.
Newest edition
Report year 2025Data year not recorded
Cite the source as: UNICEF. Maternal and Newborn Health Coverage Database. New York: UNICEF.
Licence: CC BY 3.0 IGO, checked 2026-10-03.
How this page reads the numbers
- No rank or position is shown: UNICEF publishes values only, and too many countries share the same value for an ordering to mean anything.
- Which end is better follows the publisher’s own reading of the measure.
- A country is named at an end only when it holds that value alone. Where several share it, the page says how many and names none first.
- The file gives each country’s most recent reading, so the rows are from different years. Readings from before 2015 are listed but left out of every comparison on this page.
- Values are stored exactly as published and trimmed only for display. “The middle country” is the median of the countries measured, not a world average.
The file itself, column by column — where it came from, what each column holds, and every edition as a CSV — is on its dataset page.
Cite this page
Nations Inquiry (2026). Births in a health facility by country: Institutional Deliveries, data from UNICEF. https://nationsinquiry.com/statistics/institutional-deliveries