UNICEF, WHO and World Bank Group (Joint Malnutrition Estimates) · Stunting Prevalence in Children Under Five
Child stunting by country
What share of young children are too short for their age?
Of the 134 countries compared in the 2024 edition, Latvia had the lowest reading, 0.5179%, and Burundi had the highest reading, 52.8000%. In the middle country the figure was 14.2796%. 28 readings from before 2014 are listed but not compared.
Share
Child stunting · the 2024 edition
Key statistic · Health & Wellbeing

Lowest of 134Latvia
0.5179%01the 2024 edition · position · derived
Who leads
The three countries at the lowest end of 134 compared, the three at the other end, and the first on each continent.
 1
Photo: Marcin Szala · CC BY-SA 3.0, greyscale
 2
Photo: Unknown author · CC BY-SA 2.0, greyscale
 3
Photo: (Jan Mehlich) · CC BY-SA 3.0, greyscale

Lowest on each continent
- Africa
 Cabo Verde6.0000%
- Americas
 Chile1.8000%
- Asia
 South Korea0.8518%
- EuropeLatvia0.5179%
- Oceania
 Tonga2.1767%
- Every region
02Every measured country
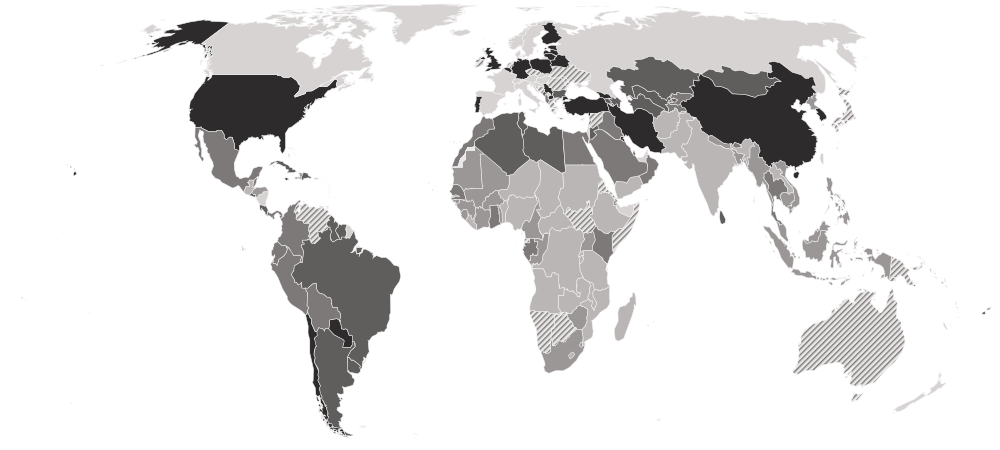
Child stunting on a map
Each country is shaded by its value, in five groups holding the same number of countries. Hover a country for its value, or select it to open its profile. Below the map, each continent’s middle country.
Darker is a lower value — the better end.
- 29.8266–52.8000%
- 18.1659–28.9317%
- 10.8483–17.9000%
- 6.0000–10.5000%
- 0.5179–5.9652%
- Hatched: a reading from before 2014, listed but not compared (28)
- No reading in the 2024 edition
- Europe
2.3778%
the middle country, of 16 measured · 49 members
Latvia0.5179% Albania11.3233%
Lowest and highest reading in Europe.
- Americas
9.2635%
the middle country, of 24 measured · 48 members
Chile1.8000% Guatemala46.0000%
Lowest and highest reading in Americas.
- Oceania
11.2363%
the middle country, of 8 measured · 21 members
Tonga2.1767% Marshall Islands34.7802%
Lowest and highest reading in Oceania.
- Asia
13.1715%
the middle country, of 40 measured · 52 members
South Korea0.8518% Yemen48.5428%
Lowest and highest reading in Asia.
- Africa
25.6860%
the middle country, of 46 measured · 55 members
Cabo Verde6.0000% Burundi52.8000%
Lowest and highest reading in Africa.
- Every region
21 sub-regions, lowest middle country first
- Northern Europe
1.2116%
the middle country, of 5 measured · 13 members
Latvia0.5179% Finland2.8000%
Lowest and highest reading in Northern Europe.
- Southern Europe
4.8648%
the middle country, of 6 measured · 17 members
 Portugal3.2468%Albania11.3233%
Lowest and highest reading in Southern Europe.
- Caribbean
6.7171%
the middle country, of 5 measured · 24 members
 Turks and Caicos Islands4.6103%
 Haiti21.9823%
Lowest and highest reading in Caribbean.
- Central Asia
8.0358%
the middle country, of 5 measured · 5 members
 Uzbekistan6.5061%
 Kyrgyzstan14.1487%
Lowest and highest reading in Central Asia.
- South America
8.6827%
the middle country, of 11 measured · 12 members
Chile1.8000% Ecuador17.4475%
Lowest and highest reading in South America.
- Western Asia
8.7034%
the middle country, of 13 measured · 19 members
 Kuwait3.2053%Yemen48.5428%
Lowest and highest reading in Western Asia.
- Northern Africa
11.3176%
the middle country, of 6 measured · 6 members
 Libya7.9477%
 Sudan38.2435%
Lowest and highest reading in Northern Africa.
- Central America
14.9579%
the middle country, of 7 measured · 8 members
 Costa Rica8.9996%Guatemala46.0000%
Lowest and highest reading in Central America.
- South-eastern Asia
22.0091%
the middle country, of 9 measured · 11 members
 Thailand12.4493%
 Timor-Leste46.6885%
Lowest and highest reading in South-eastern Asia.
- Southern Asia
23.5593%
the middle country, of 9 measured · 9 members
 Iran4.8000%
 Afghanistan44.6043%
Lowest and highest reading in Southern Asia.
- Western Africa
25.1000%
the middle country, of 16 measured · 16 members
Cabo Verde6.0000% Niger47.7003%
Lowest and highest reading in Western Africa.
- Middle Africa
30.4255%
the middle country, of 8 measured · 9 members
 São Tomé and Príncipe11.7359%
 DR Congo44.7000%
Lowest and highest reading in Middle Africa.
- Eastern Africa
33.1169%
the middle country, of 13 measured · 19 members
 Kenya17.5953%Burundi52.8000%
Lowest and highest reading in Eastern Africa.
- Eastern Asia
4 of 8 measured — too few for a middle: China, Mongolia, North Korea, South Korea.
South Korea0.8518% North Korea19.1000%
Lowest and highest reading in Eastern Asia.
- Eastern Europe
3 of 10 measured — too few for a middle: Belarus, Bulgaria, Poland.
 Poland1.0463%
 Bulgaria7.0000%
Lowest and highest reading in Eastern Europe.
- Melanesia
2 of 5 measured — too few for a middle: Fiji, Solomon Islands.
 Fiji7.1966%
 Solomon Islands31.6855%
Lowest and highest reading in Melanesia.
- Micronesia
3 of 7 measured — too few for a middle: Kiribati, Marshall Islands, Nauru.
 Kiribati15.1794%Marshall Islands34.7802%
Lowest and highest reading in Micronesia.
- Northern America
1 of 4 measured — too few for a middle: United States.
 United States3.8000%
Lowest and highest reading in Northern America.
- Polynesia
3 of 7 measured — too few for a middle: Samoa, Tonga, Tuvalu.
Tonga2.1767%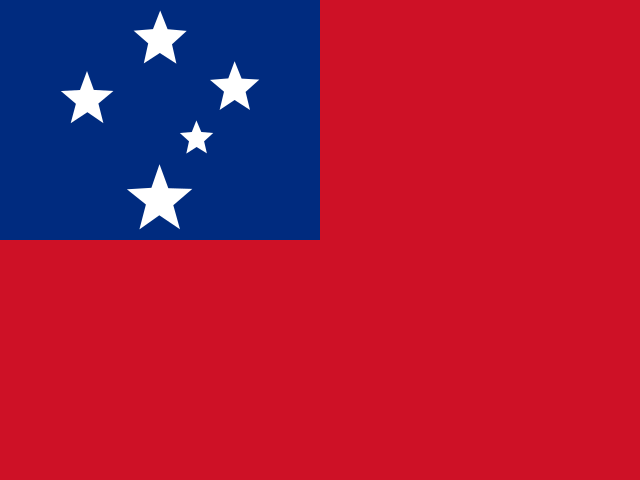 Samoa7.2932%
Lowest and highest reading in Polynesia.
- Southern Africa
3 of 5 measured — too few for a middle: Eswatini, Lesotho, South Africa.
 Eswatini20.0277%
 Lesotho35.5652%
Lowest and highest reading in Southern Africa.
- Western Europe
2 of 9 measured — too few for a middle: Belgium, Germany.
 Germany1.2812%
 Belgium1.9000%
Lowest and highest reading in Western Europe.
03The whole field at once
The spread
134 countries, one dot each, on one scale — further right is a higher value. Half the countries are above 14.2796%; a quarter are above 25.7930%, and a quarter below 7.1357%. The bar in each row marks that continent’s middle country.
04All 162 ever measured
Every country
In order, highest value first — position 1 is the highest value, the way UNICEF, WHO and World Bank Group (Joint Malnutrition Estimates)’s own tables read. “=” marks a position shared with another country. UNICEF, WHO and World Bank Group (Joint Malnutrition Estimates) ranks nobody on this measure; the position is derived here by ordering the published values. This is a cumulative measure, not a current one. It describes the conditions today's under-fives were born into, so it lags improvements in food supply or income by years — a country that has recently escaped a crisis will still read high here.
Showing 25 of 162 countries





















































































































Values for the 2024 edition.
05In this edition
Child stunting in records
The extremes of the statistic. A record reached by more than one country names none of them.
Highest reading
52.8000%
Children under 5 who are stunted (%)
UNICEF, WHO and World Bank Group (Joint Malnutrition Estimates) · 2024
Lowest reading
0.5179%
Children under 5 who are stunted (%)
UNICEF, WHO and World Bank Group (Joint Malnutrition Estimates) · 2024
06The measure
About child stunting
Stunting is when a child is too short for their age because of chronic undernutrition. It is the most telling single measure of early-childhood deprivation, because the damage it records — to growth, to the developing brain — is largely permanent.
What the number is: Children under 5 who are stunted (%).
07Where it fits
Connections
Its part in the Country Index, the statistics whose values line up most closely with it across countries, and others on the same subject.
In the Country Index
A key statistic for Health & Wellbeing
“Children under five who are too short for their age — the mark chronic undernutrition leaves on a body, which says what early deprivation did rather than how many died of it.”
- Edition used
- 2024 (data 2024)
- Countries
- 134
- Licence
- CC BY 3.0 IGO
Moves with
Where child stunting is higher, these tend to be higher too.
- Global Multidimensional Poverty IndexOPHI · 98 countries in commonρ 0.85
- Children's Climate Risk IndexUNICEF · 120 countries in commonρ 0.83
- Stillbirth RateUN IGME · 134 countries in commonρ 0.83
Moves against
Where child stunting is higher, these tend to be lower.
- Inequality-adjusted Human Development IndexUNDP Human Development Report Office · 121 countries in commonρ −0.85
- Human Development IndexKeyUNDP Human Development Report Office · 132 countries in commonρ −0.84
- Actual Individual Consumption per Capita (PPP)World Bank Group · 116 countries in commonρ −0.84
Rank correlation (ρ, from −1 to 1) across countries, on each statistic’s newest edition, out of 341 statistics sharing at least 80 countries with this one. Two statistics that move together do not cause each other.
08Analysis
Charts and analysis on child stunting
09Keep reading
Explore further
The data, edition by edition
More from UNICEF, WHO and World Bank Group (Joint Malnutrition Estimates)
10Questions
Child stunting: questions and answers
Which country has the lowest child stunting?
Latvia, at 0.5179%, among the 134 countries compared in the 2024 edition.
Which country has the highest child stunting?
Burundi, at 52.8000%, among the 134 countries compared in the 2024 edition.
How many countries does the Stunting Prevalence in Children Under Five cover?
134 in the 2024 edition, and 162 at least once across all editions.
What is the world average child stunting?
This site does not calculate a world average, which would depend on how countries are weighted. In the middle country of the 134 compared in the 2024 edition, the figure was 14.2796%.
Is this UNICEF, WHO and World Bank Group (Joint Malnutrition Estimates)’s own ranking?
No. UNICEF, WHO and World Bank Group (Joint Malnutrition Estimates) publishes the values but ranks nobody; the position on this page is derived by Nations Inquiry by ordering the published values, and equal values share a position.
How often is the Stunting Prevalence in Children Under Five published?
This site holds one edition, describing 2024.
Where does the data come from, and can I download it?
From UNICEF, WHO and World Bank Group (Joint Malnutrition Estimates), under CC BY 3.0 IGO. A Joint Malnutrition Estimate of UNICEF, WHO and the World Bank, read from UNICEF's warehouse. Where a country has several surveys, UNICEF's own priority flag decides which is used. Every edition is on this site’s Datasets pages as a full table, and downloads as a CSV file with every value unrounded.
11Method
Sources, method and citation
Source
Stunting Prevalence in Children Under Five — UNICEF, WHO and World Bank Group (Joint Malnutrition Estimates)
A Joint Malnutrition Estimate of UNICEF, WHO and the World Bank, read from UNICEF's warehouse. Where a country has several surveys, UNICEF's own priority flag decides which is used.
Newest edition
Report year 2024Data year not recorded
Cite the source as: UNICEF, WHO and World Bank Group. Joint Child Malnutrition Estimates. New York, Geneva and Washington, DC.
Licence: CC BY 3.0 IGO, checked 2026-09-10.
How this page reads the numbers
- UNICEF, WHO and World Bank Group (Joint Malnutrition Estimates) ranks nobody on this measure. The position is derived by Nations Inquiry by ordering the published values; equal values share a position.
- Which end is better follows the publisher’s own reading of the measure.
- A country is named at an end only when it holds that value alone. Where several share it, the page says how many and names none first.
- The file gives each country’s most recent reading, so the rows are from different years. Readings from before 2014 are listed but left out of every comparison on this page.
- Values are stored exactly as published and trimmed only for display. “The middle country” is the median of the countries measured, not a world average.
The file itself, column by column — where it came from, what each column holds, and every edition as a CSV — is on its dataset page.
Photographs
The countries at the top of this statistic, from their profiles: Wikimedia Commons, shown in greyscale, each used under the licence named.
- Latvia — Marcin Szala, CC BY-SA 3.0
- South Korea — Unknown author, CC BY-SA 2.0
- Lithuania — (Jan Mehlich), CC BY-SA 3.0
Cite this page
Nations Inquiry (2026). Child stunting by country: Stunting Prevalence in Children Under Five, data from UNICEF, WHO and World Bank Group (Joint Malnutrition Estimates). https://nationsinquiry.com/statistics/stunting