UIS · Wealth Parity Index, Lower Secondary Completion
Rich–poor gap in school completion by country
Do children from the poorest households finish lower secondary school as often as those from the richest?
Of the 97 countries compared in the 2024 edition, Tajikistan had the reading closest to parity, 0.99783, and Madagascar had the reading furthest from parity, 0.03152. In the middle country the figure was 0.42779. 14 readings from before 2014 are listed but not compared.
Share
Rich–poor gap in school completion · the 2024 edition
Context statistic

Closest to parity of 97Tajikistan
0.9978301the 2024 edition · values only
Who leads
The three countries at the closest to parity end of 97 compared, the three at the other end, and the first on each continent.
 1
1Photo: Hylgeriak · CC BY-SA 3.0, greyscale
 2
2Photo: Jean-Pierre Dalbéra · CC BY 2.0, greyscale
 3
3Photo: Stefano Brivio · CC BY 2.0, greyscale

Furthest from parity in the 2024 edition
 Madagascar0.03152
 Central African Republic0.03278
 Angola0.04760
Where a country sits says how it compares with the others measured, and nothing about why.
Closest to parity on each continent
- Africa
 Egypt0.83595
 - Americas
 United States0.99424
 - AsiaTajikistan0.99783
- Europe
 Belarus0.99371
 - Oceania
 Australia0.98319
 - Every region
02Every measured country
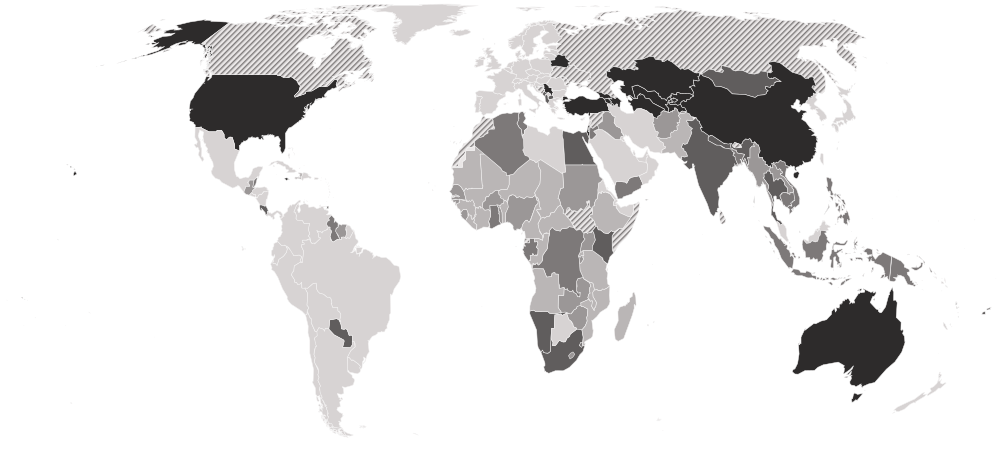
Rich–poor gap in school completion on a map
Each country is shaded by its value, in five groups holding the same number of countries. Hover a country for its value, or select it to open its profile. Below the map, each continent’s middle country.
Darker is closer to parity (1.000), from either side.
- 0.96848–0.83893 from parity
- 0.82777–0.66561 from parity
- 0.66547–0.31491 from parity
- 0.30824–0.12438 from parity
- 0.12389–0.00217 from parity
- Hatched: a reading from before 2014, listed but not compared (14)
- No reading in the 2024 edition
- Europe
0.86928
the middle country, of 5 measured · 49 members
Belarus0.99371 Montenegro0.77611
Closest to parity and furthest from parity reading in Europe.
- Oceania
0.81684
the middle country, of 9 measured · 21 members
Australia0.98319 Vanuatu0.23170
Closest to parity and furthest from parity reading in Oceania.
- Asia
0.76329
the middle country, of 30 measured · 52 members
Tajikistan0.99783 Pakistan0.15527
Closest to parity and furthest from parity reading in Asia.
- Americas
0.73695
the middle country, of 10 measured · 48 members
United States0.99424 Haiti0.11626
Closest to parity and furthest from parity reading in Americas.
- Africa
0.19640
the middle country, of 43 measured · 55 members
Egypt0.83595Madagascar0.03152Closest to parity and furthest from parity reading in Africa.
- Every region
20 sub-regions, closest to parity middle country first
- Central Asia
0.98106
the middle country, of 5 measured · 5 members
Tajikistan0.99783 Kazakhstan0.97529
Closest to parity and furthest from parity reading in Central Asia.
- Western Asia
0.93167
the middle country, of 9 measured · 19 members
 Israel0.98846
 Iraq0.31709
Closest to parity and furthest from parity reading in Western Asia.
- Southern Asia
0.64437
the middle country, of 6 measured · 9 members
 Maldives0.85964Pakistan0.15527
Closest to parity and furthest from parity reading in Southern Asia.
- South-eastern Asia
0.50086
the middle country, of 8 measured · 11 members
 Thailand0.80644
 Myanmar0.17223
Closest to parity and furthest from parity reading in South-eastern Asia.
- Western Africa
0.17964
the middle country, of 15 measured · 16 members
 Ghana0.40685
 Mali0.05484
Closest to parity and furthest from parity reading in Western Africa.
- Eastern Africa
0.17874
the middle country, of 12 measured · 19 members
 Kenya0.69176Madagascar0.03152
Closest to parity and furthest from parity reading in Eastern Africa.
- Middle Africa
0.08979
the middle country, of 8 measured · 9 members
 DR Congo0.42779Central African Republic0.03278
Closest to parity and furthest from parity reading in Middle Africa.
- Australia and New Zealand
1 of 2 measured — too few for a middle: Australia.
Australia0.98319Closest to parity and furthest from parity reading in Australia and New Zealand.
- Caribbean
3 of 24 measured — too few for a middle: Haiti, Jamaica, Trinidad and Tobago.
 Jamaica0.93565Haiti0.11626
Closest to parity and furthest from parity reading in Caribbean.
- Central America
3 of 8 measured — too few for a middle: Belize, Costa Rica, Guatemala.
 Costa Rica0.87562
 Guatemala0.17649
Closest to parity and furthest from parity reading in Central America.
- Eastern Asia
2 of 8 measured — too few for a middle: China, Mongolia.
 China0.90582
 Mongolia0.84430
Closest to parity and furthest from parity reading in Eastern Asia.
- Eastern Europe
1 of 10 measured — too few for a middle: Belarus.
Belarus0.99371Closest to parity and furthest from parity reading in Eastern Europe.
- Melanesia
3 of 5 measured — too few for a middle: Fiji, Papua New Guinea, Vanuatu.
 Fiji0.81684Vanuatu0.23170
Closest to parity and furthest from parity reading in Melanesia.
- Micronesia
2 of 7 measured — too few for a middle: Kiribati, Nauru.
 Nauru0.79265
 Kiribati0.69193
Closest to parity and furthest from parity reading in Micronesia.
- Northern Africa
4 of 6 measured — too few for a middle: Algeria, Egypt, Sudan, Tunisia.
Egypt0.83595 Sudan0.17853
Closest to parity and furthest from parity reading in Northern Africa.
- Northern America
1 of 4 measured — too few for a middle: United States.
United States0.99424Closest to parity and furthest from parity reading in Northern America.
- Polynesia
3 of 7 measured — too few for a middle: Samoa, Tonga, Tuvalu.
 Samoa0.96813
 Tuvalu0.81722
Closest to parity and furthest from parity reading in Polynesia.
- South America
3 of 12 measured — too few for a middle: Guyana, Paraguay, Suriname.
 Paraguay0.80488
 Suriname0.30183
Closest to parity and furthest from parity reading in South America.
- Southern Africa
4 of 5 measured — too few for a middle: Eswatini, Lesotho, Namibia, South Africa.
 South Africa0.74648
 Lesotho0.23035
Closest to parity and furthest from parity reading in Southern Africa.
- Southern Europe
4 of 17 measured — too few for a middle: Albania, Montenegro, North Macedonia, Serbia.
 Serbia0.93305Montenegro0.77611
Closest to parity and furthest from parity reading in Southern Europe.
03The whole field at once
The spread
97 countries, one dot each, on one scale — further right is a higher value. Half the countries are above 0.42779; a quarter are above 0.83641, and a quarter below 0.18006. The bar in each row marks that continent’s middle country.
04All 111 ever measured
Every country
In order, closest to parity first. No rank or position is shown: too many countries share the same value for an order to mean anything. Rows are ordered by distance from parity, closest first. The readings come from different household surveys and different years, and most high-income countries run no such survey, so the table is a set of surveyed countries rather than the world, and no position is derived. Most Latin American countries are absent because their figures come from a regional commission whose terms do not permit reuse. Readings more than ten years older than the edition are listed but not compared.
Showing 25 of 111 countries








































































Values for the 2024 edition.
05In this edition
Rich–poor gap in school completion in records
The extremes of the statistic. A record reached by more than one country names none of them.
Highest reading
1.02222
Adjusted wealth parity index, lower secondary completion (poorest vs richest fifth; 1 = parity)
Lowest reading
0.03152
Adjusted wealth parity index, lower secondary completion (poorest vs richest fifth; 1 = parity)
06The measure
About rich–poor gap in school completion
This index compares how often young people from the poorest fifth of households complete lower secondary school with how often those from the richest fifth do. 1 means the two complete at the same rate; 0.5 means the poorest complete at half the rate of the richest. It is part of SDG indicator 4.5.1, the measure of equity in education.
What the number is: Adjusted wealth parity index, lower secondary completion (poorest vs richest fifth; 1 = parity).
07Where it fits
Connections
Its part in the Country Index, the statistics whose values line up most closely with it across countries, and others on the same subject.
In the Country Index
Context, with no vote
This statistic is published in full under Education & Knowledge and Poverty & Inequality, but does not help decide any Country Index standing.
Education & KnowledgePoverty & InequalityWhich statistics vote, and why
Moves with
Where rich–poor gap in school completion is higher, these tend to be higher too.
- Lower Secondary Completion RateUIS · 97 countries in commonρ 0.91
- Primary Completion RateUIS · 97 countries in commonρ 0.89
- Upper Secondary Completion RateKeyUIS · 97 countries in commonρ 0.88
Moves against
Where rich–poor gap in school completion is higher, these tend to be lower.
- Global Multidimensional Poverty IndexOPHI · 88 countries in commonρ −0.87
- Coefficient of Human InequalityUNDP Human Development Report Office · 91 countries in commonρ −0.83
- Gender Inequality IndexUNDP Human Development Report Office · 91 countries in commonρ −0.81
Rank correlation (ρ, from −1 to 1) across countries, on each statistic’s newest edition, out of 266 statistics sharing at least 80 countries with this one. Two statistics that move together do not cause each other.
08Keep reading
Explore further
The subject
The data, edition by edition
The countries at either end
09Questions
Rich–poor gap in school completion: questions and answers
Which country is closest to parity on the rich–poor gap in school completion?
Tajikistan, at 0.99783, among the 97 countries compared in the 2024 edition.
How many countries does the Wealth Parity Index, Lower Secondary Completion cover?
97 in the 2024 edition, and 111 at least once across all editions.
What is the world average rich–poor gap in school completion?
This site does not calculate a world average, which would depend on how countries are weighted. In the middle country of the 97 compared in the 2024 edition, the figure was 0.42779.
Is this UNESCO Institute for Statistics (UIS)’s own ranking?
No ranking is shown. UNESCO Institute for Statistics (UIS) publishes values only, and too many countries share the same value for an ordering to mean anything, so none is derived.
How often is the Wealth Parity Index, Lower Secondary Completion published?
This site holds one edition, describing 2024.
Where does the data come from, and can I download it?
From UNESCO Institute for Statistics (UIS), under CC BY-SA 4.0. From the UNESCO Institute for Statistics (CR.2.WPIA), each country's latest available reading, with UIS's own footnote naming the survey behind it. Readings UIS took from the UN Economic Commission for Latin America and the Caribbean are left out. Every edition is on this site’s Datasets pages as a full table, and downloads as a CSV file with every value unrounded.
10Method
Sources, method and citation
Source
Wealth Parity Index, Lower Secondary Completion — UNESCO Institute for Statistics (UIS)
From the UNESCO Institute for Statistics (CR.2.WPIA), each country's latest available reading, with UIS's own footnote naming the survey behind it. Readings UIS took from the UN Economic Commission for Latin America and the Caribbean are left out.
Newest edition
Report year 2024Data year not recorded
Cite the source as: UNESCO Institute for Statistics. UIS Data Browser. Montreal: UNESCO Institute for Statistics.
Licence: CC BY-SA 4.0, checked 2026-10-03.
How this page reads the numbers
- No rank or position is shown: UNESCO Institute for Statistics (UIS) publishes values only, and too many countries share the same value for an ordering to mean anything.
- Which end is better follows the publisher’s own reading of the measure.
- A country is named at an end only when it holds that value alone. Where several share it, the page says how many and names none first.
- The file gives each country’s most recent reading, so the rows are from different years. Readings from before 2014 are listed but left out of every comparison on this page.
- Values are stored exactly as published and trimmed only for display. “The middle country” is the median of the countries measured, not a world average.
The file itself, column by column — where it came from, what each column holds, and every edition as a CSV — is on its dataset page.
Photographs
The countries at the top of this statistic, from their profiles: Wikimedia Commons, shown in greyscale, each used under the licence named.
- Tajikistan — Hylgeriak, CC BY-SA 3.0
- Uzbekistan — Jean-Pierre Dalbéra, CC BY 2.0
- United States — Stefano Brivio, CC BY 2.0
Cite this page
Nations Inquiry (2026). Rich–poor gap in school completion by country: Wealth Parity Index, Lower Secondary Completion, data from UNESCO Institute for Statistics (UIS). https://nationsinquiry.com/statistics/lower-secondary-wealth-parity