World Bank Group · Country Policy and Institutional Assessment
Policy and institutional rating (CPIA) by country
How good are a borrowing country's policies and institutions, by the World Bank's own rating?
Rwanda placed first of the 78 countries compared in 2025, at 4.225, and Sudan last, at 1.617. In the middle country the figure was 3.246. Among the 62 countries measured in every edition since 2005, the middle one moved from 3.304 to 3.263.
Share
Policy and institutional rating (CPIA) · 2025
Context statistic


Highest of 78Rwanda
4.225012025 · position · derived
Who leads
The three countries at the highest end of 78 compared, the three at the other end, and the first on each continent.
 1
Photo: Peace Batuma · CC BY-SA 4.0, greyscale
 2
Photo: The original uploader was Marko Markovic at English Wikipedia . derivative work: Jjtkk · CC BY-SA 3.0, greyscale
 3
Photo: Axe derivative work: Jjtkk · CC BY-SA 3.0, greyscale
Lowest in 2025
- 78
 Sudan1.617
- 77
 South Sudan1.625
- 76
 Syria1.683
Positions out of 78. Where a country sits says how it compares with the others measured, and nothing about why.
Highest on each continent
- AfricaRwanda4.225
- Americas
 Saint Lucia3.733
- Asia
 Uzbekistan3.842
- Europe
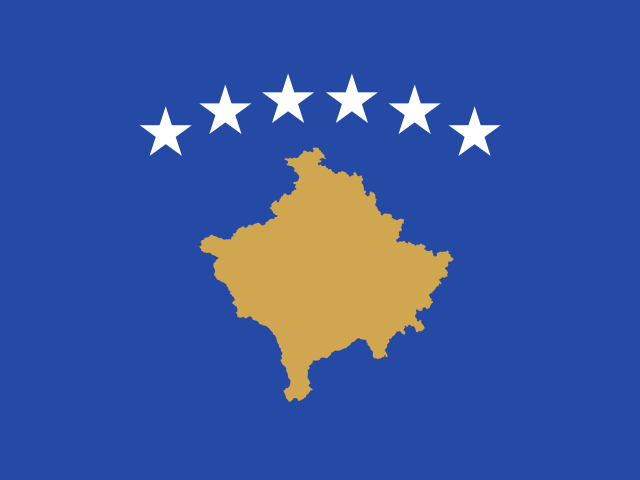 Kosovo3.967
1 of 49 measured
- Oceania
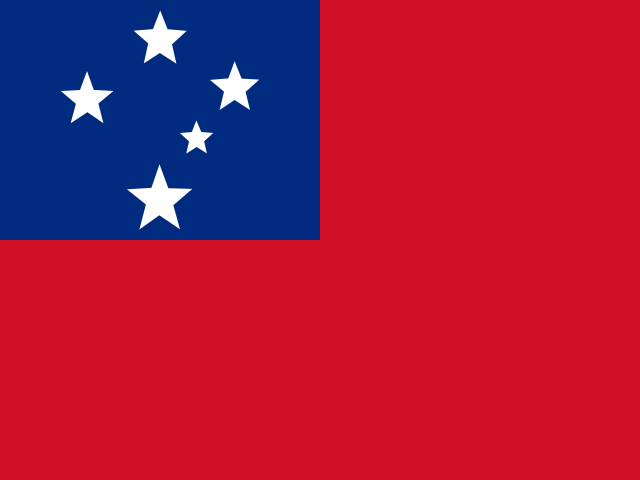 Samoa3.950
- Every region
02Every measured country
Policy and institutional rating (CPIA) on a map
Each country is shaded by its value, in five groups holding the same number of countries. Hover a country for its value, or select it to open its profile. Below the map, each continent’s middle country.
Darker is a higher value — the better end.
- 1.617–2.842
- 2.850–3.067
- 3.083–3.308
- 3.317–3.625
- 3.642–4.225
- No reading in 2025 (13 measured in an earlier edition)
- Americas
3.379
the middle country, of 10 measured · 48 members
Saint Lucia3.733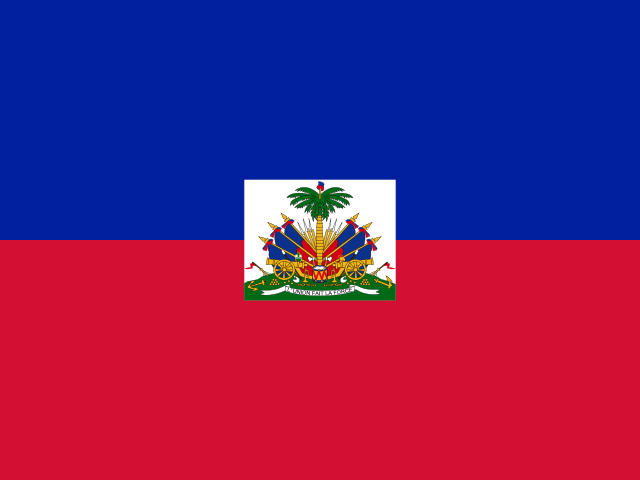 Haiti2.275
Highest and lowest reading in Americas.
- Africa
3.183
the middle country, of 41 measured · 55 members
Rwanda4.225Sudan1.617Highest and lowest reading in Africa.
- Asia
3.179
the middle country, of 16 measured · 52 members
Uzbekistan3.842Syria1.683Highest and lowest reading in Asia.
- Oceania
2.938
the middle country, of 10 measured · 21 members
Samoa3.950 Marshall Islands2.733
Highest and lowest reading in Oceania.
- Europe
1 of 49 measured — too few for a middle: Kosovo.
Kosovo3.967Highest and lowest reading in Europe.
- Every region
16 sub-regions, highest middle country first
- Caribbean
3.508
the middle country, of 5 measured · 24 members
Saint Lucia3.733Haiti2.275Highest and lowest reading in Caribbean.
- Western Africa
3.421
the middle country, of 16 measured · 16 members
 Côte d’Ivoire3.950
 Guinea-Bissau2.658
Highest and lowest reading in Western Africa.
- Southern Asia
3.308
the middle country, of 7 measured · 9 members
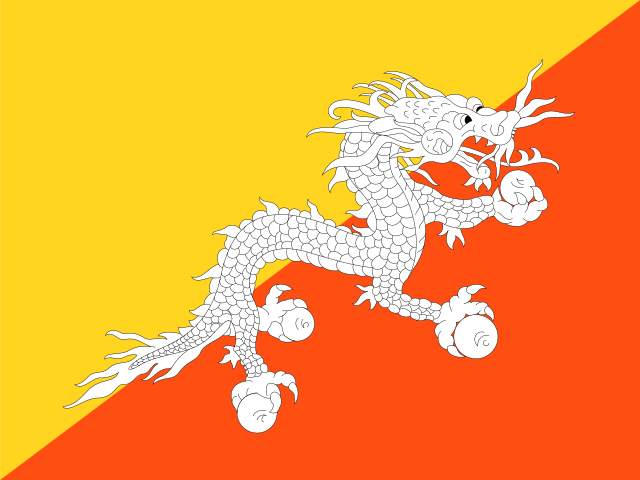 Bhutan3.800
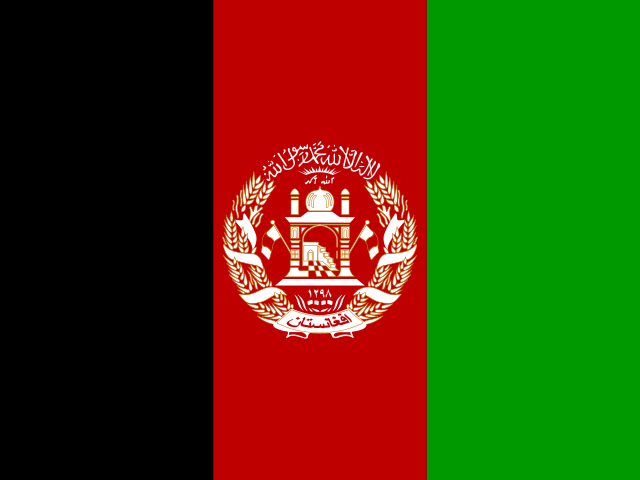 Afghanistan1.767
Highest and lowest reading in Southern Asia.
- Eastern Africa
3.117
the middle country, of 16 measured · 19 members
Rwanda4.225South Sudan1.625Highest and lowest reading in Eastern Africa.
- Middle Africa
2.938
the middle country, of 6 measured · 9 members
 Cameroon3.325
 Central African Republic2.583
Highest and lowest reading in Middle Africa.
- Central America
3 of 8 measured — too few for a middle: Belize, Honduras, Nicaragua.
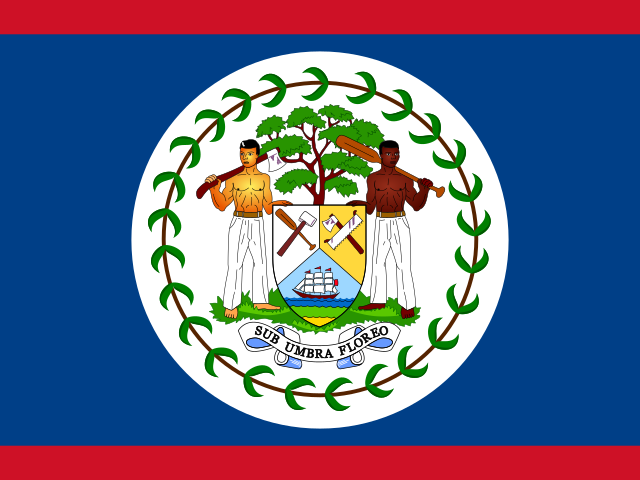 Belize3.317
 Nicaragua3.025
Highest and lowest reading in Central America.
- Central Asia
3 of 5 measured — too few for a middle: Kyrgyzstan, Tajikistan, Uzbekistan.
Uzbekistan3.842 Tajikistan3.275
Highest and lowest reading in Central Asia.
- Melanesia
4 of 5 measured — too few for a middle: Fiji, Papua New Guinea, Solomon Islands, Vanuatu.
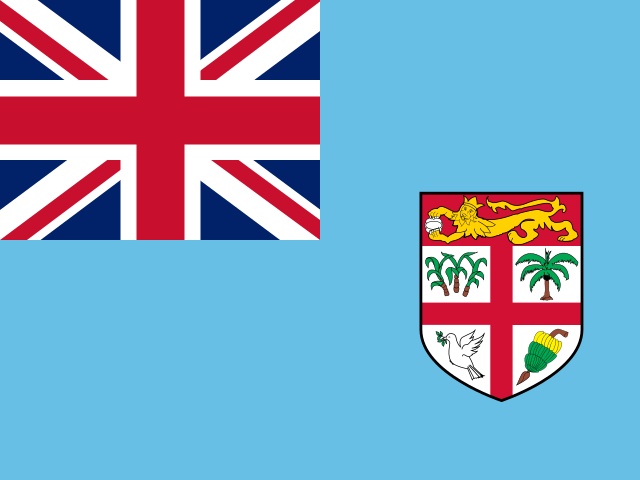 Fiji3.567
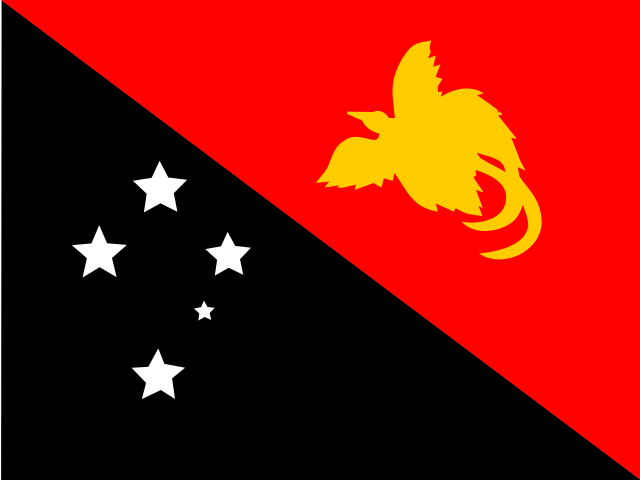 Papua New Guinea2.850
Highest and lowest reading in Melanesia.
- Micronesia
3 of 7 measured — too few for a middle: Kiribati, Marshall Islands, Micronesia.
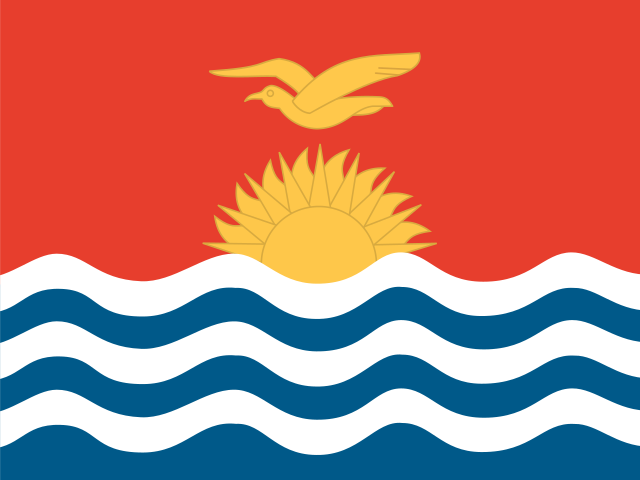 Kiribati2.892Marshall Islands2.733
Highest and lowest reading in Micronesia.
- Northern Africa
1 of 6 measured — too few for a middle: Sudan.
Sudan1.617Highest and lowest reading in Northern Africa.
- Polynesia
3 of 7 measured — too few for a middle: Samoa, Tonga, Tuvalu.
Samoa3.950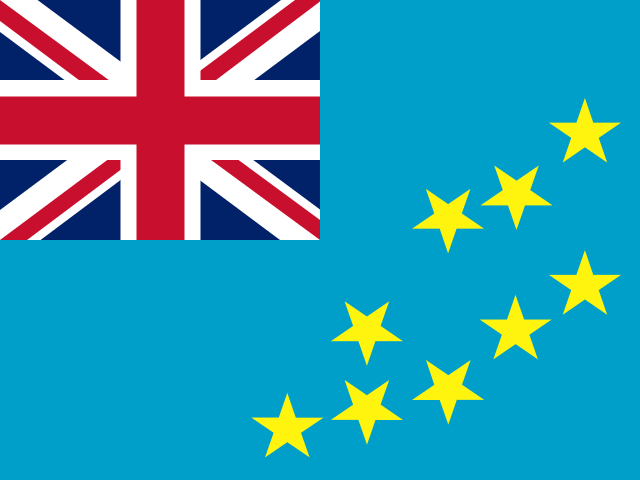 Tuvalu2.858
Highest and lowest reading in Polynesia.
- South America
2 of 12 measured — too few for a middle: Guyana, Suriname.
 Guyana3.458
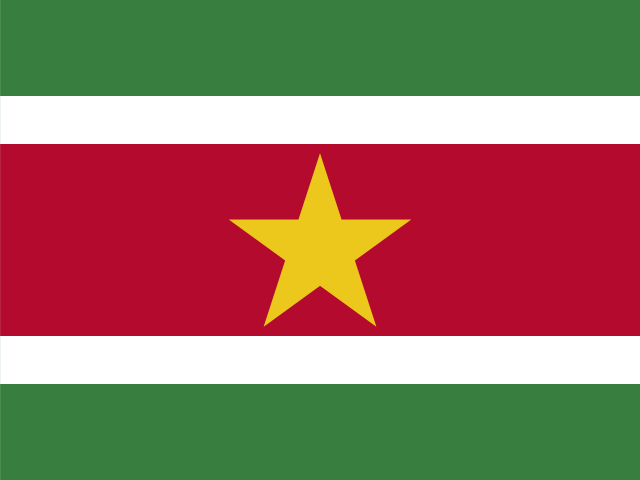 Suriname3.017
Highest and lowest reading in South America.
- South-eastern Asia
4 of 11 measured — too few for a middle: Cambodia, Laos, Myanmar, Timor-Leste.
 Cambodia3.550
 Myanmar1.917
Highest and lowest reading in South-eastern Asia.
- Southern Africa
2 of 5 measured — too few for a middle: Eswatini, Lesotho.
 Lesotho3.267
 Eswatini3.133
Highest and lowest reading in Southern Africa.
- Southern Europe
1 of 17 measured — too few for a middle: Kosovo.
Kosovo3.967Highest and lowest reading in Southern Europe.
- Western Asia
2 of 19 measured — too few for a middle: Syria, Yemen.
 Yemen1.817Syria1.683
Highest and lowest reading in Western Asia.
03The whole field at once
The spread
78 countries, one dot each, on one scale — further right is a higher value. Half the countries are above 3.246; a quarter are above 3.504, and a quarter below 2.879. The bar in each row marks that continent’s middle country.
04All 91 ever measured
Every country
In order, highest value first. “=” marks a position shared with another country. World Bank Group ranks nobody on this measure; the position is derived here by ordering the published values. The field is one group, not the world: only IDA-eligible countries are rated — roughly 75 low-income borrowers — so a country’s absence means it does not borrow from IDA, and reading a position here as a world rank would be wrong. It is also an assessment BY THE LENDER, scored by Bank staff, rather than a measurement of anything observable.
Showing 25 of 91 countries


























Values for 2025. The change column compares 2025 with 2024 only; the sparkline covers the recent editions.
052005–2025 · 21 editions
Over time
Each point is one annual assessment from 2005.
- the middle country
- the middle half of countries
- the middle of the 62 countries measured every time
- each continent’s middle country
The same, year by year
| Year | Countries | Middle country | Middle half | Measured every time |
|---|---|---|---|---|
| 2025 | 78 | 3.246 | 2.879 – 3.504 | 3.263 |
| 2024 | 77 | 3.192 | 2.867 – 3.508 | 3.233 |
| 2023 | 74 | 3.204 | 2.919 – 3.540 | 3.258 |
| 2022 | 74 | 3.217 | 2.927 – 3.477 | 3.271 |
| 2021 | 72 | 3.246 | 2.933 – 3.517 | 3.275 |
| 2020 | 73 | 3.250 | 2.933 – 3.533 | 3.292 |
| 2019 | 75 | 3.267 | 2.937 – 3.488 | 3.304 |
| 2018 | 73 | 3.242 | 2.925 – 3.492 | 3.271 |
| 2017 | 74 | 3.242 | 2.915 – 3.515 | 3.283 |
| 2016 | 73 | 3.242 | 2.967 – 3.517 | 3.296 |
| 2015 | 76 | 3.292 | 2.994 – 3.512 | 3.304 |
| 2014 | 76 | 3.346 | 3.040 – 3.537 | 3.362 |
| 2013 | 81 | 3.350 | 2.992 – 3.600 | 3.333 |
| 2012 | 80 | 3.379 | 2.998 – 3.658 | 3.363 |
| 2011 | 78 | 3.392 | 3.021 – 3.681 | 3.354 |
| 2010 | 77 | 3.392 | 3.025 – 3.725 | 3.358 |
| 2009 | 77 | 3.392 | 3.058 – 3.708 | 3.354 |
| 2008 | 75 | 3.400 | 3.000 – 3.700 | 3.300 |
| 2007 | 75 | 3.417 | 3.021 – 3.717 | 3.388 |
| 2006 | 78 | 3.396 | 2.994 – 3.690 | 3.321 |
| 2005 | 76 | 3.400 | 3.013 – 3.708 | 3.304 |
062024 → 2025
Who rose and fell
The biggest changes in value between the two newest editions. Places are shown second, because they also move when other countries do.
Improved most
before → after- Guyana3.225 → 3.458 · 34th → 24th+0.233
- Suriname2.792 → 3.017 · 64th → 52nd+0.225
 Chad2.750 → 2.933 · 65th → 57th+0.183
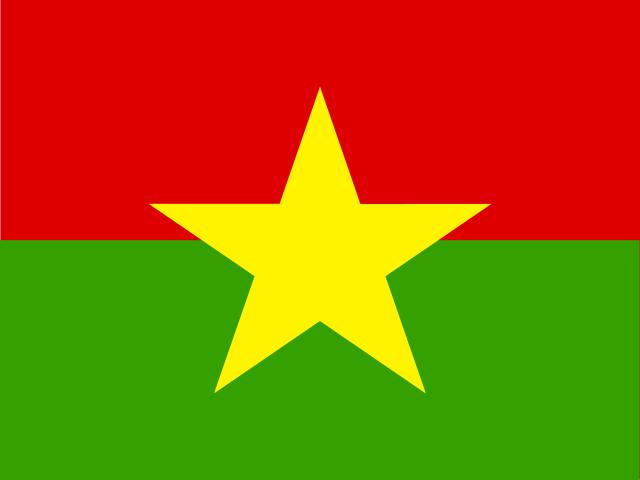 Burkina Faso3.400 → 3.533 · 24th → 18th+0.133
- Belize3.192 → 3.317 · 38th → 29th+0.125
Declined most
before → after- Sudan1.817 → 1.617 · 74th → 78th−0.200
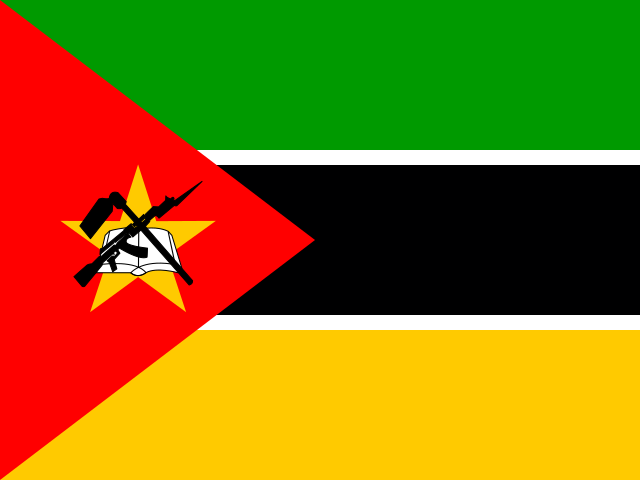 Mozambique3.050 → 2.858 · 50th → 60th−0.192
 Saint Vincent and the Grenadines3.592 → 3.442 · 14th → 25th−0.150
 Senegal3.617 → 3.508 · 13th → 19th−0.108
 Malawi2.958 → 2.875 · 55th → 59th−0.083
77 countries were measured in both 2024 and 2025. The field changed from 77 to 78 countries, so a place can move for reasons that have nothing to do with the country itself.
07Across every edition
Policy and institutional rating (CPIA) in records
The extremes of the statistic. A record reached by more than one country names none of them.
Highest reading on record
4.442
IDA Resource Allocation Index (1 = low to 6 = high)
Lowest reading on record
1.400
IDA Resource Allocation Index (1 = low to 6 = high)
Biggest improvement between editions
+0.458
1.400 → 1.858
Biggest decline between editions
−0.733
3.000 → 2.267
Most improved since first measured
+1.458
2.492 → 3.950
At the top most often
12 of 21
editions, alone at the first-listed end
08The measure
About policy and institutional rating (CPIA)
The Country Policy and Institutional Assessment is the World Bank’s own rating of how good a borrowing country’s policies and institutions are, averaged across sixteen criteria and scored from 1 to 6. It is what decides how much IDA money a country receives.
What the number is: IDA Resource Allocation Index (1 = low to 6 = high).
09Where it fits
Connections
Its part in the Country Index, the statistics whose values line up most closely with it across countries, and others on the same subject.
In the Country Index
Context, with no vote
This statistic is published in full under Governance & Institutions and Development & Human Capital, but does not help decide any Country Index standing.
Governance & InstitutionsDevelopment & Human CapitalWhich statistics vote, and why
Moves with
Where policy and institutional rating (CPIA) is higher, these tend to be higher too.
No statistic lines up this closely.
Moves against
Where policy and institutional rating (CPIA) is higher, these tend to be lower.
No statistic lines up this closely.
Rank correlation (ρ, from −1 to 1) across countries, on each statistic’s newest edition, out of 0 statistics sharing at least 80 countries with this one. Two statistics that move together do not cause each other.
10Keep reading
Explore further
The countries at either end
More from World Bank Group
11Questions
Policy and institutional rating (CPIA): questions and answers
Which country has the highest policy and institutional rating (CPIA)?
Rwanda, at 4.225, among the 78 countries compared in 2025.
Which country has the lowest policy and institutional rating (CPIA)?
Sudan, at 1.617, among the 78 countries compared in 2025.
How many countries does the Country Policy and Institutional Assessment cover?
78 in 2025, and 91 at least once across all editions. The number measured varies from 72 to 81 between editions.
What is the world average policy and institutional rating (CPIA)?
This site does not calculate a world average, which would depend on how countries are weighted. In the middle country of the 78 compared in 2025, the figure was 3.246.
Is this World Bank Group’s own ranking?
No. World Bank Group publishes the values but ranks nobody; the position on this page is derived by Nations Inquiry by ordering the published values, and equal values share a position.
How often is the Country Policy and Institutional Assessment published?
This site holds 21 editions, describing 2005 to 2025.
Where does the data come from, and can I download it?
From World Bank Group, under CC BY 4.0. Pulled from the World Bank’s indicator API (IQ.CPA.IRAI.XQ). The 2008 edition arrives rounded to one decimal where every other edition carries six or more, so that year alone ties ten deep. Every edition is on this site’s Datasets pages as a full table, and downloads as a CSV file with every value unrounded.
12Method
Sources, method and citation
Source
Country Policy and Institutional Assessment — World Bank Group
Pulled from the World Bank’s indicator API (IQ.CPA.IRAI.XQ). The 2008 edition arrives rounded to one decimal where every other edition carries six or more, so that year alone ties ten deep.
Newest edition
Report year 2025Data year 2025
Cite the source as: World Bank. Country Policy and Institutional Assessment (IDA Resource Allocation Index). Washington, DC: World Bank Group.
Licence: CC BY 4.0, checked 2026-09-06.
How this page reads the numbers
- World Bank Group ranks nobody on this measure. The position is derived by Nations Inquiry by ordering the published values; equal values share a position.
- Which end is better follows the publisher’s own reading of the measure.
- A country is named at an end only when it holds that value alone. Where several share it, the page says how many and names none first.
- Values are stored exactly as published and trimmed only for display. “The middle country” is the median of the countries measured, not a world average.
The file itself, column by column — where it came from, what each column holds, and every edition as a CSV — is on its dataset page.
Photographs
The countries at the top of this statistic, from their profiles: Wikimedia Commons, shown in greyscale, each used under the licence named.
- Rwanda — Peace Batuma, CC BY-SA 4.0
- Kosovo — The original uploader was Marko Markovic at English Wikipedia . derivative work: Jjtkk, CC BY-SA 3.0
- Côte d’Ivoire — Axe derivative work: Jjtkk, CC BY-SA 3.0
Cite this page
Nations Inquiry (2026). Policy and institutional rating (CPIA) by country: Country Policy and Institutional Assessment, data from World Bank Group. https://nationsinquiry.com/statistics/cpia