FAO · Crop Production Index
Crop production index by country
How much do a country's crops yield compared with its own recent past?
Senegal placed first of the 195 countries compared in 2022, at 189.93, and Malta last, at 53.79. In the middle country the figure was 106.23. Among the 163 countries measured in every edition since 1961, the middle one moved from 35.51 to 106.37.
Share
Crop production index · 2022
Context statistic

Highest of 195Senegal
189.93012022 · position · derived
Who leads
The three countries at the highest end of 195 compared, the three at the other end, and the first on each continent.
 1
 2
Photo: Mardetanha · CC BY-SA 3.0, greyscale
 3
Photo: David Holt London · CC BY-SA 2.0, greyscale
Highest on each continent
- AfricaSenegal189.93
- Americas
 Dominican Republic136.20
- Asia
 Saudi Arabia182.29
- Europe
 Russia133.67
- Oceania
 Australia146.08
- Every region
02Every measured country
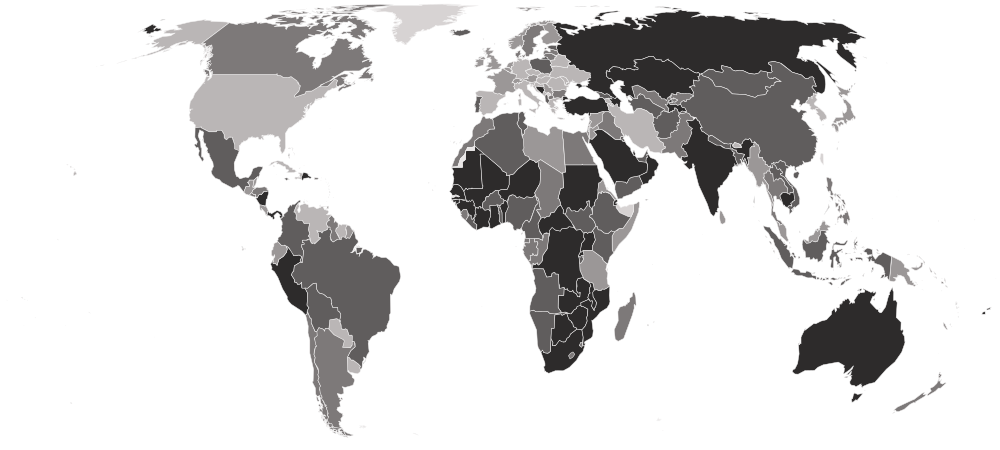
Crop production index on a map
Each country is shaded by its value, in five groups holding the same number of countries. Hover a country for its value, or select it to open its profile. Below the map, each continent’s middle country.
Darker is a higher value — the better end.
- 53.79–94.17
- 94.24–102.19
- 102.27–108.33
- 108.37–122.90
- 123.04–189.93
- No reading in 2022
- Africa
117.82
the middle country, of 54 measured · 55 members
Senegal189.93 Cabo Verde66.15
Highest and lowest reading in Africa.
- Asia
107.27
the middle country, of 50 measured · 52 members
Saudi Arabia182.29 Bhutan68.09
Highest and lowest reading in Asia.
- Americas
102.40
the middle country, of 36 measured · 48 members
Dominican Republic136.20 Cuba65.76
Highest and lowest reading in Americas.
- Oceania
102.19
the middle country, of 15 measured · 21 members
Australia146.08 Samoa84.07
Highest and lowest reading in Oceania.
- Europe
96.88
the middle country, of 40 measured · 49 members
Russia133.67 Malta53.79
Highest and lowest reading in Europe.
- Every region
22 sub-regions, highest middle country first
- Western Africa
127.82
the middle country, of 16 measured · 16 members
Senegal189.93Cabo Verde66.15Highest and lowest reading in Western Africa.
- Central Asia
121.16
the middle country, of 5 measured · 5 members
 Tajikistan131.33
 Kyrgyzstan106.82
Highest and lowest reading in Central Asia.
- Eastern Africa
117.35
the middle country, of 18 measured · 19 members
 Mozambique157.47
 Mauritius67.76
Highest and lowest reading in Eastern Africa.
- Southern Africa
116.27
the middle country, of 5 measured · 5 members
 Botswana138.33
 Eswatini107.49
Highest and lowest reading in Southern Africa.
- Western Asia
112.65
the middle country, of 18 measured · 19 members
Saudi Arabia182.29 Armenia73.65
Highest and lowest reading in Western Asia.
- Northern Africa
109.16
the middle country, of 6 measured · 6 members
 Sudan126.22
 Libya98.35
Highest and lowest reading in Northern Africa.
- Middle Africa
107.39
the middle country, of 9 measured · 9 members
 Central African Republic173.39
 Equatorial Guinea104.28
Highest and lowest reading in Middle Africa.
- South-eastern Asia
106.60
the middle country, of 11 measured · 11 members
 Cambodia130.37
 Singapore90.86
Highest and lowest reading in South-eastern Asia.
- South America
105.99
the middle country, of 12 measured · 12 members
 Peru130.74
 Paraguay74.78
Highest and lowest reading in South America.
- Southern Asia
104.13
the middle country, of 9 measured · 9 members
 India123.29Bhutan68.09
Highest and lowest reading in Southern Asia.
- Central America
103.82
the middle country, of 8 measured · 8 members
 Panama130.95
 Costa Rica96.09
Highest and lowest reading in Central America.
- Northern Europe
103.06
the middle country, of 11 measured · 13 members
 Estonia118.97
 United Kingdom94.33
Highest and lowest reading in Northern Europe.
- Eastern Asia
101.49
the middle country, of 7 measured · 8 members
 Mongolia122.90
 North Korea92.58
Highest and lowest reading in Eastern Asia.
- Caribbean
101.40
the middle country, of 14 measured · 24 members
Dominican Republic136.20Cuba65.76Highest and lowest reading in Caribbean.
- Melanesia
99.03
the middle country, of 5 measured · 5 members
 Fiji125.17
 Vanuatu84.55
Highest and lowest reading in Melanesia.
- Western Europe
96.39
the middle country, of 7 measured · 9 members
 Netherlands100.37
 Germany91.48
Highest and lowest reading in Western Europe.
- Southern Europe
94.06
the middle country, of 12 measured · 17 members
 Bosnia and Herzegovina128.06Malta53.79
Highest and lowest reading in Southern Europe.
- Eastern Europe
93.10
the middle country, of 10 measured · 10 members
Russia133.67 Hungary62.75
Highest and lowest reading in Eastern Europe.
- Australia and New Zealand
2 of 2 measured — too few for a middle: Australia, New Zealand.
Australia146.08 New Zealand108.20
Highest and lowest reading in Australia and New Zealand.
- Micronesia
4 of 7 measured — too few for a middle: Kiribati, Marshall Islands, Micronesia, Nauru.
 Micronesia125.71
 Marshall Islands90.84
Highest and lowest reading in Micronesia.
- Northern America
2 of 4 measured — too few for a middle: Canada, United States.
 Canada107.97
 United States92.96
Highest and lowest reading in Northern America.
- Polynesia
4 of 7 measured — too few for a middle: French Polynesia, Samoa, Tonga, Tuvalu.
 Tuvalu112.68Samoa84.07
Highest and lowest reading in Polynesia.
03The whole field at once
The spread
195 countries, one dot each, on one scale — further right is a higher value. Half the countries are above 106.23; a quarter are above 119.04, and a quarter below 96.20. The bar in each row marks that continent’s middle country.
04All 195 ever measured
Every country
In order, highest value first. “=” marks a position shared with another country. Food and Agriculture Organization of the United Nations (FAO) ranks nobody on this measure; the position is derived here by ordering the published values. Each country is indexed against ITSELF, so this table compares rates of change and not sizes of harvest — 200 means twice what this country grew a decade ago, not twice the country below it.
Showing 25 of 195 countries






































































































































Values for 2022. The change column compares 2022 with 2021 only; the sparkline covers the recent editions.
051961–2022 · 62 reference years
Over time
Each point is one year from 1961, measured against this country’s own 2014–2016 baseline.
- the middle country
- the middle half of countries
- the middle of the 163 countries measured every time
- each continent’s middle country
The same, year by year
| Year | Countries | Middle country | Middle half | Measured every time |
|---|---|---|---|---|
| 2022 | 195 | 106.23 | 96.20 – 119.04 | 106.37 |
| 2021 | 195 | 104.95 | 97.17 – 117.02 | 105.13 |
| 2020 | 195 | 105.14 | 97.16 – 116.63 | 104.29 |
| 2019 | 195 | 105.20 | 97.53 – 112.24 | 104.71 |
| 2018 | 195 | 103.25 | 95.82 – 111.18 | 103.25 |
| 2017 | 195 | 102.14 | 97.25 – 107.62 | 102.14 |
| 2016 | 195 | 101.03 | 97.60 – 104.35 | 100.82 |
| 2015 | 195 | 99.97 | 97.48 – 102.70 | 100.09 |
| 2014 | 195 | 99.22 | 95.40 – 102.36 | 99.52 |
| 2013 | 195 | 96.85 | 92.18 – 101.49 | 97.26 |
| 2012 | 195 | 94.36 | 85.66 – 100.65 | 94.72 |
| 2011 | 193 | 93.98 | 86.61 – 100.82 | 93.85 |
| 2010 | 193 | 90.82 | 84.06 – 99.28 | 91.10 |
| 2009 | 193 | 89.68 | 80.81 – 99.37 | 89.61 |
| 2008 | 193 | 89.45 | 77.46 – 100.08 | 88.90 |
| 2007 | 193 | 85.60 | 74.30 – 98.71 | 86.28 |
| 2006 | 193 | 86.77 | 72.85 – 98.52 | 86.85 |
| 2005 | 191 | 84.09 | 70.06 – 97.73 | 84.04 |
| 2004 | 191 | 82.62 | 67.61 – 102.13 | 82.72 |
| 2003 | 191 | 77.93 | 64.64 – 93.56 | 78.78 |
| 2002 | 191 | 76.18 | 61.36 – 94.47 | 76.85 |
| 2001 | 191 | 75.87 | 61.05 – 95.37 | 75.87 |
| 2000 | 191 | 74.25 | 60.53 – 95.79 | 74.48 |
| 1999 | 189 | 72.89 | 59.11 – 96.44 | 72.89 |
| 1998 | 189 | 71.60 | 56.89 – 95.05 | 71.87 |
| 1997 | 189 | 71.34 | 55.06 – 95.32 | 70.85 |
| 1996 | 189 | 70.06 | 52.52 – 96.02 | 71.15 |
| 1995 | 189 | 66.51 | 50.46 – 93.73 | 66.00 |
| 1994 | 189 | 66.26 | 49.96 – 91.29 | 65.08 |
| 1993 | 188 | 66.09 | 48.97 – 92.70 | 63.32 |
| 1992 | 184 | 65.29 | 48.61 – 90.59 | 61.48 |
| 1991 | 165 | 64.39 | 46.23 – 94.82 | 64.39 |
| 1990 | 163 | 61.21 | 46.65 – 98.36 | 61.21 |
| 1989 | 163 | 60.28 | 45.20 – 96.97 | 60.28 |
| 1988 | 163 | 61.40 | 42.53 – 97.10 | 61.40 |
| 1987 | 163 | 62.79 | 42.32 – 93.66 | 62.79 |
| 1986 | 163 | 62.18 | 41.86 – 96.13 | 62.18 |
| 1985 | 163 | 58.41 | 39.62 – 95.97 | 58.41 |
| 1984 | 163 | 58.16 | 38.71 – 93.77 | 58.16 |
| 1983 | 163 | 55.50 | 35.50 – 86.29 | 55.50 |
| 1982 | 163 | 57.19 | 36.30 – 92.29 | 57.19 |
| 1981 | 163 | 56.25 | 34.39 – 86.57 | 56.25 |
| 1980 | 163 | 55.06 | 34.04 – 86.47 | 55.06 |
| 1979 | 163 | 51.82 | 33.92 – 85.53 | 51.82 |
| 1978 | 163 | 51.21 | 32.86 – 85.66 | 51.21 |
| 1977 | 163 | 49.61 | 31.31 – 82.53 | 49.61 |
| 1976 | 163 | 48.52 | 30.91 – 86.85 | 48.52 |
| 1975 | 163 | 48.22 | 30.75 – 83.31 | 48.22 |
| 1974 | 163 | 47.80 | 29.02 – 87.72 | 47.80 |
| 1973 | 163 | 43.66 | 28.30 – 75.27 | 43.66 |
| 1972 | 163 | 44.37 | 28.24 – 79.41 | 44.37 |
| 1971 | 163 | 44.93 | 27.38 – 82.35 | 44.93 |
| 1970 | 163 | 41.27 | 27.17 – 82.37 | 41.27 |
| 1969 | 163 | 41.65 | 25.82 – 77.69 | 41.65 |
| 1968 | 163 | 39.34 | 26.62 – 73.89 | 39.34 |
| 1967 | 163 | 41.70 | 24.51 – 76.85 | 41.70 |
| 1966 | 163 | 39.70 | 23.44 – 70.63 | 39.70 |
| 1965 | 163 | 39.76 | 24.28 – 73.19 | 39.76 |
| 1964 | 163 | 38.88 | 23.63 – 70.50 | 38.88 |
| 1963 | 163 | 36.91 | 23.07 – 69.03 | 36.91 |
| 1962 | 163 | 35.69 | 21.24 – 69.76 | 35.69 |
| 1961 | 163 | 35.51 | 19.50 – 68.83 | 35.51 |
062021 → 2022
Who rose and fell
The biggest changes in value between the two newest editions — reference years recalculated in one report, not two separate publications. Places are shown second, because they also move when other countries do.
Improved most
before → after Niger103.52 → 137.93 · 109th → 14th+34.41
- Canada84.04 → 107.97 · 183rd → 83rd+23.93
- Russia111.37 → 133.67 · 70th → 18th+22.30
 Kazakhstan108.65 → 129.35 · 79th → 26th+20.70
 Finland78.32 → 98.69 · 187th → 135th+20.37
195 countries were measured in both 2021 and 2022.
07Across every edition
Crop production index in records
The extremes of the statistic. A record reached by more than one country names none of them.
Highest reading on record
955.93
Crop production index (2014–2016 = 100)
Lowest reading on record
0.05
Crop production index (2014–2016 = 100)
Biggest improvement between editions
+225.45
538.86 → 764.31
Biggest decline between editions
−335.05
625.43 → 290.38
Most improved since first measured
+165.75
16.54 → 182.29
At the top most often
43 of 62
editions, alone at the first-listed end
08The measure
About crop production index
The Crop Production Index tracks a country’s crop output against its own 2014–2016 average, set at 100. It is the crop half of the FAO’s food production index — the livestock index is the other.
What the number is: Crop production index (2014–2016 = 100).
09Where it fits
Connections
Its part in the Country Index, the statistics whose values line up most closely with it across countries, and others on the same subject.
In the Country Index
Context, with no vote
This statistic is published in full under Economy & Innovation and Food & Agriculture, but does not help decide any Country Index standing.
Economy & InnovationFood & AgricultureWhich statistics vote, and why
Moves with
Where crop production index is higher, these tend to be higher too.
- Food Production IndexFAO · 195 countries in commonρ 0.82
- Multidimensional Poverty MeasureWorld Bank Group · 139 countries in commonρ 0.52
- Informal Employment RateILO · 95 countries in commonρ 0.46
Moves against
Where crop production index is higher, these tend to be lower.
- Population Aged 65 and OverUN DESA Population Division · 195 countries in commonρ −0.49
- Employment Injury Protection CoverageILO · 178 countries in commonρ −0.48
- World Energy Trilemma IndexKeyWorld Energy Council · 126 countries in commonρ −0.46
Rank correlation (ρ, from −1 to 1) across countries, on each statistic’s newest edition, out of 383 statistics sharing at least 80 countries with this one. Two statistics that move together do not cause each other.
10Keep reading
Explore further
The subject
The countries at either end
11Questions
Crop production index: questions and answers
Which country has the highest crop production index?
Senegal, at 189.93, among the 195 countries compared in 2022.
Which country has the lowest crop production index?
Malta, at 53.79, among the 195 countries compared in 2022.
How many countries does the Crop Production Index cover?
195 in 2022. The number measured varies from 163 to 195 between editions.
What is the world average crop production index?
This site does not calculate a world average, which would depend on how countries are weighted. In the middle country of the 195 compared in 2022, the figure was 106.23.
Is this Food and Agriculture Organization of the United Nations (FAO)’s own ranking?
No. Food and Agriculture Organization of the United Nations (FAO) publishes the values but ranks nobody; the position on this page is derived by Nations Inquiry by ordering the published values, and equal values share a position.
How often is the Crop Production Index published?
This site holds 62 reference years, 1961–2022, all recalculated in Food and Agriculture Organization of the United Nations (FAO)’s 2026 report on one method — not 62 separate publications.
Where does the data come from, and can I download it?
From Food and Agriculture Organization of the United Nations (FAO), under CC BY 4.0. From FAOSTAT via the World Bank’s indicator API (AG.PRD.CROP.XD). Every edition is on this site’s Datasets pages as a full table, and downloads as a CSV file with every value unrounded.
12Method
Sources, method and citation
Source
Crop Production Index — Food and Agriculture Organization of the United Nations (FAO)
From FAOSTAT via the World Bank’s indicator API (AG.PRD.CROP.XD).
Newest edition
Report year 2022Data year 2022
Cite the source as: Food and Agriculture Organization of the United Nations. FAOSTAT. Rome: FAO.
Licence: CC BY 4.0, checked 2026-09-06.
How this page reads the numbers
- Food and Agriculture Organization of the United Nations (FAO) ranks nobody on this measure. The position is derived by Nations Inquiry by ordering the published values; equal values share a position.
- Which end is better follows the publisher’s own reading of the measure.
- A country is named at an end only when it holds that value alone. Where several share it, the page says how many and names none first.
- Values are stored exactly as published and trimmed only for display. “The middle country” is the median of the countries measured, not a world average.
The file itself, column by column — where it came from, what each column holds, and every edition as a CSV — is on its dataset page.
Photographs
The countries at the top of this statistic, from their profiles: Wikimedia Commons, shown in greyscale, each used under the licence named.
- Senegal — Arensond, CC0
- Saudi Arabia — Mardetanha, CC BY-SA 3.0
- Central African Republic — David Holt London, CC BY-SA 2.0
Cite this page
Nations Inquiry (2026). Crop production index by country: Crop Production Index, data from Food and Agriculture Organization of the United Nations (FAO). https://nationsinquiry.com/statistics/crop-production-index