Loading…
FAO · Fertilizer Consumption per Hectare
Fertiliser use by country
How much fertiliser is applied to each hectare of cropland?
Of the 191 countries compared in 2023, Malaysia had the highest reading, 2,926.429, and 4 countries shared the lowest reading, 0.000. In the middle country the figure was 87.356. Among the 108 countries measured in every edition since 1961, the middle one moved from 15.312 to 109.099.
Fertiliser use · 2023
Context statistic

Highest of 191Malaysia
2,926.429012023 · position · derived
The highest and the lowest
The three countries with the highest values of 191 compared, the three with the lowest, and the highest on each continent. This statistic has no better end, so no country is shown as leading.
- 1
- 2

- 3

Lowest in 2023
- =188
 Solomon Islands0.000
 - =188
 Kiribati0.000
 - =188
 Dominica0.000
Positions out of 191. This statistic has no better end: the two ends describe size, not success.
Highest on each continent
- Africa
 Seychelles573.333
 - Americas
 Costa Rica1,024.547
 - AsiaMalaysia2,926.429
- Europe
 Ireland895.870
 - OceaniaNew Zealand1,291.131
- Every region
02Every measured country
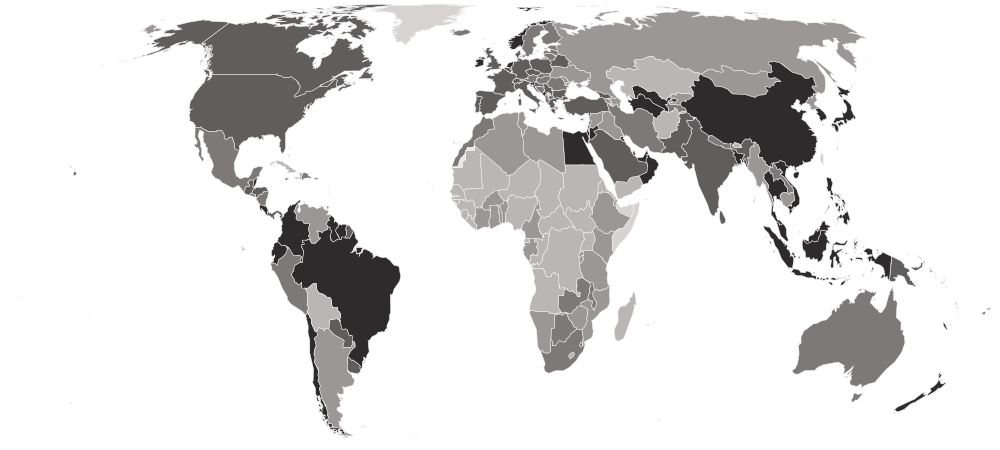
Fertiliser use on a map
Each country is shaded by its value, in five groups holding the same number of countries. Hover a country for its value, or select it to open its profile. Below the map, each continent’s middle country.
Darker is a higher value. This statistic has no better end, so the shades describe size, not success.
- 0.000–13.599
- 14.683–51.090
- 54.267–111.781
- 112.579–199.141
- 199.449–2,926.429
- No reading in 2023 (9 measured in an earlier edition)
- Asia
165.251
the middle country, of 48 measured · 52 members
Malaysia2,926.429 Kazakhstan3.879
Highest and lowest reading in Asia.
- Europe
114.623
the middle country, of 40 measured · 49 members
Ireland895.870 Russia28.729
Highest and lowest reading in Europe.
- Americas
94.249
the middle country, of 37 measured · 48 members
Costa Rica1,024.5472 share 0.000
Highest and lowest reading in Americas.
- Oceania
77.350
the middle country, of 13 measured · 21 members
New Zealand1,291.1312 share 0.000
Highest and lowest reading in Oceania.
- Africa
17.362
the middle country, of 53 measured · 55 members
Seychelles573.333 Central African Republic0.044
Highest and lowest reading in Africa.
- Every region
22 sub-regions, highest middle country first
- Eastern Asia
232.578
the middle country, of 6 measured · 8 members
 Hong Kong484.000
 North Korea14.683
Highest and lowest reading in Eastern Asia.
- South-eastern Asia
188.350
the middle country, of 10 measured · 11 members
Malaysia2,926.429 Myanmar24.721
Highest and lowest reading in South-eastern Asia.
- South America
187.913
the middle country, of 12 measured · 12 members
 Colombia372.911
 Bolivia8.548
Highest and lowest reading in South America.
- Western Asia
171.182
the middle country, of 18 measured · 19 members
Kuwait2,008.500 Yemen8.930
Highest and lowest reading in Western Asia.
- Central America
150.275
the middle country, of 8 measured · 8 members
Costa Rica1,024.547 Nicaragua64.218
Highest and lowest reading in Central America.
- Western Europe
142.697
the middle country, of 7 measured · 9 members
 Netherlands238.020
 Austria106.416
Highest and lowest reading in Western Europe.
- Southern Europe
126.470
the middle country, of 12 measured · 17 members
 Montenegro251.381
 North Macedonia54.267
Highest and lowest reading in Southern Europe.
- Melanesia
103.138
the middle country, of 5 measured · 5 members
 New Caledonia248.911Solomon Islands0.000
Highest and lowest reading in Melanesia.
- Eastern Europe
98.944
the middle country, of 10 measured · 10 members
 Belarus198.942Russia28.729
Highest and lowest reading in Eastern Europe.
- Northern Europe
97.289
the middle country, of 11 measured · 13 members
Ireland895.870 Estonia74.862
Highest and lowest reading in Northern Europe.
- Central Asia
92.938
the middle country, of 5 measured · 5 members
 Turkmenistan347.310Kazakhstan3.879
Highest and lowest reading in Central Asia.
- Southern Asia
92.750
the middle country, of 9 measured · 9 members
 Bangladesh391.888
 Afghanistan6.595
Highest and lowest reading in Southern Asia.
- Southern Africa
77.187
the middle country, of 5 measured · 5 members
 Botswana93.077
 Lesotho8.698
Highest and lowest reading in Southern Africa.
- Northern Africa
35.969
the middle country, of 6 measured · 6 members
 Egypt532.775
 Sudan7.103
Highest and lowest reading in Northern Africa.
- Caribbean
34.561
the middle country, of 14 measured · 24 members
 Saint Lucia200.000
2 share 0.000
Highest and lowest reading in Caribbean.
- Eastern Africa
28.333
the middle country, of 17 measured · 19 members
Seychelles573.333 South Sudan0.187
Highest and lowest reading in Eastern Africa.
- Middle Africa
10.336
the middle country, of 9 measured · 9 members
 São Tomé and Príncipe68.000Central African Republic0.044
Highest and lowest reading in Middle Africa.
- Western Africa
10.108
the middle country, of 16 measured · 16 members
 Côte d’Ivoire43.785
 Niger0.772
Highest and lowest reading in Western Africa.
- Australia and New Zealand
2 of 2 measured — too few for a middle: Australia, New Zealand.
New Zealand1,291.131 Australia102.689
Highest and lowest reading in Australia and New Zealand.
- Micronesia
3 of 7 measured — too few for a middle: Kiribati, Micronesia, Palau.
 Palau26.667Kiribati0.000
Highest and lowest reading in Micronesia.
- Northern America
3 of 4 measured — too few for a middle: Bermuda, Canada, United States.
 Bermuda160.000
 United States127.797
Highest and lowest reading in Northern America.
- Polynesia
3 of 7 measured — too few for a middle: French Polynesia, Samoa, Tonga.
 French Polynesia130.400
 Samoa1.027
Highest and lowest reading in Polynesia.
03The whole field at once
The spread
191 countries, one dot each, on one scale — further right is a higher value. Half the countries are above 87.356; a quarter are above 173.252, and a quarter below 21.373. The bar in each row marks that continent’s middle country.
04All 200 ever measured
Every country
In order, highest value first. “=” marks a position shared with another country. Food and Agriculture Organization of the United Nations (FAO) ranks nobody on this measure; the position is derived here by ordering the published values. Neither end is better, so this carries no good-or-bad colouring on the site. The extreme top of the table is territories with almost no arable land to divide by — the denominator is what is unusual there, not the fertiliser.
Showing 25 of 200 countries
























































































































































Values for 2023. The change column compares 2023 with 2022 only; the sparkline covers the recent editions.
051961–2023 · 63 reference years
Over time
Each point is one reference year from 1961.
- the middle country
- the middle half of countries
- the middle of the 108 countries measured every time
- each continent’s middle country
The same, year by year
| Year | Countries | Middle country | Middle half | Measured every time |
|---|---|---|---|---|
| 2023 | 191 | 87.356 | 21.373 – 173.252 | 109.099 |
| 2022 | 193 | 72.700 | 20.314 – 160.681 | 109.464 |
| 2021 | 194 | 91.690 | 18.920 – 177.234 | 124.986 |
| 2020 | 199 | 92.792 | 21.420 – 181.125 | 129.794 |
| 2019 | 199 | 84.490 | 22.631 – 176.730 | 115.607 |
| 2018 | 199 | 88.388 | 21.638 – 179.785 | 118.604 |
| 2017 | 199 | 93.385 | 20.881 – 180.270 | 128.560 |
| 2016 | 199 | 94.103 | 18.863 – 188.527 | 125.897 |
| 2015 | 199 | 92.399 | 15.261 – 185.614 | 116.993 |
| 2014 | 199 | 85.341 | 18.587 – 191.594 | 107.362 |
| 2013 | 199 | 84.672 | 18.380 – 181.599 | 111.046 |
| 2012 | 198 | 85.522 | 15.134 – 177.535 | 107.292 |
| 2011 | 193 | 80.959 | 13.054 – 159.165 | 97.164 |
| 2010 | 194 | 73.019 | 12.065 – 151.278 | 97.715 |
| 2009 | 194 | 63.192 | 12.063 – 122.554 | 89.040 |
| 2008 | 192 | 69.424 | 11.321 – 153.884 | 91.964 |
| 2007 | 192 | 69.793 | 13.278 – 161.745 | 99.481 |
| 2006 | 193 | 67.940 | 11.000 – 143.579 | 98.819 |
| 2005 | 191 | 66.594 | 9.933 – 141.915 | 94.982 |
| 2004 | 191 | 67.138 | 10.234 – 145.851 | 98.506 |
| 2003 | 191 | 55.876 | 8.078 – 147.764 | 97.475 |
| 2002 | 188 | 65.218 | 10.267 – 154.173 | 96.542 |
| 2001 | 166 | 74.095 | 13.048 – 155.106 | 104.429 |
| 2000 | 166 | 73.864 | 13.831 – 162.695 | 103.134 |
| 1999 | 166 | 75.737 | 12.953 – 169.795 | 103.246 |
| 1998 | 166 | 75.997 | 13.314 – 172.117 | 102.506 |
| 1997 | 165 | 73.155 | 13.158 – 184.778 | 98.548 |
| 1996 | 165 | 72.034 | 12.537 – 193.368 | 96.826 |
| 1995 | 162 | 66.621 | 16.481 – 178.011 | 84.137 |
| 1994 | 161 | 66.351 | 15.183 – 174.819 | 81.545 |
| 1993 | 164 | 66.649 | 12.092 – 169.155 | 86.938 |
| 1992 | 159 | 72.050 | 14.424 – 177.342 | 78.964 |
| 1991 | 140 | 66.692 | 11.161 – 198.099 | 79.807 |
| 1990 | 141 | 76.432 | 8.494 – 192.447 | 98.405 |
| 1989 | 143 | 79.879 | 10.202 – 198.032 | 94.585 |
| 1988 | 143 | 74.468 | 9.015 – 209.901 | 88.682 |
| 1987 | 145 | 73.461 | 8.974 – 196.222 | 89.900 |
| 1986 | 142 | 66.385 | 12.851 – 220.800 | 86.841 |
| 1985 | 143 | 59.078 | 10.603 – 213.690 | 72.054 |
| 1984 | 143 | 61.304 | 12.547 – 216.306 | 74.390 |
| 1983 | 143 | 61.132 | 11.802 – 216.724 | 71.578 |
| 1982 | 144 | 57.910 | 11.668 – 211.667 | 64.685 |
| 1981 | 144 | 51.420 | 12.510 – 195.646 | 69.958 |
| 1980 | 146 | 49.439 | 7.368 – 192.635 | 69.800 |
| 1979 | 143 | 50.395 | 9.734 – 204.335 | 68.911 |
| 1978 | 144 | 54.615 | 8.242 – 189.874 | 64.127 |
| 1977 | 143 | 50.505 | 7.492 – 178.825 | 62.764 |
| 1976 | 143 | 45.932 | 5.182 – 168.614 | 65.567 |
| 1975 | 142 | 30.580 | 4.601 – 145.948 | 57.091 |
| 1974 | 139 | 33.396 | 4.578 – 143.087 | 57.782 |
| 1973 | 138 | 30.837 | 5.255 – 146.160 | 55.580 |
| 1972 | 133 | 38.188 | 5.166 – 156.552 | 53.336 |
| 1971 | 130 | 32.237 | 4.211 – 151.095 | 49.413 |
| 1970 | 131 | 32.955 | 3.824 – 147.497 | 44.967 |
| 1969 | 131 | 27.967 | 3.685 – 123.829 | 40.473 |
| 1968 | 130 | 26.378 | 2.919 – 120.597 | 35.311 |
| 1967 | 130 | 22.710 | 3.048 – 103.211 | 30.397 |
| 1966 | 128 | 20.738 | 2.751 – 98.079 | 28.996 |
| 1965 | 124 | 17.951 | 2.613 – 86.073 | 26.119 |
| 1964 | 124 | 15.481 | 2.155 – 92.220 | 18.692 |
| 1963 | 122 | 13.945 | 2.035 – 87.483 | 20.646 |
| 1962 | 121 | 12.390 | 1.469 – 73.090 | 18.267 |
| 1961 | 121 | 11.427 | 1.453 – 72.414 | 15.312 |
062022 → 2023
Who rose and fell
The biggest changes in value between the two newest editions — reference years recalculated in one report, not two separate publications. Places are shown second, because they also move when other countries do.
Rose most
before → after- Malaysia1,612.105 → 2,926.429 · 2nd → 1st+1,314.324
- Kuwait1,358.500 → 2,008.500 · 3rd → 2nd+650.000
 Faroe Islands171.429 → 614.286 · 47th → 6th+442.857
 Belize126.230 → 337.540 · 68th → 16th+211.310
- Costa Rica898.665 → 1,024.547 · 5th → 4th+125.881
Fell most
before → after- New Zealand1,633.433 → 1,291.131 · 1st → 3rd−342.303
- Ireland1,056.159 → 895.870 · 4th → 5th−160.289
 Ecuador325.921 → 216.911 · 17th → 32nd−109.010
- French Polynesia226.000 → 130.400 · 27th → 66th−95.600
 Philippines285.425 → 199.449 · 20th → 38th−85.976
191 countries were measured in both 2022 and 2023. The field changed from 193 to 191 countries, so a place can move for reasons that have nothing to do with the country itself.
07Across every edition
Fertiliser use in records
The extremes of the statistic. A record reached by more than one country names none of them.
Highest reading on record
17,196.970
Fertilizer consumption (kg per hectare of arable land)
Lowest reading on record
Reached 41 times by 12 countries — shared, so no holder is named
0.000
Fertilizer consumption (kg per hectare of arable land)
Biggest rise between editions
+10,636.364
6,560.606 → 17,196.970
Biggest fall between editions
−11,984.848
12,227.273 → 242.424
Biggest change since first measured
+2,827.683
98.745 → 2,926.429
Highest most often
29 of 63
editions, alone at the first-listed end
08The measure
About fertiliser use
Fertilizer consumption is the nitrogen, phosphate and potash applied per hectare of arable land. It is a problem at both ends: too little is a yield problem across much of Africa, and too much is a runoff, algal-bloom and emissions problem across much of Asia and Europe.
What the number is: Fertilizer consumption (kg per hectare of arable land).
09Where it fits
Connections
Its part in the Country Index, the statistics whose values line up most closely with it across countries, and others on the same subject.
In the Country Index
Context, with no vote
This statistic is published in full under Economy & Innovation and Environment & Sustainability, but does not help decide any Country Index standing.
Economy & InnovationEnvironment & SustainabilityWhich statistics vote, and why
Moves with
Where fertiliser use is higher, these tend to be higher too.
- Cereal YieldKeyFAO · 176 countries in commonρ 0.69
- GNI per Capita (PPP)World Bank Group · 100 countries in commonρ 0.67
- Inequality-adjusted Human Development IndexUNDP Human Development Report Office · 162 countries in commonρ 0.64
Moves against
Where fertiliser use is higher, these tend to be lower.
- Maternal Mortality RatioKeyMMEIG · 185 countries in commonρ −0.60
- Net Official Development Assistance ReceivedOECD Development Assistance Committee · 124 countries in commonρ −0.57
- Gender Inequality IndexKeyUNDP Human Development Report Office · 169 countries in commonρ −0.57
Rank correlation (ρ, from −1 to 1) across countries, on each statistic’s newest edition, out of 126 statistics sharing at least 80 countries with this one. Two statistics that move together do not cause each other.
10Keep reading
Explore further
The countries at either end
11Questions
Fertiliser use: questions and answers
Which country has the highest fertiliser use?
Malaysia, at 2,926.429, among the 191 countries compared in 2023.
Which country has the lowest fertiliser use?
4 countries share the lowest reading, 0.000, among the 191 compared in 2023, so no single country is named.
How many countries does the Fertilizer Consumption per Hectare cover?
191 in 2023, and 200 at least once across all editions. The number measured varies from 121 to 199 between editions.
What is the world average fertiliser use?
This site does not calculate a world average, which would depend on how countries are weighted. In the middle country of the 191 compared in 2023, the figure was 87.356.
Is this Food and Agriculture Organization of the United Nations (FAO)’s own ranking?
No. Food and Agriculture Organization of the United Nations (FAO) publishes the values but ranks nobody; the position on this page is derived by Nations Inquiry by ordering the published values, and equal values share a position.
How often is the Fertilizer Consumption per Hectare published?
This site holds 63 reference years, 1961–2023, all recalculated in Food and Agriculture Organization of the United Nations (FAO)’s 2026 report on one method — not 63 separate publications.
Where does the data come from, and can I download it?
From Food and Agriculture Organization of the United Nations (FAO), under CC BY 4.0. From FAOSTAT via the World Bank’s indicator API (AG.CON.FERT.ZS). Every edition is available on this site’s Datasets pages as a full table, unrounded.
12Method
Sources, method and citation
Source
Fertilizer Consumption per Hectare — Food and Agriculture Organization of the United Nations (FAO)
From FAOSTAT via the World Bank’s indicator API (AG.CON.FERT.ZS).
Newest edition
Report year 2023Data year 2023
Cite the source as: Food and Agriculture Organization of the United Nations. FAOSTAT. Rome: FAO.
Licence: CC BY 4.0, checked 2026-09-06.
How this page reads the numbers
- Food and Agriculture Organization of the United Nations (FAO) ranks nobody on this measure. The position is derived by Nations Inquiry by ordering the published values; equal values share a position.
- This statistic has no better end, so the page describes higher and lower values and never calls a country a leader.
- A country is named at an end only when it holds that value alone. Where several share it, the page says how many and names none first.
- Values are stored exactly as published and trimmed only for display. “The middle country” is the median of the countries measured, not a world average.
The full note on this data
63 reference years (1961–2023), covering 121 to 199 countries, from FAOSTAT via the World Bank’s indicator API (AG.CON.FERT.ZS). Nitrogen, phosphate and potash applied per hectare of arable land. ⚠ NEITHER END IS BETTER, so this indicator carries no good/bad colouring anywhere on the site and does not feed its topics’ rankings — it is charted on them, not scored by them. This one is a problem at BOTH ends: too little fertiliser is a yield problem across much of Africa, and too much is a runoff, algal-bloom and emissions problem across much of Asia and Europe. ⚠ The extreme top of the table is territories with almost no arable land to divide by, not the world’s heaviest users — the denominator is what is unusual there, not the fertiliser. ⚠ These are not separate published reports — `restatedByReport` names the World Development Indicators release they were pulled from. ⚠ A statistic, not an index. ⚠ No rank is published. A POSITION is derived here (2026-09-10) by ordering the score LARGEST FIRST, and it is a SIZE ORDER rather than a league table: this measure has no better end, so position 1 names the country with the biggest figure and says nothing about how that country is doing. The change arrows stay grey for the same reason, and the indicator is still left out of the Country Index.
Cite this page
Nations Inquiry (2026). Fertiliser use by country: Fertilizer Consumption per Hectare, data from Food and Agriculture Organization of the United Nations (FAO). https://nationsinquiry.com/statistics/fertilizer-use