World Bank Group (Prospects Group) · Informal Output (DGE Model Estimate)
Size of the informal economy by country
How large is the informal economy compared with official GDP?
Of the 156 countries compared in 2020, Switzerland had the lowest reading, 7.910%, and Zimbabwe had the highest reading, 60.429%. In the middle country the figure was 27.500%. Among the 155 countries measured in every edition since 1990, the middle one moved from 34.871% to 27.669%.
Share
Part ofEconomy & Innovation
Size of the informal economy · 2020
Context statistic

Lowest of 156Switzerland
7.910%012020 · values only
Who leads
The three countries at the lowest end of 156 compared, the three at the other end, and the first on each continent.
 1
1Photo: Simon Koopmann derivative work: Jjtkk · CC BY-SA 2.0 de, greyscale
 2
2Photo: Stefano Brivio · CC BY 2.0, greyscale
 3
3Photo: Seebeer Edited by Nicholasjf21 · Public domain, greyscale
Lowest on each continent
- Africa
 Mauritius19.335%
 - Americas
 United States7.953%
 - Asia
 China8.019%
 - EuropeSwitzerland7.910%
- Oceania
 New Zealand11.225%
3 of 21 measured
- Every region
02Every measured country
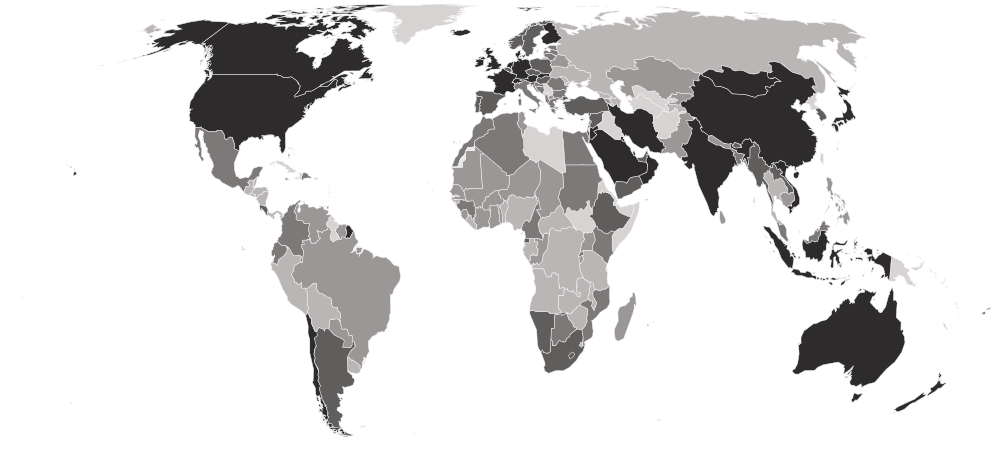
Size of the informal economy on a map
Each country is shaded by its value, in five groups holding the same number of countries. Hover a country for its value, or select it to open its profile. Below the map, each continent’s middle country.
Darker is a lower value — the better end.
- 39.053–60.429%
- 30.430–38.406%
- 25.192–30.351%
- 16.475–25.165%
- 7.910–16.179%
- No reading in 2020
- Europe
22.462%
the middle country, of 37 measured · 49 members
Switzerland7.910% Ukraine46.014%
Lowest and highest reading in Europe.
- Asia
22.729%
the middle country, of 41 measured · 52 members
China8.019% Georgia58.187%
Lowest and highest reading in Asia.
- Americas
32.657%
the middle country, of 28 measured · 48 members
United States7.953% Bolivia54.874%
Lowest and highest reading in Americas.
- Africa
35.549%
the middle country, of 47 measured · 55 members
Mauritius19.335% Zimbabwe60.429%
Lowest and highest reading in Africa.
- Oceania
3 of 21 measured — too few for a middle: Australia, Fiji, New Zealand.
New Zealand11.225% Fiji29.783%
Lowest and highest reading in Oceania.
- Every region
20 sub-regions, lowest middle country first
- Western Europe
12.477%
the middle country, of 7 measured · 9 members
Switzerland7.910% Belgium20.220%
Lowest and highest reading in Western Europe.
- Northern Europe
16.285%
the middle country, of 10 measured · 13 members
 United Kingdom11.690%
 Lithuania27.233%
Lowest and highest reading in Northern Europe.
- Western Asia
20.664%
the middle country, of 16 measured · 19 members
 Qatar13.782%Georgia58.187%
Lowest and highest reading in Western Asia.
- Southern Asia
24.278%
the middle country, of 8 measured · 9 members
 India15.941%
 Sri Lanka32.881%
Lowest and highest reading in Southern Asia.
- South-eastern Asia
24.438%
the middle country, of 10 measured · 11 members
 Vietnam10.618%
 Thailand45.030%
Lowest and highest reading in South-eastern Asia.
- Southern Africa
25.107%
the middle country, of 5 measured · 5 members
 South Africa22.749%
 Eswatini39.655%
Lowest and highest reading in Southern Africa.
- Caribbean
26.008%
the middle country, of 7 measured · 24 members
 Bahamas23.756%
 Saint Vincent and the Grenadines44.183%
Lowest and highest reading in Caribbean.
- Southern Europe
26.067%
the middle country, of 10 measured · 17 members
 Spain20.579%
 North Macedonia32.694%
Lowest and highest reading in Southern Europe.
- Eastern Europe
26.759%
the middle country, of 10 measured · 10 members
 Slovakia15.886%Ukraine46.014%
Lowest and highest reading in Eastern Europe.
- Northern Africa
27.985%
the middle country, of 5 measured · 6 members
 Algeria27.669%
 Tunisia32.706%
Lowest and highest reading in Northern Africa.
- South America
32.954%
the middle country, of 11 measured · 12 members
 Chile15.384%Bolivia54.874%
Lowest and highest reading in South America.
- Eastern Africa
35.740%
the middle country, of 13 measured · 19 members
Mauritius19.335%Zimbabwe60.429%Lowest and highest reading in Eastern Africa.
- Western Africa
36.083%
the middle country, of 16 measured · 16 members
 Cabo Verde29.004%
 Nigeria54.875%
Lowest and highest reading in Western Africa.
- Middle Africa
39.396%
the middle country, of 8 measured · 9 members
 Equatorial Guinea24.842%
 Gabon45.979%
Lowest and highest reading in Middle Africa.
- Central America
40.556%
the middle country, of 8 measured · 8 members
 Costa Rica20.502%
 Guatemala46.090%
Lowest and highest reading in Central America.
- Australia and New Zealand
2 of 2 measured — too few for a middle: Australia, New Zealand.
New Zealand11.225% Australia12.579%
Lowest and highest reading in Australia and New Zealand.
- Central Asia
3 of 5 measured — too few for a middle: Kazakhstan, Kyrgyzstan, Tajikistan.
 Kyrgyzstan33.185%
 Tajikistan43.002%
Lowest and highest reading in Central Asia.
- Eastern Asia
4 of 8 measured — too few for a middle: China, Japan, Mongolia, South Korea.
China8.019% South Korea22.521%
Lowest and highest reading in Eastern Asia.
- Melanesia
1 of 5 measured — too few for a middle: Fiji.
Fiji29.783%Lowest and highest reading in Melanesia.
- Northern America
2 of 4 measured — too few for a middle: Canada, United States.
United States7.953% Canada13.894%
Lowest and highest reading in Northern America.
03The whole field at once
The spread
156 countries, one dot each, on one scale — further right is a higher value. Half the countries are above 27.500%; a quarter are above 36.131%, and a quarter below 20.432%. The bar in each row marks that continent’s middle country.
04All 156 ever measured
Every country
In order, lowest value first. No rank or position is shown: too many countries share the same value for an order to mean anything. These are model estimates, and the order of countries leans heavily on the earlier study the model was calibrated to, so small differences between countries mean little and no positions are shown. A large informal sector goes with lower productivity and tax revenue, but it is also where many people find work when formal jobs are scarce.
Showing 25 of 156 countries












































































































Values for 2020. The change column compares 2020 with 2019 only; the sparkline covers the recent editions.
051990–2020 · 31 reference years
Over time
Every year from 1990 to 2020 comes from one run of the same model, so a country's line shows how the estimate moves over three decades, read on one method.
- the middle country
- the middle half of countries
- the middle of the 155 countries measured every time
- each continent’s middle country
The same, year by year
| Year | Countries | Middle country | Middle half | Measured every time |
|---|---|---|---|---|
| 2020 | 156 | 27.500% | 20.432% – 36.131% | 27.669% |
| 2019 | 156 | 28.029% | 20.789% – 36.284% | 28.123% |
| 2018 | 156 | 28.168% | 20.812% – 36.574% | 28.172% |
| 2017 | 156 | 28.302% | 20.919% – 36.790% | 28.359% |
| 2016 | 156 | 28.430% | 21.160% – 36.852% | 28.485% |
| 2015 | 156 | 28.752% | 21.361% – 37.074% | 28.818% |
| 2014 | 156 | 28.917% | 21.439% – 37.101% | 28.991% |
| 2013 | 156 | 29.503% | 21.540% – 37.635% | 29.717% |
| 2012 | 156 | 30.127% | 21.701% – 37.985% | 30.185% |
| 2011 | 156 | 30.510% | 21.868% – 38.770% | 30.607% |
| 2010 | 156 | 30.599% | 22.139% – 39.069% | 30.634% |
| 2009 | 156 | 30.905% | 22.296% – 39.045% | 30.908% |
| 2008 | 156 | 31.412% | 22.566% – 39.762% | 31.468% |
| 2007 | 156 | 31.475% | 22.800% – 40.375% | 31.501% |
| 2006 | 156 | 31.703% | 22.939% – 40.666% | 31.705% |
| 2005 | 156 | 32.005% | 22.821% – 40.916% | 32.232% |
| 2004 | 156 | 32.243% | 22.722% – 41.200% | 32.252% |
| 2003 | 156 | 32.491% | 22.867% – 41.200% | 32.510% |
| 2002 | 156 | 32.728% | 22.767% – 41.291% | 33.016% |
| 2001 | 156 | 33.389% | 22.942% – 41.510% | 33.476% |
| 2000 | 156 | 33.605% | 23.221% – 41.863% | 33.628% |
| 1999 | 156 | 33.666% | 23.430% – 42.248% | 33.799% |
| 1998 | 156 | 33.827% | 23.764% – 42.390% | 33.904% |
| 1997 | 156 | 34.117% | 24.040% – 42.574% | 34.228% |
| 1996 | 156 | 33.658% | 24.321% – 42.007% | 33.662% |
| 1995 | 156 | 33.575% | 24.545% – 41.831% | 33.764% |
| 1994 | 156 | 33.793% | 24.792% – 41.901% | 33.797% |
| 1993 | 156 | 34.022% | 24.667% – 41.680% | 34.476% |
| 1992 | 156 | 34.714% | 25.034% – 41.758% | 34.751% |
| 1991 | 155 | 34.847% | 25.794% – 42.464% | 34.847% |
| 1990 | 155 | 34.871% | 25.847% – 42.947% | 34.871% |
062019 → 2020
Who rose and fell
The biggest changes in value between the two newest editions — reference years recalculated in one report, not two separate publications. Places are shown second, because they also move when other countries do.
Improved most
before → after Peru44.460% → 42.611%−1.849
 Mozambique27.359% → 25.894%−1.466
- Bolivia55.984% → 54.874%−1.110
- Guatemala47.060% → 46.090%−0.970
 Côte d’Ivoire38.594% → 37.657%−0.937
Worsened most
before → after Liberia39.121% → 39.899%+0.777
 Central African Republic44.305% → 44.760%+0.455
 Venezuela30.009% → 30.430%+0.421
 Angola40.159% → 40.386%+0.227
 Guinea30.181% → 30.351%+0.170
156 countries were measured in both 2019 and 2020.
07Across every edition
Size of the informal economy in records
The extremes of the statistic. A record reached by more than one country names none of them.
Highest reading on record
71.214%
Informal output, model estimate (% of official GDP)
Lowest reading on record
7.910%
Informal output, model estimate (% of official GDP)
Biggest improvement between editions
−6.799
61.336% → 54.537%
Biggest decline between editions
+13.775
50.308% → 64.083%
Most improved since first measured
−49.126
71.214% → 22.088%
At the top most often
31 of 31
editions, alone at the first-listed end
08The measure
About size of the informal economy
This is an estimate of how large a country's informal economy is — the output of unregistered businesses and untaxed work — as a share of its official GDP, from the World Bank's Informal Economy Database. Because informal activity escapes official statistics, the figure comes from an economic model rather than a count.
What the number is: Informal output, model estimate (% of official GDP).
09Where it fits
Connections
Its part in the Country Index, the statistics whose values line up most closely with it across countries, and others on the same subject.
In the Country Index
Context, with no vote
This statistic is published in full under Economy & Innovation, but does not help decide any Country Index standing.
Moves with
Where size of the informal economy is higher, these tend to be higher too.
- Adolescent Birth Rate (Ages 15–19)UN DESA Population Division · 156 countries in commonρ 0.64
- Adult Mortality (Probability of Dying Between 15 and 60)UN DESA Population Division · 156 countries in commonρ 0.63
- Firms Competing Against Informal FirmsWorld Bank Group · 148 countries in commonρ 0.62
Moves against
Where size of the informal economy is higher, these tend to be lower.
- Global Innovation IndexWorld Intellectual Property Organization · 134 countries in commonρ −0.66
- Historical GDP per Capita (Maddison)GGDC · 148 countries in commonρ −0.66
- Human Capital Wealth per CapitaWorld Bank Group · 142 countries in commonρ −0.65
Rank correlation (ρ, from −1 to 1) across countries, on each statistic’s newest edition, out of 372 statistics sharing at least 80 countries with this one. Two statistics that move together do not cause each other.
10Keep reading
Explore further
The subject
The countries at either end
11Questions
Size of the informal economy: questions and answers
Which country has the lowest size of the informal economy?
Switzerland, at 7.910%, among the 156 countries compared in 2020.
Which country has the highest size of the informal economy?
Zimbabwe, at 60.429%, among the 156 countries compared in 2020.
How many countries does the Informal Output (DGE Model Estimate) cover?
156 in 2020. The number measured varies from 155 to 156 between editions.
What is the world average size of the informal economy?
This site does not calculate a world average, which would depend on how countries are weighted. In the middle country of the 156 compared in 2020, the figure was 27.500%.
Is this World Bank Group (Prospects Group)’s own ranking?
No ranking is shown. World Bank Group (Prospects Group) publishes values only, and too many countries share the same value for an ordering to mean anything, so none is derived.
How often is the Informal Output (DGE Model Estimate) published?
This site holds 31 reference years, 1990–2020, all recalculated in World Bank Group (Prospects Group)’s 2021 report on one method — not 31 separate publications.
Where does the data come from, and can I download it?
From World Bank Group (Prospects Group), under CC BY 4.0. From the World Bank Prospects Group's own Informal Economy Database workbook (Elgin, Kose, Ohnsorge and Yu, 2021), which carries the model's values in full; the Bank's Data360 copy of the same figures is checked against it. Every edition is on this site’s Datasets pages as a full table, and downloads as a CSV file with every value unrounded.
12Method
Sources, method and citation
Source
Informal Output (DGE Model Estimate) — World Bank Group (Prospects Group)
From the World Bank Prospects Group's own Informal Economy Database workbook (Elgin, Kose, Ohnsorge and Yu, 2021), which carries the model's values in full; the Bank's Data360 copy of the same figures is checked against it.
Newest edition
Report year 2020Data year 2020
Cite the source as: Elgin, C., M. A. Kose, F. Ohnsorge and S. Yu. 2021. "Understanding Informality." CEPR Discussion Paper 16497. London: Centre for Economic Policy Research.
Licence: CC BY 4.0, checked 2026-10-03.
How this page reads the numbers
- No rank or position is shown: World Bank Group (Prospects Group) publishes values only, and too many countries share the same value for an ordering to mean anything.
- Which end is better follows the publisher’s own reading of the measure.
- A country is named at an end only when it holds that value alone. Where several share it, the page says how many and names none first.
- Values are stored exactly as published and trimmed only for display. “The middle country” is the median of the countries measured, not a world average.
The file itself, column by column — where it came from, what each column holds, and every edition as a CSV — is on its dataset page.
Photographs
The countries at the top of this statistic, from their profiles: Wikimedia Commons, shown in greyscale, each used under the licence named.
- Switzerland — Simon Koopmann derivative work: Jjtkk, CC BY-SA 2.0 de
- United States — Stefano Brivio, CC BY 2.0
- China — Seebeer Edited by Nicholasjf21, Public domain
Cite this page
Nations Inquiry (2026). Size of the informal economy by country: Informal Output (DGE Model Estimate), data from World Bank Group (Prospects Group). https://nationsinquiry.com/statistics/informal-output