FAO · Renewable Internal Freshwater Resources per Capita
Renewable freshwater per person by country
How much renewable fresh water does a country generate per person?
Iceland placed first of the 181 countries compared in 2022, at 445,023, and Kuwait last, at 0. In the middle country the figure was 2,528. Among the 142 countries measured in every edition since 1961, the middle one moved from 6,216 to 2,435.
Share
Renewable freshwater per person · 2022
Context statistic

Highest of 181Iceland
445,023012022 · position · derived
Who leads
The three countries at the highest end of 181 compared, the three at the other end, and the first on each continent.
 1
Photo: Hansueli Krapf · CC BY-SA 3.0, greyscale
 2
Photo: Bill Cameron · CC BY-SA 3.0, greyscale
 3
Photo: WiDi · CC BY-SA 3.0, greyscale


02Every measured country
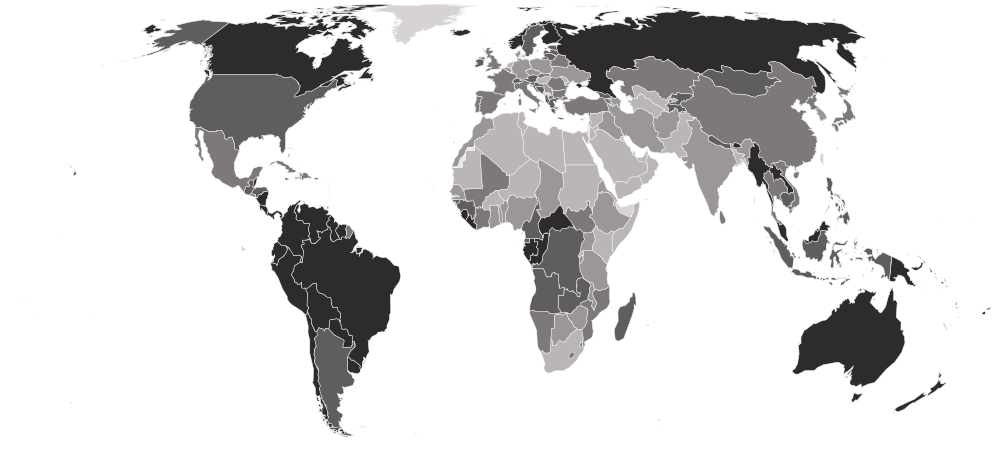
Renewable freshwater per person on a map
Each country is shaded by its value, in five groups holding the same number of countries. Hover a country for its value, or select it to open its profile. Below the map, each continent’s middle country.
Darker is a higher value — the better end.
- 0–718
- 749–1,678
- 1,711–3,684
- 3,812–16,306
- 16,717–445,023
- No reading in 2022 (2 measured in an earlier edition)
- Oceania
31,944
the middle country, of 7 measured · 21 members
 Papua New Guinea78,505
 Nauru847
Highest and lowest reading in Oceania.
- Americas
7,434
the middle country, of 36 measured · 48 members
 Guyana293,317
 Barbados283
Highest and lowest reading in Americas.
- Europe
3,248
the middle country, of 39 measured · 49 members
Iceland445,023 Malta95
Highest and lowest reading in Europe.
- Asia
1,714
the middle country, of 46 measured · 52 members
 Bhutan99,883
 Kuwait0
Highest and lowest reading in Asia.
- Africa
1,138
the middle country, of 53 measured · 55 members
 Gabon67,469
 Egypt9
Highest and lowest reading in Africa.
- Every region
21 sub-regions, highest middle country first
- South America
27,862
the middle country, of 12 measured · 12 members
Guyana293,317 Argentina6,431
Highest and lowest reading in South America.
- Central America
15,450
the middle country, of 8 measured · 8 members
 Belize37,891
 El Salvador2,489
Highest and lowest reading in Central America.
- Middle Africa
9,880
the middle country, of 9 measured · 9 members
Gabon67,469 Chad813
Highest and lowest reading in Middle Africa.
- Northern Europe
9,411
the middle country, of 10 measured · 13 members
Iceland445,023 Denmark1,016
Highest and lowest reading in Northern Europe.
- South-eastern Asia
7,011
the middle country, of 11 measured · 11 members
 Laos25,188
 Singapore106
Highest and lowest reading in South-eastern Asia.
- Southern Europe
3,801
the middle country, of 12 measured · 17 members
 Bosnia and Herzegovina11,077Malta95
Highest and lowest reading in Southern Europe.
- Central Asia
3,212
the middle country, of 5 measured · 5 members
 Kyrgyzstan7,015
 Turkmenistan194
Highest and lowest reading in Central Asia.
- Eastern Asia
2,545
the middle country, of 5 measured · 8 members
 Mongolia10,135
 South Korea1,255
Highest and lowest reading in Eastern Asia.
- Southern Africa
2,132
the middle country, of 5 measured · 5 members
 Lesotho2,288
 South Africa718
Highest and lowest reading in Southern Africa.
- Eastern Europe
1,840
the middle country, of 10 measured · 10 members
 Russia29,895
 Hungary625
Highest and lowest reading in Eastern Europe.
- Caribbean
1,736
the middle country, of 14 measured · 24 members
 Jamaica3,812Barbados283
Highest and lowest reading in Caribbean.
- Western Europe
1,531
the middle country, of 7 measured · 9 members
 Austria6,083
 Netherlands621
Highest and lowest reading in Western Europe.
- Western Africa
1,282
the middle country, of 16 measured · 16 members
 Liberia37,221
 Mauritania82
Highest and lowest reading in Western Africa.
- Southern Asia
1,162
the middle country, of 9 measured · 9 members
Bhutan99,883 Maldives57
Highest and lowest reading in Southern Asia.
- Eastern Africa
824
the middle country, of 17 measured · 19 members
 Madagascar11,072
 Djibouti264
Highest and lowest reading in Eastern Africa.
- Western Asia
307
the middle country, of 16 measured · 19 members
 Georgia15,658Kuwait0
Highest and lowest reading in Western Asia.
- Northern Africa
172
the middle country, of 6 measured · 6 members
 Morocco777Egypt9
Highest and lowest reading in Northern Africa.
- Australia and New Zealand
2 of 2 measured — too few for a middle: Australia, New Zealand.
 New Zealand64,349
 Australia18,909
Highest and lowest reading in Australia and New Zealand.
- Melanesia
4 of 5 measured — too few for a middle: Fiji, Papua New Guinea, Solomon Islands, Vanuatu.
Papua New Guinea78,505 Fiji31,052
Highest and lowest reading in Melanesia.
- Micronesia
1 of 7 measured — too few for a middle: Nauru.
Nauru847Highest and lowest reading in Micronesia.
- Northern America
2 of 4 measured — too few for a middle: Canada, United States.
 Canada73,170
 United States8,437
Highest and lowest reading in Northern America.
03The whole field at once
The spread
181 countries, one dot each, on one scale — further right is a higher value. Half the countries are above 2,528; a quarter are above 9,778, and a quarter below 821. The bar in each row marks that continent’s middle country.
04All 183 ever measured
Every country
In order, highest value first. “=” marks a position shared with another country. Food and Agriculture Organization of the United Nations (FAO) ranks nobody on this measure; the position is derived here by ordering the published values. Internal resources only. A country living off a river that rises somewhere else reads far lower than the water it actually has — Egypt and Iraq are the obvious cases — which makes them look drier than they are while saying something true about how much of their water is theirs to control.
Showing 25 of 183 countries








































































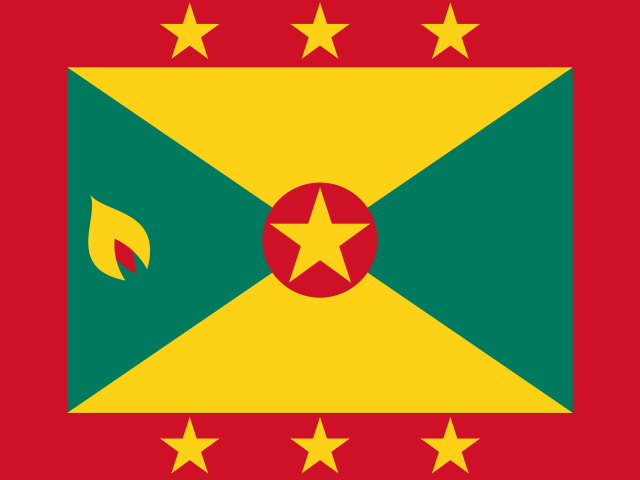
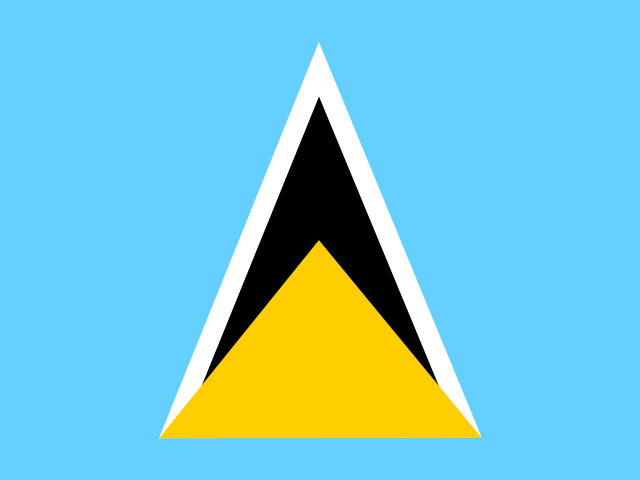

















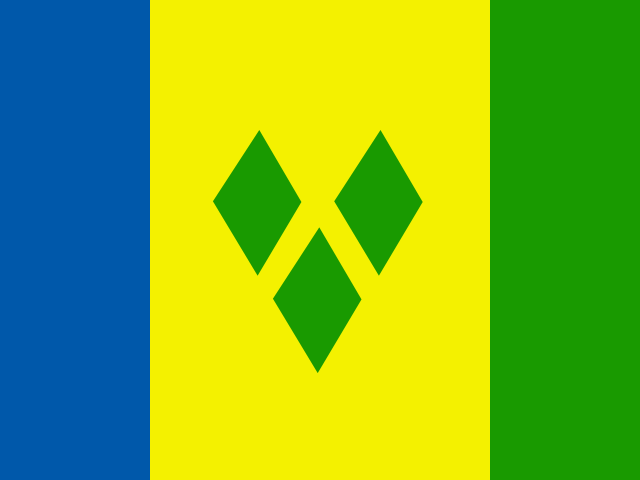
















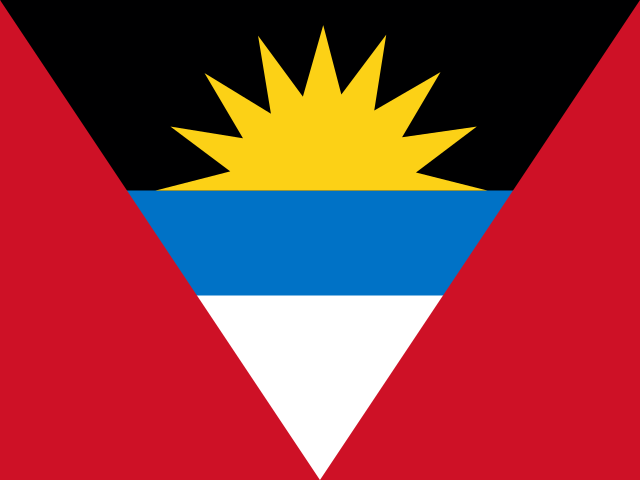



















Values for 2022. The change column compares 2022 with 2021 only; the sparkline covers the recent editions.
051961–2022 · 62 reference years
Over time
Each point is one reference year from 1961. The figures move mostly because POPULATION moves; the water itself is revised rarely.
- the middle country
- the middle half of countries
- the middle of the 142 countries measured every time
- each continent’s middle country
The same, year by year
| Year | Countries | Middle country | Middle half | Measured every time |
|---|---|---|---|---|
| 2022 | 181 | 2,528 | 821 – 9,778 | 2,435 |
| 2021 | 183 | 2,498 | 827 – 9,770 | 2,441 |
| 2020 | 183 | 2,507 | 839 – 9,874 | 2,458 |
| 2019 | 183 | 2,512 | 851 – 10,031 | 2,467 |
| 2018 | 183 | 2,568 | 871 – 10,160 | 2,475 |
| 2017 | 183 | 2,534 | 886 – 10,246 | 2,488 |
| 2016 | 183 | 2,525 | 896 – 10,255 | 2,523 |
| 2015 | 183 | 2,594 | 912 – 10,255 | 2,561 |
| 2014 | 183 | 2,632 | 931 – 10,262 | 2,587 |
| 2013 | 183 | 2,645 | 956 – 10,398 | 2,605 |
| 2012 | 183 | 2,657 | 982 – 10,528 | 2,614 |
| 2011 | 181 | 2,787 | 1,020 – 10,698 | 2,633 |
| 2010 | 181 | 2,774 | 1,051 – 10,837 | 2,651 |
| 2009 | 181 | 2,757 | 1,083 – 11,070 | 2,667 |
| 2008 | 181 | 2,739 | 1,092 – 11,315 | 2,682 |
| 2007 | 181 | 2,723 | 1,099 – 11,571 | 2,698 |
| 2006 | 181 | 2,732 | 1,103 – 11,840 | 2,710 |
| 2005 | 180 | 2,744 | 1,093 – 12,464 | 2,710 |
| 2004 | 180 | 2,742 | 1,102 – 12,771 | 2,687 |
| 2003 | 180 | 2,741 | 1,120 – 13,058 | 2,674 |
| 2002 | 180 | 2,741 | 1,132 – 13,352 | 2,682 |
| 2001 | 180 | 2,768 | 1,140 – 13,660 | 2,708 |
| 2000 | 180 | 2,786 | 1,148 – 13,901 | 2,739 |
| 1999 | 180 | 2,819 | 1,156 – 14,028 | 2,785 |
| 1998 | 180 | 2,857 | 1,169 – 13,909 | 2,834 |
| 1997 | 180 | 2,890 | 1,176 – 14,029 | 2,884 |
| 1996 | 180 | 2,926 | 1,188 – 14,333 | 2,926 |
| 1995 | 180 | 2,960 | 1,210 – 14,625 | 2,967 |
| 1994 | 180 | 2,992 | 1,235 – 14,962 | 3,014 |
| 1993 | 180 | 3,084 | 1,240 – 15,352 | 3,084 |
| 1992 | 176 | 3,186 | 1,226 – 16,294 | 3,155 |
| 1991 | 157 | 3,205 | 1,262 – 21,341 | 3,210 |
| 1990 | 157 | 3,218 | 1,288 – 21,458 | 3,223 |
| 1989 | 156 | 3,276 | 1,350 – 22,368 | 3,276 |
| 1988 | 156 | 3,346 | 1,368 – 22,611 | 3,346 |
| 1987 | 156 | 3,474 | 1,399 – 22,852 | 3,474 |
| 1986 | 156 | 3,526 | 1,417 – 23,036 | 3,526 |
| 1985 | 156 | 3,579 | 1,433 – 23,216 | 3,579 |
| 1984 | 156 | 3,668 | 1,459 – 23,422 | 3,668 |
| 1983 | 156 | 3,784 | 1,502 – 23,803 | 3,784 |
| 1982 | 156 | 3,840 | 1,548 – 24,446 | 3,840 |
| 1981 | 156 | 3,864 | 1,570 – 25,103 | 3,864 |
| 1980 | 156 | 3,803 | 1,602 – 25,788 | 3,889 |
| 1979 | 156 | 3,866 | 1,640 – 26,500 | 3,919 |
| 1978 | 156 | 3,933 | 1,677 – 27,238 | 3,958 |
| 1977 | 156 | 3,985 | 1,716 – 27,929 | 4,037 |
| 1976 | 156 | 4,047 | 1,750 – 28,611 | 4,117 |
| 1975 | 156 | 4,175 | 1,794 – 29,318 | 4,244 |
| 1974 | 156 | 4,328 | 1,857 – 30,012 | 4,401 |
| 1973 | 156 | 4,433 | 1,893 – 30,703 | 4,541 |
| 1972 | 156 | 4,509 | 1,930 – 31,439 | 4,697 |
| 1971 | 156 | 4,580 | 1,970 – 32,201 | 4,858 |
| 1970 | 156 | 4,665 | 2,027 – 32,978 | 5,023 |
| 1969 | 156 | 4,804 | 2,070 – 33,416 | 5,191 |
| 1968 | 156 | 4,948 | 2,133 – 33,844 | 5,364 |
| 1967 | 156 | 5,093 | 2,174 – 34,307 | 5,541 |
| 1966 | 156 | 5,231 | 2,227 – 34,802 | 5,709 |
| 1965 | 156 | 5,357 | 2,288 – 35,325 | 5,850 |
| 1964 | 156 | 5,483 | 2,352 – 35,875 | 5,935 |
| 1963 | 156 | 5,614 | 2,427 – 36,452 | 6,026 |
| 1962 | 156 | 5,748 | 2,509 – 37,052 | 6,120 |
| 1961 | 143 | 5,964 | 2,585 – 35,233 | 6,216 |
062021 → 2022
Who rose and fell
The biggest changes in value between the two newest editions — reference years recalculated in one report, not two separate publications. Places are shown second, because they also move when other countries do.
Improved most
before → after Albania10,804 → 10,972 · 43rd → 43rd+168
- Bosnia and Herzegovina10,940 → 11,077 · 42nd → 41st+137
- Russia29,790 → 29,895 · 20th → 20th+105
 Ukraine1,244 → 1,342 · 120th → 116th+98
 Central African Republic27,582 → 27,658 · 22nd → 22nd+76
Declined most
before → after- Iceland456,351 → 445,023 · 1st → 1st−11,329
- Guyana295,531 → 293,317 · 2nd → 2nd−2,214
- Gabon69,003 → 67,469 · 8th → 8th−1,534
- Papua New Guinea79,997 → 78,505 · 5th → 5th−1,492
 Solomon Islands58,616 → 57,229 · 10th → 10th−1,386
181 countries were measured in both 2021 and 2022. The field changed from 183 to 181 countries, so a place can move for reasons that have nothing to do with the country itself.
07Across every edition
Renewable freshwater per person in records
The extremes of the statistic. A record reached by more than one country names none of them.
Highest reading on record
949,567
Renewable internal freshwater (cubic metres per person)
Lowest reading on record
0
Renewable internal freshwater (cubic metres per person)
Biggest improvement between editions
+12,281
89,942 → 102,222
Biggest decline between editions
−25,194
171,272 → 146,078
Most improved since first measured
+3,730
11,928 → 15,658
At the top most often
62 of 62
editions, alone at the first-listed end
08The measure
About renewable freshwater per person
This measures how much renewable freshwater a country generates inside its own borders each year, divided by its population. The Falkenmark thresholds rest on it: below 1,700 cubic metres a head is water stress, and below 1,000 is scarcity — which is why more here is genuinely better and not merely larger.
What the number is: Renewable internal freshwater (cubic metres per person).
09Where it fits
Connections
Its part in the Country Index, the statistics whose values line up most closely with it across countries, and others on the same subject.
In the Country Index
Context, with no vote
This statistic is published in full under Environment & Sustainability and Risk & Resilience, but does not help decide any Country Index standing.
Environment & SustainabilityRisk & ResilienceWhich statistics vote, and why
Moves with
Where renewable freshwater per person is higher, these tend to be higher too.
- Forest AreaFAO · 181 countries in commonρ 0.69
- Tree Cover LossWorld Resources Institute — Global Forest Watch (data: University of Maryland) · 181 countries in commonρ 0.57
- Hydro Share of Electricity GenerationEmber · 145 countries in commonρ 0.54
Moves against
Where renewable freshwater per person is higher, these tend to be lower.
- Water StressKeyFAO · 176 countries in commonρ −0.62
- Drought Risk (Aqueduct)WRI · 137 countries in commonρ −0.51
- Baseline Water Stress (Aqueduct)WRI · 160 countries in commonρ −0.50
Rank correlation (ρ, from −1 to 1) across countries, on each statistic’s newest edition, out of 379 statistics sharing at least 80 countries with this one. Two statistics that move together do not cause each other.
10Keep reading
Explore further
11Questions
Renewable freshwater per person: questions and answers
Which country has the highest renewable freshwater per person?
Iceland, at 445,023, among the 181 countries compared in 2022.
Which country has the lowest renewable freshwater per person?
Kuwait, at 0, among the 181 countries compared in 2022.
How many countries does the Renewable Internal Freshwater Resources per Capita cover?
181 in 2022, and 183 at least once across all editions. The number measured varies from 143 to 183 between editions.
What is the world average renewable freshwater per person?
This site does not calculate a world average, which would depend on how countries are weighted. In the middle country of the 181 compared in 2022, the figure was 2,528.
Is this Food and Agriculture Organization of the United Nations (FAO)’s own ranking?
No. Food and Agriculture Organization of the United Nations (FAO) publishes the values but ranks nobody; the position on this page is derived by Nations Inquiry by ordering the published values, and equal values share a position.
How often is the Renewable Internal Freshwater Resources per Capita published?
This site holds 62 reference years, 1961–2022, all recalculated in Food and Agriculture Organization of the United Nations (FAO)’s 2026 report on one method — not 62 separate publications.
Where does the data come from, and can I download it?
From Food and Agriculture Organization of the United Nations (FAO), under CC BY 4.0. From FAO AQUASTAT via the World Bank’s indicator API (ER.H2O.INTR.PC). Every edition is on this site’s Datasets pages as a full table, and downloads as a CSV file with every value unrounded.
12Method
Sources, method and citation
Source
Renewable Internal Freshwater Resources per Capita — Food and Agriculture Organization of the United Nations (FAO)
From FAO AQUASTAT via the World Bank’s indicator API (ER.H2O.INTR.PC).
Newest edition
Report year 2022Data year 2022
Cite the source as: Food and Agriculture Organization of the United Nations. AQUASTAT. Rome: FAO.
Licence: CC BY 4.0, checked 2026-09-06.
How this page reads the numbers
- Food and Agriculture Organization of the United Nations (FAO) ranks nobody on this measure. The position is derived by Nations Inquiry by ordering the published values; equal values share a position.
- Which end is better follows the publisher’s own reading of the measure.
- A country is named at an end only when it holds that value alone. Where several share it, the page says how many and names none first.
- Values are stored exactly as published and trimmed only for display. “The middle country” is the median of the countries measured, not a world average.
The file itself, column by column — where it came from, what each column holds, and every edition as a CSV — is on its dataset page.
Photographs
The countries at the top of this statistic, from their profiles: Wikimedia Commons, shown in greyscale, each used under the licence named.
- Iceland — Hansueli Krapf, CC BY-SA 3.0
- Guyana — Bill Cameron, CC BY-SA 3.0
- Suriname — WiDi, CC BY-SA 3.0
Cite this page
Nations Inquiry (2026). Renewable freshwater per person by country: Renewable Internal Freshwater Resources per Capita, data from Food and Agriculture Organization of the United Nations (FAO). https://nationsinquiry.com/statistics/freshwater-per-capita