Loading…
World Bank Group · Tariff Rate, Applied, Weighted Mean, All Products
Tariff rate by country
What average tariff does a country charge on the goods it imports?
Of the 143 countries compared in 2022, Bermuda had the highest reading, 29.52%, and 3 countries shared the lowest reading, 0.00%. In the middle country the figure was 3.66%. Among the 22 countries measured in every edition since 1999, the middle one moved from 4.95% to 1.84%.
Tariff rate · 2022
Context statistic

Highest of 143Bermuda
29.52%012022 · values only
The highest and the lowest
The three countries with the highest values of 143 compared, the three with the lowest, and the highest on each continent. This statistic has no better end, so no country is shown as leading.
- 1
- 2

- 3



Highest on each continent
- Africa
2 countries share 18.18%
- AmericasBermuda29.52%
- Asia
 Nepal11.20%
 - Europe
- OceaniaSolomon Islands20.66%
- Every region
02Every measured country
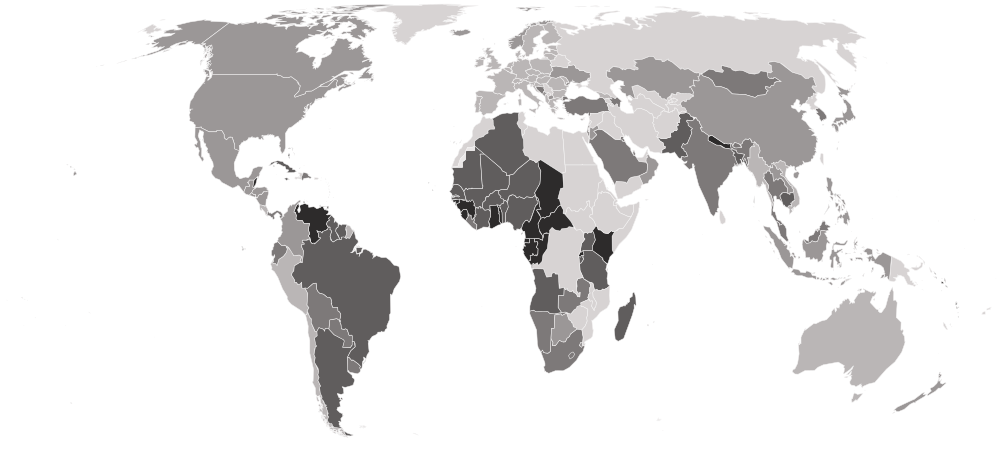
Tariff rate on a map
Each country is shaded by its value, in five groups holding the same number of countries. Hover a country for its value, or select it to open its profile. Below the map, each continent’s middle country.
Darker is a higher value. This statistic has no better end, so the shades describe size, not success.
- 0.00–1.33%
- 1.37–3.23%
- 3.36–6.44%
- 6.45–10.56%
- 11.11–29.52%
- No reading in 2022 (45 measured in an earlier edition)
- Africa
8.93%
the middle country, of 38 measured · 55 members
2 share 18.18%
 Mauritius1.20%
Highest and lowest reading in Africa.
- Oceania
6.44%
the middle country, of 5 measured · 21 members
Solomon Islands20.66% Australia0.99%
Highest and lowest reading in Oceania.
- Americas
5.19%
the middle country, of 31 measured · 48 members
Bermuda29.52% Chile0.46%
Highest and lowest reading in Americas.
- Asia
3.31%
the middle country, of 34 measured · 52 members
Nepal11.20%3 share 0.00%
Highest and lowest reading in Asia.
- Europe
1.33%
the middle country, of 35 measured · 49 members
 Bosnia and Herzegovina4.04%
 Albania0.26%
Highest and lowest reading in Europe.
- Every region
21 sub-regions, highest middle country first
- Middle Africa
16.80%
the middle country, of 7 measured · 9 members
2 share 18.18%
 Angola8.85%
Highest and lowest reading in Middle Africa.
- Western Africa
9.75%
the middle country, of 16 measured · 16 members
 Gambia16.44%
 Liberia6.22%
Highest and lowest reading in Western Africa.
- Caribbean
9.21%
the middle country, of 8 measured · 24 members
 Bahamas16.34%
 Dominican Republic3.97%
Highest and lowest reading in Caribbean.
- Southern Asia
9.09%
the middle country, of 6 measured · 9 members
Nepal11.20% India4.59%
Highest and lowest reading in Southern Asia.
- Eastern Africa
8.64%
the middle country, of 9 measured · 19 members
 Kenya11.70%Mauritius1.20%
Highest and lowest reading in Eastern Africa.
- South America
5.14%
the middle country, of 12 measured · 12 members
 Venezuela12.84%Chile0.46%
Highest and lowest reading in South America.
- Western Asia
3.66%
the middle country, of 11 measured · 19 members
 Azerbaijan5.45%
 Georgia0.42%
Highest and lowest reading in Western Asia.
- Southern Africa
3.36%
the middle country, of 5 measured · 5 members
 South Africa4.66%
 Eswatini2.98%
Highest and lowest reading in Southern Africa.
- Central America
2.14%
the middle country, of 8 measured · 8 members
 Belize18.05%
 Costa Rica1.30%
Highest and lowest reading in Central America.
- Eastern Asia
1.91%
the middle country, of 6 measured · 8 members
 South Korea5.66%
2 share 0.00%
Highest and lowest reading in Eastern Asia.
- South-eastern Asia
1.59%
the middle country, of 10 measured · 11 members
 Cambodia7.20%
 Singapore0.00%
Highest and lowest reading in South-eastern Asia.
- Eastern Europe
1.33%
the middle country, of 8 measured · 10 members
 Ukraine1.86%
 Moldova1.16%
Highest and lowest reading in Eastern Europe.
- Northern Europe
1.33%
the middle country, of 10 measured · 13 members
 Norway2.31%
 United Kingdom1.00%
Highest and lowest reading in Northern Europe.
- Southern Europe
1.33%
the middle country, of 11 measured · 17 members
Bosnia and Herzegovina4.04%Albania0.26%Highest and lowest reading in Southern Europe.
- Western Europe
1.33%
the middle country, of 6 measured · 9 members
5 share 1.33%
 Switzerland1.30%
Highest and lowest reading in Western Europe.
- Australia and New Zealand
2 of 2 measured — too few for a middle: Australia, New Zealand.
 New Zealand1.70%Australia0.99%
Highest and lowest reading in Australia and New Zealand.
- Central Asia
1 of 5 measured — too few for a middle: Kazakhstan.
 Kazakhstan2.90%
Highest and lowest reading in Central Asia.
- Melanesia
2 of 5 measured — too few for a middle: Solomon Islands, Vanuatu.
Solomon Islands20.66% Vanuatu11.48%
Highest and lowest reading in Melanesia.
- Northern Africa
1 of 6 measured — too few for a middle: Algeria.
 Algeria9.25%
Highest and lowest reading in Northern Africa.
- Northern America
3 of 4 measured — too few for a middle: Bermuda, Canada, United States.
Bermuda29.52% Canada1.37%
Highest and lowest reading in Northern America.
- Polynesia
1 of 7 measured — too few for a middle: Tonga.
 Tonga6.44%
Highest and lowest reading in Polynesia.
03The whole field at once
The spread
143 countries, one dot each, on one scale — further right is a higher value. Half the countries are above 3.66%; a quarter are above 8.80%, and a quarter below 1.33%. The bar in each row marks that continent’s middle country.
04All 188 ever measured
Every country
In order, highest value first. No rank or position is shown: too many countries share the same value for an order to mean anything. Neither end is the good end. A tariff is a policy choice, and a zero can describe a free port rather than a policy of openness. European Union members apply one common tariff, so they share a single figure. And because the average is weighted by imports, a tariff high enough to stop a product being imported at all barely counts.
Showing 25 of 188 countries















































































































































Values for 2022. The change column compares 2022 with 2021 only; the sparkline covers the recent editions.
051999–2022 · 24 reference years
Over time
Each point is one reference year from 1999. The Bank restates the series with each release, so the line reads as one consistent series rather than a set of past publications.
- the middle country
- the middle half of countries
- the middle of the 22 countries measured every time
- each continent’s middle country
The same, year by year
| Year | Countries | Middle country | Middle half | Measured every time |
|---|---|---|---|---|
| 2022 | 143 | 3.66% | 1.33% – 8.80% | 1.84% |
| 2021 | 158 | 3.21% | 1.39% – 8.41% | 2.03% |
| 2020 | 157 | 3.63% | 1.48% – 8.67% | 1.93% |
| 2019 | 137 | 4.13% | 1.84% – 9.55% | 3.21% |
| 2018 | 133 | 3.39% | 1.83% – 8.55% | 2.20% |
| 2017 | 129 | 2.93% | 1.96% – 7.83% | 2.42% |
| 2016 | 148 | 3.87% | 2.09% – 8.17% | 2.36% |
| 2015 | 158 | 3.82% | 2.02% – 7.80% | 2.16% |
| 2014 | 133 | 3.26% | 2.03% – 7.43% | 2.16% |
| 2013 | 157 | 4.23% | 1.49% – 8.42% | 1.91% |
| 2012 | 157 | 4.43% | 1.76% – 8.16% | 2.57% |
| 2011 | 161 | 4.85% | 1.77% – 8.48% | 2.63% |
| 2010 | 158 | 5.14% | 2.13% – 9.22% | 2.50% |
| 2009 | 151 | 4.28% | 1.85% – 9.15% | 2.64% |
| 2008 | 157 | 4.40% | 1.85% – 8.85% | 2.82% |
| 2007 | 154 | 5.14% | 2.24% – 9.23% | 3.04% |
| 2006 | 154 | 5.41% | 2.30% – 9.51% | 2.76% |
| 2005 | 138 | 5.73% | 2.46% – 9.87% | 3.33% |
| 2004 | 127 | 5.29% | 2.24% – 10.45% | 3.72% |
| 2003 | 127 | 8.33% | 3.30% – 11.84% | 4.05% |
| 2002 | 144 | 8.61% | 3.84% – 12.80% | 4.06% |
| 2001 | 137 | 8.33% | 3.47% – 12.11% | 4.51% |
| 2000 | 106 | 8.46% | 2.94% – 13.31% | 4.41% |
| 1999 | 80 | 10.04% | 5.72% – 15.70% | 4.95% |
062021 → 2022
Who rose and fell
The biggest changes in value between the two newest editions — reference years recalculated in one report, not two separate publications. Places are shown second, because they also move when other countries do.
Rose most
before → after- Solomon Islands14.31% → 20.66%+6.35
- Bermuda23.84% → 29.52%+5.68
 Guyana4.73% → 9.27%+4.54
 Togo10.73% → 13.56%+2.83
 Cabo Verde9.96% → 12.56%+2.60
Fell most
before → after Nigeria12.20% → 9.34%−2.86
- Angola11.33% → 8.85%−2.48
 Pakistan9.03% → 7.61%−1.42
 Trinidad and Tobago8.87% → 7.51%−1.36
- India5.87% → 4.59%−1.28
132 countries were measured in both 2021 and 2022. The field changed from 158 to 143 countries, so a place can move for reasons that have nothing to do with the country itself.
07Across every edition
Tariff rate in records
The extremes of the statistic. A record reached by more than one country names none of them.
Highest reading on record
421.50%
Applied tariff rate, trade-weighted mean (%)
Lowest reading on record
Reached 55 times by 6 countries — shared, so no holder is named
0.00%
Applied tariff rate, trade-weighted mean (%)
Biggest rise between editions
+408.21
13.29% → 421.50%
Biggest fall between editions
−408.85
421.50% → 12.65%
Biggest change since first measured
+10.77
18.75% → 29.52%
Highest most often
5 of 24
editions, alone at the first-listed end
08The measure
About tariff rate
This is the average tariff a country actually charges on the goods it imports, weighted by how much of each product it buys. It is the simplest single reading of how much a border taxes trade.
What the number is: Applied tariff rate, trade-weighted mean (%).
What it does not measure
Because the average is weighted by what is imported, a tariff high enough to stop a product being imported at all barely counts. It leaves out quotas, standards and every other barrier that is not a tariff.
09Where it fits
Connections
Its part in the Country Index, the statistics whose values line up most closely with it across countries, and others on the same subject.
In the Country Index
Context, with no vote
This statistic is published in full under Economy & Innovation and Mobility & Trade, but does not help decide any Country Index standing.
Economy & InnovationMobility & TradeWhich statistics vote, and why
Moves with
Where tariff rate is higher, these tend to be higher too.
- Gender Inequality IndexUNDP Human Development Report Office · 135 countries in commonρ 0.71
- Coefficient of Human InequalityUNDP Human Development Report Office · 129 countries in commonρ 0.70
- Maternal Mortality RatioKeyMMEIG · 140 countries in commonρ 0.69
Moves against
Where tariff rate is higher, these tend to be lower.
- Learning-Adjusted Years of SchoolWorld Bank Group · 131 countries in commonρ −0.75
- Human Capital IndexWorld Bank Group · 131 countries in commonρ −0.75
- GNI per Capita (PPP)World Bank Group · 80 countries in commonρ −0.74
Rank correlation (ρ, from −1 to 1) across countries, on each statistic’s newest edition, out of 176 statistics sharing at least 80 countries with this one. Two statistics that move together do not cause each other.
10Keep reading
Explore further
The subject
The countries at either end
More from World Bank Group
- Access to Electricity
- Account Ownership at a Financial Institution
- Adjusted Net Savings
- Agriculture, Forestry and Fishing Value Added (% of GDP)
- Average Time to Clear Exports Through Customs
- Business Ready: Operational Efficiency
- Business Ready: Public Services
- Business Ready: Regulatory Framework
- All statistics
11Questions
Tariff rate: questions and answers
Which country has the highest tariff rate?
Bermuda, at 29.52%, among the 143 countries compared in 2022.
Which country has the lowest tariff rate?
3 countries share the lowest reading, 0.00%, among the 143 compared in 2022, so no single country is named.
How many countries does the Tariff Rate, Applied, Weighted Mean, All Products cover?
143 in 2022, and 188 at least once across all editions. The number measured varies from 80 to 161 between editions.
What is the world average tariff rate?
This site does not calculate a world average, which would depend on how countries are weighted. In the middle country of the 143 compared in 2022, the figure was 3.66%.
Is this World Bank Group’s own ranking?
No ranking is shown. World Bank Group publishes values only, and too many countries share the same value for an ordering to mean anything, so none is derived.
How often is the Tariff Rate, Applied, Weighted Mean, All Products published?
This site holds 24 reference years, 1999–2022, all recalculated in World Bank Group’s 2026 report on one method — not 24 separate publications.
Where does the data come from, and can I download it?
From World Bank Group, under CC BY 4.0. World Bank staff estimates from the World Integrated Trade Solution, read from the World Development Indicators through the Bank’s indicator API (TM.TAX.MRCH.WM.AR.ZS), stored to the two decimals the Bank publishes. Only the Bank’s computed average is used, not the underlying tariff and trade records. Every edition is on this site’s Datasets pages as a full table, and downloads as a CSV file with every value unrounded.
12Method
Sources, method and citation
Source
Tariff Rate, Applied, Weighted Mean, All Products — World Bank Group
World Bank staff estimates from the World Integrated Trade Solution, read from the World Development Indicators through the Bank’s indicator API (TM.TAX.MRCH.WM.AR.ZS), stored to the two decimals the Bank publishes. Only the Bank’s computed average is used, not the underlying tariff and trade records.
Newest edition
Report year 2022Data year 2022
Cite the source as: World Bank. World Development Indicators: Tariff rate, applied, weighted mean, all products (TM.TAX.MRCH.WM.AR.ZS), staff estimates from the World Integrated Trade Solution. Washington, DC: World Bank Group.
Licence: CC BY 4.0, checked 2026-09-26.
How this page reads the numbers
- No rank or position is shown: World Bank Group publishes values only, and too many countries share the same value for an ordering to mean anything.
- This statistic has no better end, so the page describes higher and lower values and never calls a country a leader.
- A country is named at an end only when it holds that value alone. Where several share it, the page says how many and names none first.
- Values are stored exactly as published and trimmed only for display. “The middle country” is the median of the countries measured, not a world average.
The file itself, column by column — where it came from, what each column holds, and every edition as a CSV — is on its dataset page.
Cite this page
Nations Inquiry (2026). Tariff rate by country: Tariff Rate, Applied, Weighted Mean, All Products, data from World Bank Group. https://nationsinquiry.com/statistics/tariff-rate