Loading…
World Bank Group · Average Time to Clear Exports Through Customs
Time to clear exports through customs by country
How many days does it take exporters to get goods through customs?
Of the 160 countries compared in the 2025 edition, 2 countries shared the lowest reading, 1.0000, and Philippines had the highest reading, 27.4579. In the middle country the figure was 4.1977. 15 readings from before 2015 are listed but not compared.
Part ofMobility & Trade
Time to clear exports through customs · the 2025 edition
Context statistic
2 countries share the lowest value, 1.0000 — no single country is named first.
01the 2025 edition · position · derived
Who leads
The three countries at the lowest end of 160 compared, the three at the other end, and the first on each continent.
Lowest in the 2025 edition · shared
2 countries share the lowest reading, 1.0000
No single country is named first: picking one from a shared value would be a choice the data does not make.
Highest in the 2025 edition
 Philippines27.4579
 New Zealand24.7929
 Mexico20.5493
Where a country sits says how it compares with the others measured, and nothing about why.
02Every measured country
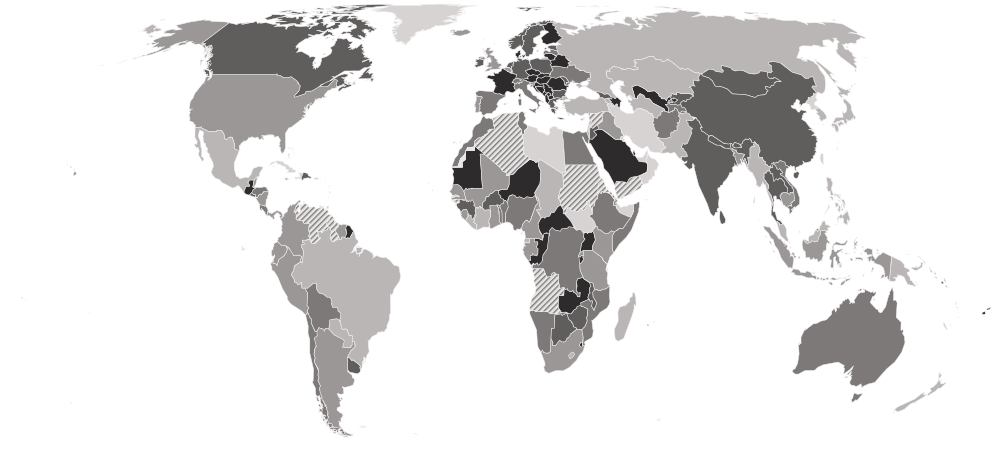
Time to clear exports through customs on a map
Each country is shaded by its value, in five groups holding the same number of countries. Hover a country for its value, or select it to open its profile. Below the map, each continent’s middle country.
Darker is a lower value — the better end.
- 8.6781–27.4579
- 5.1910–8.5828
- 3.5150–5.1742
- 2.3972–3.5128
- 1.0000–2.3889
- Hatched: a reading from before 2015, listed but not compared (15)
- No reading in the 2025 edition
- Europe
2.5200
the middle country, of 40 measured · 49 members
 Albania1.0155
 Russia15.5679
Lowest and highest reading in Europe.
- Asia
4.5687
the middle country, of 42 measured · 52 members
 Qatar1.2997Philippines27.4579
Lowest and highest reading in Asia.
- Africa
4.6233
the middle country, of 44 measured · 55 members
2 share 1.0000
 Madagascar18.3731
Lowest and highest reading in Africa.
- Oceania
5.0629
the middle country, of 7 measured · 21 members
 Fiji2.0206New Zealand24.7929
Lowest and highest reading in Oceania.
- Americas
5.5404
the middle country, of 27 measured · 48 members
 Guatemala1.2419Mexico20.5493
Lowest and highest reading in Americas.
- Every region
21 sub-regions, lowest middle country first
- Southern Europe
1.6801
the middle country, of 13 measured · 17 members
Albania1.0155 Portugal7.7120
Lowest and highest reading in Southern Europe.
- Eastern Europe
2.5005
the middle country, of 10 measured · 10 members
 Belarus1.4176Russia15.5679
Lowest and highest reading in Eastern Europe.
- Western Europe
2.8094
the middle country, of 7 measured · 9 members
 France2.2018
 Belgium5.2242
Lowest and highest reading in Western Europe.
- Northern Europe
2.9871
the middle country, of 10 measured · 13 members
 Denmark1.1516
 Iceland7.5901
Lowest and highest reading in Northern Europe.
- Southern Asia
3.3239
the middle country, of 8 measured · 9 members
 Sri Lanka2.4599
 Pakistan18.5878
Lowest and highest reading in Southern Asia.
- Southern Africa
3.7851
the middle country, of 5 measured · 5 members
 Eswatini1.0000
 Lesotho13.9470
Lowest and highest reading in Southern Africa.
- Central Asia
4.3989
the middle country, of 5 measured · 5 members
 Uzbekistan2.2675
 Kazakhstan12.9570
Lowest and highest reading in Central Asia.
- Eastern Africa
4.4159
the middle country, of 14 measured · 19 members
 Uganda1.5403Madagascar18.3731
Lowest and highest reading in Eastern Africa.
- Central America
4.6927
the middle country, of 8 measured · 8 members
Guatemala1.2419Mexico20.5493Lowest and highest reading in Central America.
- Western Africa
5.1168
the middle country, of 14 measured · 16 members
 Mauritania1.0000
 Côte d’Ivoire17.8144
Lowest and highest reading in Western Africa.
- Western Asia
5.1661
the middle country, of 13 measured · 19 members
Qatar1.2997 Armenia12.4613
Lowest and highest reading in Western Asia.
- Middle Africa
5.7747
the middle country, of 8 measured · 9 members
 Republic of the Congo1.9206
 Equatorial Guinea14.0000
Lowest and highest reading in Middle Africa.
- South America
6.0201
the middle country, of 10 measured · 12 members
 Uruguay2.9337
 Paraguay16.3734
Lowest and highest reading in South America.
- South-eastern Asia
6.3384
the middle country, of 11 measured · 11 members
 Thailand2.6027Philippines27.4579
Lowest and highest reading in South-eastern Asia.
- Caribbean
9.9927
the middle country, of 7 measured · 24 members
 Saint Vincent and the Grenadines3.2590
 Trinidad and Tobago16.1053
Lowest and highest reading in Caribbean.
- Eastern Asia
10.1038
the middle country, of 5 measured · 8 members
 Mongolia2.6874
 South Korea15.4442
Lowest and highest reading in Eastern Asia.
- Australia and New Zealand
2 of 2 measured — too few for a middle: Australia, New Zealand.
 Australia5.0629New Zealand24.7929
Lowest and highest reading in Australia and New Zealand.
- Melanesia
3 of 5 measured — too few for a middle: Fiji, Papua New Guinea, Solomon Islands.
Fiji2.0206 Papua New Guinea12.5555
Lowest and highest reading in Melanesia.
- Northern Africa
3 of 6 measured — too few for a middle: Egypt, Morocco, Tunisia.
 Morocco3.5150
 Egypt3.9879
Lowest and highest reading in Northern Africa.
- Northern America
2 of 4 measured — too few for a middle: Canada, United States.
 Canada3.2901
 United States8.2246
Lowest and highest reading in Northern America.
- Polynesia
2 of 7 measured — too few for a middle: Samoa, Tonga.
 Samoa4.0576
 Tonga14.0000
Lowest and highest reading in Polynesia.
03The whole field at once
The spread
160 countries, one dot each, on one scale — further right is a higher value. Half the countries are above 4.1977; a quarter are above 7.6206, and a quarter below 2.7022. The bar in each row marks that continent’s middle country.
04All 175 ever measured
Every country
In order, highest value first — position 1 is the highest value, the way World Bank Group’s own tables read. “=” marks a position shared with another country. World Bank Group ranks nobody on this measure; the position is derived here by ordering the published values. Only firms that export directly are asked. In a small economy that can be a handful of the firms surveyed, so one country’s average may rest on very few answers, and differences of a day or two near the top of the table are within that noise. It is also what firms report, not a timed measurement at the border.
Showing 25 of 175 countries





































































































































Values for the 2025 edition.
05In this edition
Time to clear exports through customs in records
The extremes of the statistic. A record reached by more than one country names none of them.
Highest reading
27.4579
Average time to clear exports through customs (days)
Lowest reading
Reached 2 times by 2 countries — shared, so no holder is named
1.0000
Average time to clear exports through customs (days)
06The measure
About time to clear exports through customs
This is how many days, on average, exporting firms say it takes to get a shipment of their goods through customs. It is a practical measure of how much friction a border adds to selling abroad.
What the number is: Average time to clear exports through customs (days).
What it does not measure
It is what exporting firms report, not a timed measurement at the border, and in a small economy it can rest on very few firms.
07Where it fits
Connections
Its part in the Country Index, the statistics whose values line up most closely with it across countries, and others on the same subject.
In the Country Index
Context, with no vote
This statistic is published in full under Mobility & Trade, but does not help decide any Country Index standing.
Moves with
Where time to clear exports through customs is higher, these tend to be higher too.
No statistic lines up this closely.
Moves against
Where time to clear exports through customs is higher, these tend to be lower.
No statistic lines up this closely.
Rank correlation (ρ, from −1 to 1) across countries, on each statistic’s newest edition, out of 184 statistics sharing at least 80 countries with this one. Two statistics that move together do not cause each other.
08Keep reading
Explore further
The subject
The data, edition by edition
The countries at either end
More from World Bank Group
09Questions
Time to clear exports through customs: questions and answers
Which country has the lowest time to clear exports through customs?
2 countries share the lowest reading, 1.0000, among the 160 compared in the 2025 edition, so no single country is named.
Which country has the highest time to clear exports through customs?
Philippines, at 27.4579, among the 160 countries compared in the 2025 edition.
How many countries does the Average Time to Clear Exports Through Customs cover?
160 in the 2025 edition, and 175 at least once across all editions.
What is the world average time to clear exports through customs?
This site does not calculate a world average, which would depend on how countries are weighted. In the middle country of the 160 compared in the 2025 edition, the figure was 4.1977.
Is this World Bank Group’s own ranking?
No. World Bank Group publishes the values but ranks nobody; the position on this page is derived by Nations Inquiry by ordering the published values, and equal values share a position.
How often is the Average Time to Clear Exports Through Customs published?
This site holds one edition, describing 2025.
Where does the data come from, and can I download it?
From World Bank Group, under CC BY 4.0. World Bank Enterprise Surveys via its indicator API (IC.CUS.DURS.EX). Taken as one reading per country, because each economy is surveyed only every few years. Every edition is on this site’s Datasets pages as a full table, and downloads as a CSV file with every value unrounded.
10Method
Sources, method and citation
Source
Average Time to Clear Exports Through Customs — World Bank Group
World Bank Enterprise Surveys via its indicator API (IC.CUS.DURS.EX). Taken as one reading per country, because each economy is surveyed only every few years.
Newest edition
Report year 2025Data year not recorded
Cite the source as: World Bank. Enterprise Surveys. Washington, DC: World Bank Group.
Licence: CC BY 4.0, checked 2026-09-26.
How this page reads the numbers
- World Bank Group ranks nobody on this measure. The position is derived by Nations Inquiry by ordering the published values; equal values share a position.
- Which end is better follows the publisher’s own reading of the measure.
- A country is named at an end only when it holds that value alone. Where several share it, the page says how many and names none first.
- The file gives each country’s most recent reading, so the rows are from different years. Readings from before 2015 are listed but left out of every comparison on this page.
- Values are stored exactly as published and trimmed only for display. “The middle country” is the median of the countries measured, not a world average.
The file itself, column by column — where it came from, what each column holds, and every edition as a CSV — is on its dataset page.
Cite this page
Nations Inquiry (2026). Time to clear exports through customs by country: Average Time to Clear Exports Through Customs, data from World Bank Group. https://nationsinquiry.com/statistics/time-to-clear-exports