MAP · Insecticide-Treated Net Use
Bed net use by country
What share of people sleep under an insecticide-treated net?
Of the 40 countries compared in 2025, Niger had the highest reading, 88.6%, and Ethiopia had the lowest reading, 8.6%. In the middle country the figure was 45.0%. Among the 40 countries measured in every edition since 2000, the middle one moved from 4.0% to 45.0%.
Share
Part ofHealth & Wellbeing
Bed net use · 2025
Context statistic

Highest of 40Niger
88.6%012025 · values only
Who leads
The three countries at the highest end of 40 compared, the three at the other end, and the first on each continent.
 1
1Photo: File: Jacques Taberlet derivative work: Lkcl it · CC BY-SA 3.0, greyscale
 2
2Photo: Ferdinand Reus from Arnhem, Holland derivative work: Jjtkk · CC BY-SA 2.0, greyscale
 3
3Photo: Annabel Symington derivative work: Jjtkk · CC BY 2.0, greyscale



Highest on each continent
02Every measured country
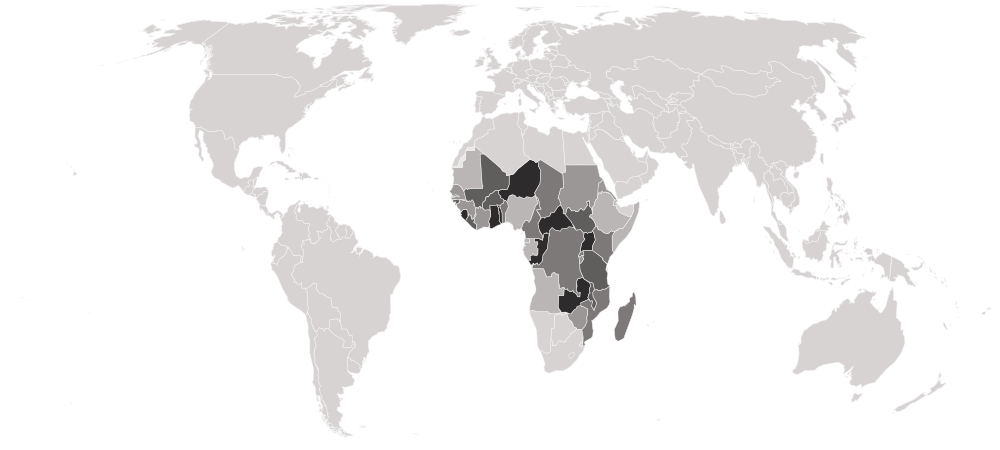
Bed net use on a map
Each country is shaded by its value, in five groups holding the same number of countries. Hover a country for its value, or select it to open its profile. Below the map, each continent’s middle country.
Darker is a higher value — the better end.
- 8.6–27.9%
- 28.1–41.2%
- 42.2–48.2%
- 48.5–61.5%
- 62.1–88.6%
- No reading in 2025
- Africa
45.0%
the middle country, of 40 measured · 55 members
Niger88.6% Ethiopia8.6%
Highest and lowest reading in Africa.
- Every region
4 sub-regions, highest middle country first
- Western Africa
49.3%
the middle country, of 15 measured · 16 members
Niger88.6% Mauritania18.7%
Highest and lowest reading in Western Africa.
- Middle Africa
46.6%
the middle country, of 8 measured · 9 members
 Central African Republic74.7%
 Gabon10.2%
Highest and lowest reading in Middle Africa.
- Eastern Africa
42.3%
the middle country, of 16 measured · 19 members
 Uganda67.5%Ethiopia8.6%
Highest and lowest reading in Eastern Africa.
- Northern Africa
1 of 6 measured — too few for a middle: Sudan.
 Sudan40.9%
Highest and lowest reading in Northern Africa.
03The whole field at once
The spread
40 countries, one dot each, on one scale — further right is a higher value. Half the countries are above 45.0%; a quarter are above 59.9%, and a quarter below 33.0%. The bar in each row marks that continent’s middle country.
04All 40 ever measured
Every country
In order, highest value first. No rank or position is shown: too many countries share the same value for an order to mean anything. Only African countries appear, because that is where MAP models net use; everywhere else is absent, not zero. The share is of the whole population, so a country where many people live outside malaria's range — in highlands or deserts — can read low without a gap in protection, which is why no positions are given. Nets are sent where malaria is worst, so high use often sits beside high malaria.
Showing 25 of 40 countries






























Values for 2025. The change column compares 2025 with 2024 only; the sparkline covers the recent editions.
052000–2025 · 26 reference years
Over time
Each point is one year from 2000, all re-estimated together in MAP's newest release, with the uncertainty band MAP publishes around each estimate. Use typically jumps after a mass net campaign and drifts down over the following years as nets wear out, so a saw-tooth line is normal.
- the middle country
- the middle half of countries
- the middle of the 40 countries measured every time
- each continent’s middle country
The same, year by year
| Year | Countries | Middle country | Middle half | Measured every time |
|---|---|---|---|---|
| 2025 | 40 | 45.0% | 33.0% – 59.9% | 45.0% |
| 2024 | 40 | 45.0% | 33.0% – 59.9% | 45.0% |
| 2023 | 40 | 54.0% | 33.4% – 64.7% | 54.0% |
| 2022 | 40 | 49.7% | 25.8% – 57.8% | 49.7% |
| 2021 | 40 | 43.7% | 31.3% – 56.2% | 43.7% |
| 2020 | 40 | 48.0% | 32.8% – 62.0% | 48.0% |
| 2019 | 40 | 47.4% | 34.2% – 59.0% | 47.4% |
| 2018 | 40 | 51.8% | 36.1% – 63.5% | 51.8% |
| 2017 | 40 | 54.2% | 32.2% – 60.4% | 54.2% |
| 2016 | 40 | 43.8% | 24.4% – 57.1% | 43.8% |
| 2015 | 40 | 45.2% | 25.8% – 57.9% | 45.2% |
| 2014 | 40 | 42.0% | 22.7% – 60.0% | 42.0% |
| 2013 | 40 | 39.6% | 18.9% – 49.8% | 39.6% |
| 2012 | 40 | 34.8% | 19.1% – 49.0% | 34.8% |
| 2011 | 40 | 30.4% | 20.0% – 49.9% | 30.4% |
| 2010 | 40 | 25.7% | 14.8% – 32.4% | 25.7% |
| 2009 | 40 | 20.8% | 11.4% – 34.4% | 20.8% |
| 2008 | 40 | 18.6% | 10.1% – 28.7% | 18.6% |
| 2007 | 40 | 13.3% | 7.3% – 25.9% | 13.3% |
| 2006 | 40 | 7.4% | 4.3% – 16.0% | 7.4% |
| 2005 | 40 | 3.4% | 2.6% – 5.9% | 3.4% |
| 2004 | 40 | 2.9% | 1.9% – 3.6% | 2.9% |
| 2003 | 40 | 2.7% | 1.8% – 3.5% | 2.7% |
| 2002 | 40 | 3.0% | 2.1% – 3.6% | 3.0% |
| 2001 | 40 | 3.4% | 2.7% – 3.9% | 3.4% |
| 2000 | 40 | 4.0% | 3.3% – 5.0% | 4.0% |
06Across every edition
Bed net use in records
The extremes of the statistic. A record reached by more than one country names none of them.
Highest reading on record
88.6%
Population that slept under an insecticide-treated net (%)
Lowest reading on record
0.6%
Population that slept under an insecticide-treated net (%)
Biggest improvement between editions
+50.1
26.2% → 76.3%
Biggest decline between editions
−34.5
52.4% → 17.9%
Most improved since first measured
+85.3
3.3% → 88.6%
At the top most often
10 of 26
editions, alone at the first-listed end
07The measure
About bed net use
This is the share of people who slept under an insecticide-treated bed net, modelled by the Malaria Atlas Project for the African countries where malaria is endemic. Nets are the main way malaria is prevented in Africa: they protect the sleeper from the night-biting mosquitoes that carry the parasite, and the insecticide kills mosquitoes that land on them.
What the number is: Population that slept under an insecticide-treated net (%).
08Where it fits
Connections
Its part in the Country Index, the statistics whose values line up most closely with it across countries, and others on the same subject.
In the Country Index
Context, with no vote
This statistic is published in full under Health & Wellbeing, but does not help decide any Country Index standing.
Moves with
Where bed net use is higher, these tend to be higher too.
No statistic lines up this closely.
Moves against
Where bed net use is higher, these tend to be lower.
No statistic lines up this closely.
Rank correlation (ρ, from −1 to 1) across countries, on each statistic’s newest edition, out of 0 statistics sharing at least 80 countries with this one. Two statistics that move together do not cause each other.
09Keep reading
Explore further
The subject
10Questions
Bed net use: questions and answers
Which country has the highest bed net use?
Niger, at 88.6%, among the 40 countries compared in 2025.
Which country has the lowest bed net use?
Ethiopia, at 8.6%, among the 40 countries compared in 2025.
How many countries does the Insecticide-Treated Net Use cover?
40 in 2025.
What is the world average bed net use?
This site does not calculate a world average, which would depend on how countries are weighted. In the middle country of the 40 compared in 2025, the figure was 45.0%.
Is this Malaria Atlas Project (MAP)’s own ranking?
No ranking is shown. Malaria Atlas Project (MAP) publishes values only, and too many countries share the same value for an ordering to mean anything, so none is derived.
How often is the Insecticide-Treated Net Use published?
This site holds 26 reference years, 2000–2025, all recalculated in Malaria Atlas Project (MAP)’s 2026 report on one method — not 26 separate publications.
Where does the data come from, and can I download it?
From Malaria Atlas Project (MAP), under CC BY 3.0. From the Malaria Atlas Project's own Trends API (national estimates, with their uncertainty bounds). MAP serves the share as a proportion; the decimal point has been moved to a percentage without changing a digit. Every edition is on this site’s Datasets pages as a full table, and downloads as a CSV file with every value unrounded.
11Method
Sources, method and citation
Source
Insecticide-Treated Net Use — Malaria Atlas Project (MAP)
From the Malaria Atlas Project's own Trends API (national estimates, with their uncertainty bounds). MAP serves the share as a proportion; the decimal point has been moved to a percentage without changing a digit.
Newest edition
Report year 2025Data year 2025
Cite the source as: Malaria Atlas Project. Insecticide-treated net (ITN) use, national (admin0) estimates, release 202608. https://data.malariaatlas.org/. Accessed 3 October 2026.
Licence: CC BY 3.0, checked 2026-10-03.
How this page reads the numbers
- No rank or position is shown: Malaria Atlas Project (MAP) publishes values only, and too many countries share the same value for an ordering to mean anything.
- Which end is better follows the publisher’s own reading of the measure.
- A country is named at an end only when it holds that value alone. Where several share it, the page says how many and names none first.
- Values are stored exactly as published and trimmed only for display. “The middle country” is the median of the countries measured, not a world average.
The file itself, column by column — where it came from, what each column holds, and every edition as a CSV — is on its dataset page.
Photographs
The countries at the top of this statistic, from their profiles: Wikimedia Commons, shown in greyscale, each used under the licence named.
Cite this page
Nations Inquiry (2026). Bed net use by country: Insecticide-Treated Net Use, data from Malaria Atlas Project (MAP). https://nationsinquiry.com/statistics/bed-net-use