MAP · Malaria Incidence (P. vivax)
Malaria incidence (vivax) by country
How often do people fall ill with vivax malaria?
Of the 38 countries compared in 2025, Vietnam had the lowest reading, 0.00070, and Solomon Islands had the highest reading, 184.61969. In the middle country the figure was 1.38184. Among the 33 countries measured in every edition since 2000, the middle one moved from 5.51752 to 1.43201.
Share
Malaria incidence (vivax) · 2025
Context statistic

Lowest of 38Vietnam
0.00070012025 · values only
Who leads
The three countries at the lowest end of 38 compared, the three at the other end, and the first on each continent.
 1
1Photo: Slaza : Sándor Laza · CC BY-SA 3.0, greyscale
 2
2Photo: Laxman Thapa from Nepal derivative work: Inkey · CC BY-SA 2.0, greyscale
 3
3Photo: Alfred Weidinger from Vienna, Austria derivative work: Jjtkk · CC BY 2.0, greyscale
Highest in 2025
 Solomon Islands184.61969
 Papua New Guinea93.21294
 Ethiopia42.33416
Where a country sits says how it compares with the others measured, and nothing about why.
Lowest on each continent
- Africa
 Somalia0.53193
 - Americas
 Costa Rica0.00263
 - AsiaVietnam0.00070
- Oceania
 Vanuatu13.14364
3 of 21 measured
- Every region
02Every measured country
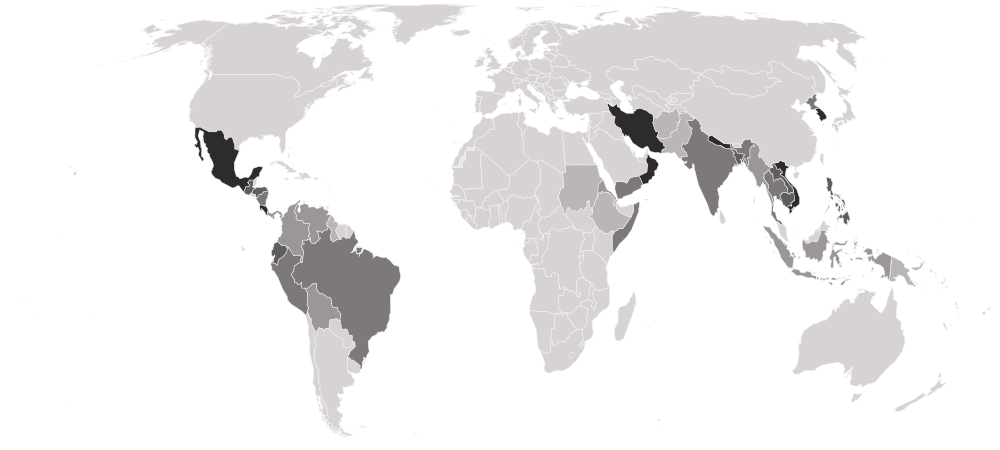
Malaria incidence (vivax) on a map
Each country is shaded by its value, in five groups holding the same number of countries. Hover a country for its value, or select it to open its profile. Below the map, each continent’s middle country.
Darker is a lower value — the better end.
- 18.50147–184.61969
- 1.63714–13.14364
- 0.33195–1.56438
- 0.04293–0.33037
- 0.00070–0.01391
- No reading in 2025 (24 measured in an earlier edition)
- Asia
0.33037
the middle country, of 17 measured · 52 members
Vietnam0.00070 Pakistan39.88030
Lowest and highest reading in Asia.
- Americas
1.43201
the middle country, of 13 measured · 48 members
Costa Rica0.00263 Guyana39.59434
Lowest and highest reading in Americas.
- Africa
18.50147
the middle country, of 5 measured · 55 members
Somalia0.53193Ethiopia42.33416Lowest and highest reading in Africa.
- Oceania
3 of 21 measured — too few for a middle: Papua New Guinea, Solomon Islands, Vanuatu.
Vanuatu13.14364Solomon Islands184.61969Lowest and highest reading in Oceania.
- Every region
9 sub-regions, lowest middle country first
- South-eastern Asia
0.13096
the middle country, of 7 measured · 11 members
Vietnam0.00070 Myanmar12.04954
Lowest and highest reading in South-eastern Asia.
- Central America
0.22608
the middle country, of 6 measured · 8 members
Costa Rica0.00263 Panama3.23918
Lowest and highest reading in Central America.
- Southern Asia
0.34679
the middle country, of 6 measured · 9 members
 Nepal0.00148Pakistan39.88030
Lowest and highest reading in Southern Asia.
- South America
2.22200
the middle country, of 7 measured · 12 members
 Ecuador0.04449Guyana39.59434
Lowest and highest reading in South America.
- Eastern Africa
4 of 19 measured — too few for a middle: Djibouti, Eritrea, Ethiopia, Somalia.
Somalia0.53193Ethiopia42.33416Lowest and highest reading in Eastern Africa.
- Eastern Asia
2 of 8 measured — too few for a middle: North Korea, South Korea.
 South Korea0.01391
 North Korea0.88550
Lowest and highest reading in Eastern Asia.
- Melanesia
3 of 5 measured — too few for a middle: Papua New Guinea, Solomon Islands, Vanuatu.
Vanuatu13.14364Solomon Islands184.61969Lowest and highest reading in Melanesia.
- Northern Africa
1 of 6 measured — too few for a middle: Sudan.
 Sudan18.50147
Lowest and highest reading in Northern Africa.
- Western Asia
2 of 19 measured — too few for a middle: Oman, Yemen.
 Oman0.00153
 Yemen1.38525
Lowest and highest reading in Western Asia.
03The whole field at once
The spread
38 countries, one dot each, on one scale — further right is a higher value. Half the countries are above 1.38184; a quarter are above 10.63387, and a quarter below 0.08265. The bar in each row marks that continent’s middle country.
Log scale: each gridline is ten times the one before, so countries of very different sizes can be seen on one line.
04All 62 ever measured
Every country
In order, lowest value first. No rank or position is shown: too many countries share the same value for an order to mean anything. Only countries where MAP estimates vivax transmission appear, and the list shrinks as countries eliminate it. A country missing from the table is not a country with a zero: MAP's data cannot tell 'no transmission' from 'no estimate'. At the bottom of the table the rates are tiny model estimates, so no positions are given. Falciparum malaria is counted separately.
Showing 25 of 62 countries








































Values for 2025. The change column compares 2025 with 2024 only; the sparkline covers the recent editions.
052000–2025 · 26 reference years
Over time
Each point is one year from 2000, all re-estimated together in MAP's newest release, and the shaded band is the uncertainty MAP publishes around each estimate. A falling line means fewer cases per person; a country disappearing from later years usually means vivax was no longer estimated there, often after elimination.
- the middle country
- the middle half of countries
- the middle of the 33 countries measured every time
- each continent’s middle country
The same, year by year
| Year | Countries | Middle country | Middle half | Measured every time |
|---|---|---|---|---|
| 2025 | 38 | 1.38184 | 0.08265 – 10.63387 | 1.43201 |
| 2024 | 38 | 1.11716 | 0.05791 – 10.13893 | 1.25651 |
| 2023 | 39 | 0.90258 | 0.07212 – 9.60671 | 1.29079 |
| 2022 | 38 | 1.15527 | 0.14988 – 9.52992 | 1.16917 |
| 2021 | 40 | 0.98885 | 0.07778 – 8.48644 | 1.18916 |
| 2020 | 41 | 0.92614 | 0.09072 – 3.01107 | 1.22675 |
| 2019 | 40 | 1.35927 | 0.08952 – 5.11104 | 1.54699 |
| 2018 | 43 | 0.66257 | 0.06500 – 4.15971 | 1.59030 |
| 2017 | 46 | 0.82090 | 0.03795 – 6.36943 | 1.56789 |
| 2016 | 46 | 0.64348 | 0.03624 – 3.52258 | 1.54974 |
| 2015 | 44 | 0.77051 | 0.11468 – 3.54091 | 1.29188 |
| 2014 | 47 | 0.83391 | 0.08592 – 4.16266 | 1.42555 |
| 2013 | 47 | 0.90233 | 0.05050 – 3.21892 | 1.95248 |
| 2012 | 47 | 1.12663 | 0.08044 – 3.67287 | 2.10392 |
| 2011 | 49 | 1.04168 | 0.13362 – 3.46394 | 2.24480 |
| 2010 | 50 | 1.32420 | 0.10741 – 3.80316 | 2.42685 |
| 2009 | 54 | 0.98650 | 0.08027 – 4.73631 | 2.26758 |
| 2008 | 57 | 1.17996 | 0.08168 – 3.66225 | 2.02284 |
| 2007 | 57 | 1.12840 | 0.10912 – 4.67827 | 2.86424 |
| 2006 | 55 | 1.40947 | 0.14316 – 7.11160 | 3.13372 |
| 2005 | 56 | 1.95480 | 0.14677 – 8.25611 | 3.27177 |
| 2004 | 57 | 2.30094 | 0.16134 – 5.68076 | 4.10969 |
| 2003 | 58 | 2.09730 | 0.23600 – 6.95490 | 4.80120 |
| 2002 | 58 | 2.23848 | 0.26683 – 8.14372 | 4.42953 |
| 2001 | 59 | 1.66191 | 0.25708 – 9.85827 | 4.13176 |
| 2000 | 61 | 2.90884 | 0.30360 – 10.07997 | 5.51752 |
062024 → 2025
Who rose and fell
The biggest changes in value between the two newest editions — reference years recalculated in one report, not two separate publications. Places are shown second, because they also move when other countries do.
Improved most
before → after- Ethiopia50.61636 → 42.33416−8.28219
- Papua New Guinea96.91605 → 93.21294−3.70311
- Guyana40.98245 → 39.59434−1.38811
 Eritrea7.76122 → 6.38688−1.37435
 Venezuela5.07413 → 3.84279−1.23134
Worsened most
before → after- Solomon Islands162.78774 → 184.61969+21.83195
 Afghanistan25.21978 → 32.36552+7.14573
 Djibouti15.98871 → 22.27022+6.28151
- Pakistan34.66355 → 39.88030+5.21675
- Vanuatu10.93150 → 13.14364+2.21215
38 countries were measured in both 2024 and 2025.
07Across every edition
Malaria incidence (vivax) in records
The extremes of the statistic. A record reached by more than one country names none of them.
Highest reading on record
184.61969
New P. vivax malaria cases per 1,000 people per year
Lowest reading on record
0.00000
New P. vivax malaria cases per 1,000 people per year
Biggest improvement between editions
−49.15440
105.90988 → 56.75549
Biggest decline between editions
+60.96532
43.96450 → 104.92981
Most improved since first measured
−53.97147
67.11511 → 13.14364
At the top most often
2 countries share this record — no holder is named
3 of 26
editions
08The measure
About malaria incidence (vivax)
Vivax malaria incidence is the number of new clinical cases of malaria caused by Plasmodium vivax per 1,000 people each year. Vivax is the parasite behind most malaria outside Africa — in South and South-East Asia, the Pacific, Latin America and the Horn of Africa — and it can lie dormant in the liver and relapse months later. The figures are modelled by the Malaria Atlas Project.
What the number is: New P. vivax malaria cases per 1,000 people per year.
09Where it fits
Connections
Its part in the Country Index, the statistics whose values line up most closely with it across countries, and others on the same subject.
In the Country Index
Context, with no vote
This statistic is published in full under Health & Wellbeing and Development & Human Capital, but does not help decide any Country Index standing.
Health & WellbeingDevelopment & Human CapitalWhich statistics vote, and why
Moves with
Where malaria incidence (vivax) is higher, these tend to be higher too.
No statistic lines up this closely.
Moves against
Where malaria incidence (vivax) is higher, these tend to be lower.
No statistic lines up this closely.
Rank correlation (ρ, from −1 to 1) across countries, on each statistic’s newest edition, out of 0 statistics sharing at least 80 countries with this one. Two statistics that move together do not cause each other.
10Keep reading
Explore further
The countries at either end
11Questions
Malaria incidence (vivax): questions and answers
Which country has the lowest malaria incidence (vivax)?
Vietnam, at 0.00070, among the 38 countries compared in 2025.
Which country has the highest malaria incidence (vivax)?
Solomon Islands, at 184.61969, among the 38 countries compared in 2025.
How many countries does the Malaria Incidence (P. vivax) cover?
38 in 2025, and 62 at least once across all editions. The number measured varies from 38 to 61 between editions.
What is the world average malaria incidence (vivax)?
This site does not calculate a world average, which would depend on how countries are weighted. In the middle country of the 38 compared in 2025, the figure was 1.38184.
Is this Malaria Atlas Project (MAP)’s own ranking?
No ranking is shown. Malaria Atlas Project (MAP) publishes values only, and too many countries share the same value for an ordering to mean anything, so none is derived.
How often is the Malaria Incidence (P. vivax) published?
This site holds 26 reference years, 2000–2025, all recalculated in Malaria Atlas Project (MAP)’s 2026 report on one method — not 26 separate publications.
Where does the data come from, and can I download it?
From Malaria Atlas Project (MAP), under CC BY 3.0. From the Malaria Atlas Project's own Trends API (national estimates, with their uncertainty bounds). MAP serves the rate per person; the decimal point has been moved to its documented unit, cases per 1,000 people, without changing a digit. Every edition is on this site’s Datasets pages as a full table, and downloads as a CSV file with every value unrounded.
12Method
Sources, method and citation
Source
Malaria Incidence (P. vivax) — Malaria Atlas Project (MAP)
From the Malaria Atlas Project's own Trends API (national estimates, with their uncertainty bounds). MAP serves the rate per person; the decimal point has been moved to its documented unit, cases per 1,000 people, without changing a digit.
Newest edition
Report year 2025Data year 2025
Cite the source as: Malaria Atlas Project. Plasmodium vivax clinical incidence rate, national (admin0) estimates, release 202608. https://data.malariaatlas.org/. Accessed 3 October 2026.
Licence: CC BY 3.0, checked 2026-10-03.
How this page reads the numbers
- No rank or position is shown: Malaria Atlas Project (MAP) publishes values only, and too many countries share the same value for an ordering to mean anything.
- Which end is better follows the publisher’s own reading of the measure.
- A country is named at an end only when it holds that value alone. Where several share it, the page says how many and names none first.
- Values are stored exactly as published and trimmed only for display. “The middle country” is the median of the countries measured, not a world average.
The file itself, column by column — where it came from, what each column holds, and every edition as a CSV — is on its dataset page.
Photographs
The countries at the top of this statistic, from their profiles: Wikimedia Commons, shown in greyscale, each used under the licence named.
Cite this page
Nations Inquiry (2026). Malaria incidence (vivax) by country: Malaria Incidence (P. vivax), data from Malaria Atlas Project (MAP). https://nationsinquiry.com/statistics/vivax-malaria-incidence