Dataset · MAP
Malaria Incidence (P. vivax)
26 years, 2000–2025 · 38 countries · 3 measures
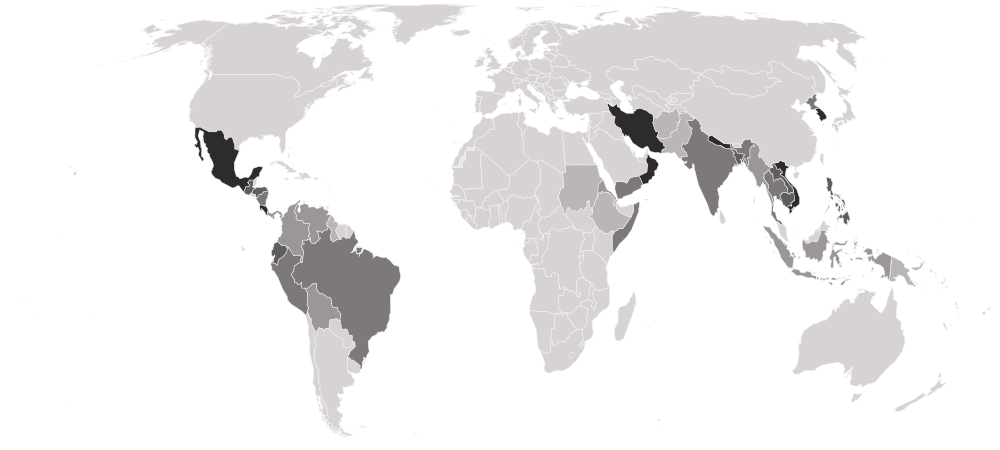
Vivax malaria incidence is the number of new clinical cases of malaria caused by Plasmodium vivax per 1,000 people each year. Vivax is the parasite behind most malaria outside Africa — in South and South-East Asia, the Pacific, Latin America and the Horn of Africa — and it can lie dormant in the liver and relapse months later. The figures are modelled by the Malaria Atlas Project.
This site holds every year from 2000 to 2025, read from MAP’s own data and stored exactly as published.
Malaria Incidence (P. vivax) · the file
- Newest
- Malaria Incidence (P. vivax), 2025
- Held
- 26 years · 1,265 rows
- Licence
- CC BY 3.0
0126 years
Every year
Every year comes from MAP’s 2026 release, recalculated on one method. Each opens the full table for that year; each downloads as a CSV.
| Year | Countries | Change | Read | Download |
|---|---|---|---|---|
| Malaria Incidence (P. vivax), 2025Newest | 38 | ±0 | October 3, 2026 | CSV |
| Malaria Incidence (P. vivax), 2024 | 38 | −1 | October 3, 2026 | CSV |
| Malaria Incidence (P. vivax), 2023 | 39 | +1 | October 3, 2026 | CSV |
| Malaria Incidence (P. vivax), 2022 | 38 | −2 | October 3, 2026 | CSV |
| Malaria Incidence (P. vivax), 2021 | 40 | −1 | October 3, 2026 | CSV |
| Malaria Incidence (P. vivax), 2020 | 41 | +1 | October 3, 2026 | CSV |
| Malaria Incidence (P. vivax), 2019 | 40 | −3 | October 3, 2026 | CSV |
| Malaria Incidence (P. vivax), 2018 | 43 | −3 | October 3, 2026 | CSV |
| Malaria Incidence (P. vivax), 2017 | 46 | +1 −1 | October 3, 2026 | CSV |
| Malaria Incidence (P. vivax), 2016 | 46 | +2 | October 3, 2026 | CSV |
| Malaria Incidence (P. vivax), 2015 | 44 | −3 | October 3, 2026 | CSV |
| Malaria Incidence (P. vivax), 2014 | 47 | ±0 | October 3, 2026 | CSV |
Show all 26 years
| Year | Countries | Change | Read | Download |
|---|---|---|---|---|
| Malaria Incidence (P. vivax), 2013 | 47 | +2 −2 | October 3, 2026 | CSV |
| Malaria Incidence (P. vivax), 2012 | 47 | −2 | October 3, 2026 | CSV |
| Malaria Incidence (P. vivax), 2011 | 49 | +2 −3 | October 3, 2026 | CSV |
| Malaria Incidence (P. vivax), 2010 | 50 | +2 −6 | October 3, 2026 | CSV |
| Malaria Incidence (P. vivax), 2009 | 54 | +1 −4 | October 3, 2026 | CSV |
| Malaria Incidence (P. vivax), 2008 | 57 | ±0 | October 3, 2026 | CSV |
| Malaria Incidence (P. vivax), 2007 | 57 | +3 −1 | October 3, 2026 | CSV |
| Malaria Incidence (P. vivax), 2006 | 55 | −1 | October 3, 2026 | CSV |
| Malaria Incidence (P. vivax), 2005 | 56 | −1 | October 3, 2026 | CSV |
| Malaria Incidence (P. vivax), 2004 | 57 | +1 −2 | October 3, 2026 | CSV |
| Malaria Incidence (P. vivax), 2003 | 58 | ±0 | October 3, 2026 | CSV |
| Malaria Incidence (P. vivax), 2002 | 58 | −1 | October 3, 2026 | CSV |
| Malaria Incidence (P. vivax), 2001 | 59 | −2 | October 3, 2026 | CSV |
| Malaria Incidence (P. vivax), 2000 | 61 | — | October 3, 2026 | CSV |
Every year in one file, one row per country per year: vivax-malaria-incidence-all-editions-nations-inquiry.csv
025 columns
What’s in the file
Every column, what it holds, how it is stored and what its values look like — what a reader needs before opening the file.
| Column | What it holds | Stored as | Range, 2025 | Distinct | Empty | Spread |
|---|---|---|---|---|---|---|
CountrycountryName | The country’s name, as this file spells it. | Text | — | 38 | 0 | |
ISO Codecountry_codeIdentifier | The ISO 3166-1 alpha-3 code, added by this site. Every table here joins on it. | Text · 3 letters | — | 38 | 0 | |
New P. vivax malaria cases per 1,000 people per yearvivax_incidenceHeadline | The headline figure: New P. vivax malaria cases per 1,000 people per year. | Number · up to 18 decimals | 0.00070 Vietnam184.61969 Vietnam184.61969 Solomon Islandsmiddle 1.38184 Solomon Islandsmiddle 1.38184 | 38 | 0 | |
Lower bound (uncertainty interval)lowerwhiskerMeasure | Lower end of the uncertainty interval the Malaria Atlas Project publishes around the estimate, in cases per 1,000 people per year. | Number · up to 20 decimals | 0.00000010 share it100.743246Solomon Islandsmiddle 0.001826 | 29 | 0 | |
Upper bound (uncertainty interval)upperwhiskerMeasure | Upper end of the uncertainty interval the Malaria Atlas Project publishes around the estimate, in cases per 1,000 people per year. | Number · up to 17 decimals | 0.002Vietnam290.168Solomon Islandsmiddle 2.355 | 38 | 0 |
Profiled from the newest file. Range: the lowest and highest value, with the country holding it when only one does. Spread: countries in ten equal steps from lowest to highest. A higher value is the worse result.
0362 countries across every year
Who is covered
How many countries each year holds, continent by continent, who joined and who left, and which places this site covers that the dataset never has.
| 2014 | 2015 | 2016 | 2017 | 2018 | 2019 | 2020 | 2021 | 2022 | 2023 | 2024 | 2025 | |
|---|---|---|---|---|---|---|---|---|---|---|---|---|
| Africa | 6 | 5 | 5 | 6 | 5 | 5 | 5 | 5 | 5 | 5 | 5 | 5 |
| Americas | 16 | 15 | 16 | 16 | 15 | 14 | 14 | 14 | 13 | 13 | 13 | 13 |
| Asia | 22 | 21 | 22 | 21 | 20 | 18 | 19 | 18 | 17 | 18 | 17 | 17 |
| Europe | 0 | 0 | 0 | 0 | 0 | 0 | 0 | 0 | 0 | 0 | 0 | 0 |
| Oceania | 3 | 3 | 3 | 3 | 3 | 3 | 3 | 3 | 3 | 3 | 3 | 3 |
| All | 47 | 44 | 46 | 46 | 43 | 40 | 41 | 40 | 38 | 39 | 38 | 38 |
The newest 12 of 26 years.
Who joined and who left
 − Timor-Leste
 − Bhutan
 − Suriname
 − Belize
 − Saudi Arabia
 − Madagascar
 − Malaysia
 − El Salvador
 − China
Not in this dataset · 163 places this site covers
MAP gives no figure for these in any year held here. It is the publisher’s choice of scope, and each place’s profile shows what is measured.
 Albania
 Algeria
 American Samoa
 Andorra
 Angola
 Anguilla
 Antigua and Barbuda
 Aruba
Aruba Australia
 Austria
 Bahamas
 Bahrain
 Barbados
 Belarus
 Belgium
 Benin
Benin Bermuda
 Bosnia and Herzegovina
 Botswana
 British Virgin Islands
 Brunei
 Bulgaria
 Burkina Faso
 Burundi
 Cabo Verde
 Cameroon
 Canada
 Cayman Islands
 Central African Republic
 ChadChannel Islands
 Chile
Chile Comoros
 Cook Islands
 Côte d’Ivoire
 Croatia
 Cuba
Cuba Curaçao
 Cyprus
 Czechia
 Denmark
 Dominica
 DR Congo
 Egypt
Egypt Equatorial Guinea
 Estonia
 Eswatini
 Faroe Islands
 Fiji
Fiji Finland
 France
 French Polynesia
 Gabon
Gabon Gambia
 Germany
 Ghana
Ghana Gibraltar
 Greece
 Greenland
 Grenada
 Guam
Guam Guinea
 Guinea-Bissau
 Hong Kong
 Hungary
 Iceland
 Ireland
 Isle of Man
 Israel
 Italy
Italy Jamaica
 Japan
Japan Jordan
 Kazakhstan
 Kenya
Kenya Kiribati
 Kosovo
 Kuwait
 Latvia
 Lebanon
 Lesotho
 Liberia
 Libya
Libya Liechtenstein
 Lithuania
 Luxembourg
 Macau
Macau Malawi
 Maldives
 Mali
Mali Malta
Malta Marshall Islands
 Mauritania
 Mauritius
 Micronesia
 Moldova
 Monaco
 Mongolia
 Montenegro
 Montserrat
 Morocco
 Mozambique
 Namibia
 Nauru
Nauru Netherlands
 New Caledonia
 New Zealand
 Niger
Niger Nigeria
 Niue
Niue North MacedoniaNorthern Cyprus
 Northern Mariana Islands
 Norway
 Palau
Palau Palestine
 Poland
 Portugal
 Puerto Rico
 Qatar
Qatar Republic of the Congo
 Romania
 Russia
 Rwanda
 Saint Kitts and Nevis
 Saint Lucia
 Saint Martin
 Saint Vincent and the Grenadines
 Samoa
Samoa San Marino
 São Tomé and Príncipe
 Senegal
 Serbia
 Seychelles
 Sierra Leone
 Singapore
 Sint Maarten
 Slovakia
 SloveniaSomaliland
 South Africa
 South Sudan
 Spain
Spain Sweden
 Switzerland
 Taiwan
 Tanzania
 Togo
Togo Tonga
Tonga Trinidad and Tobago
 Tunisia
 Turks and Caicos Islands
 Tuvalu
 Uganda
 Ukraine
 United Arab Emirates
 United Kingdom
 United States
 United States Virgin Islands
 Uruguay
 Vatican City
 Zambia
 Zimbabwe
04Provenance
Where it comes from
The path from the publisher to this page, and what was checked and changed on the way.
1 · Publisher
Malaria Atlas Project (MAP)
2 · Their file
Malaria Atlas Project, release 202608 — vivax malaria incidence, 2025
3 · Read by this site
October 3, 2026
Imported by a script that parses each figure and writes it down unrounded.4 · Stored as
26 files, one per year
Each downloads as a CSV, or every year together as vivax-malaria-incidence-all-editions-nations-inquiry.csv5 · Used on
Its statistic page, and every profile it measures
Precision
The headline is stored to 18 decimals, as published.
Rounded by this site
Never. Tables on screen may show fewer decimals; the files never do.
Changed by this site
Reshaped into one row per country: regional and income-group totals are left out, only the columns listed are kept, each row gets its ISO 3166 code, and some country names are brought to one spelling. No value is recalculated, rescaled or rounded.
From the Malaria Atlas Project's own Trends API (national estimates, with their uncertainty bounds). MAP serves the rate per person; the decimal point has been moved to its documented unit, cases per 1,000 people, without changing a digit.
05Reuse
Licence and credit
What the publisher’s licence lets you do, what it asks of you, and a credit line and citation ready to copy.
Licence · checked October 3, 2026
- Share and redistribute it
- Adapt it and build on it
- Use it commercially
- Credit the publisher
- Say what you changed
Share, adapt and use commercially. Credit the publisher and say if you changed anything.
A credit line
Source: Malaria Atlas Project (MAP), Malaria Incidence (P. vivax), via Nations Inquiry.
Cite this dataset
Malaria Atlas Project (MAP). Malaria Incidence (P. vivax), 2000–2025 [data set]. As held by Nations Inquiry, https://nationsinquiry.com/datasets/vivax-malaria-incidence
The publisher’s own citation: Malaria Atlas Project. Plasmodium vivax clinical incidence rate, national (admin0) estimates, release 202608. https://data.malariaatlas.org/. Accessed 3 October 2026.
Plain-language summary, not legal advice. The licence text is what binds.
06Where it is used
Around the site
Where these numbers appear on this site, and the datasets nearest to it.
Charted
Malaria Incidence (P. vivax) by countryWho is highest, the map, the spread, who rose and fell, and the records.
Subjects
Near neighbours
- Life Expectancy at BirthUN DESA Population Division · 74 held · 1950–2023
- Under-Five Mortality RateUN IGME · 73 held · 1952–2024
- Prevalence of Severe Food InsecurityFAO · 9 held · 2015–2023
07Questions
Malaria Incidence (P. vivax): questions and answers
What is the Malaria Incidence (P. vivax)?
Vivax malaria incidence is the number of new clinical cases of malaria caused by Plasmodium vivax per 1,000 people each year. Vivax is the parasite behind most malaria outside Africa — in South and South-East Asia, the Pacific, Latin America and the Horn of Africa — and it can lie dormant in the liver and relapse months later. The figures are modelled by the Malaria Atlas Project.
Which years of the Malaria Incidence (P. vivax) can I download?
All 26, from 2000 to 2025, each as a CSV file, or every year together in one CSV.
Does MAP rank countries on it?
No, and this site does not order it either. The files hold values only.
Can I use it commercially?
Yes, under CC BY 3.0, with credit to MAP. The licence text is linked on this page.