Data for 2006
Malaria Incidence (P. vivax), 2006
2006, as MAP’s 2026 release gives it · stored as published, never rewritten
Vivax malaria incidence is the number of new clinical cases of malaria caused by Plasmodium vivax per 1,000 people each year. Vivax is the parasite behind most malaria outside Africa — in South and South-East Asia, the Pacific, Latin America and the Horn of Africa — and it can lie dormant in the liver and relapse months later. The figures are modelled by the Malaria Atlas Project.
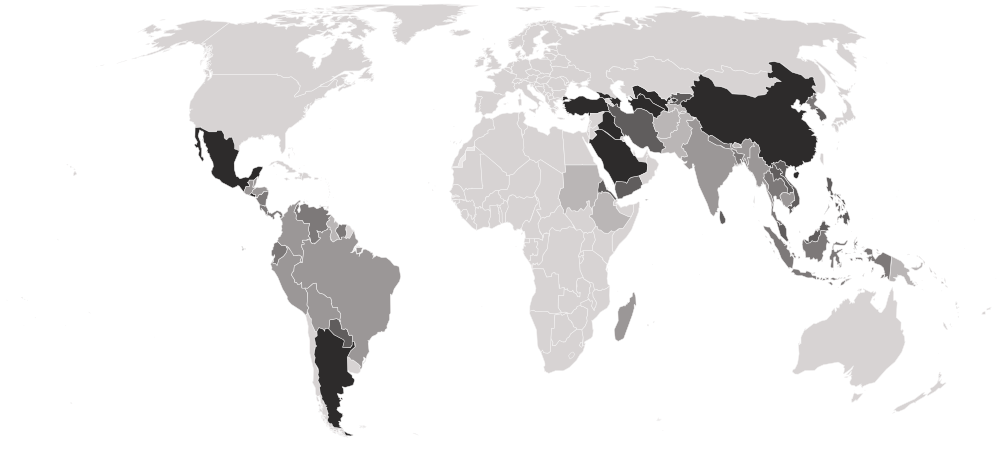
Malaria Incidence (P. vivax), 2006 covers 55 countries on 3 measures. Papua New Guinea is highest, at 138.261; Turkmenistan is lowest, at 0.000. The middle country reads 1.409. Against 2005, 55 values changed (16 up, 39 down), 1 left.
Malaria Incidence (P. vivax) · Data for 2006
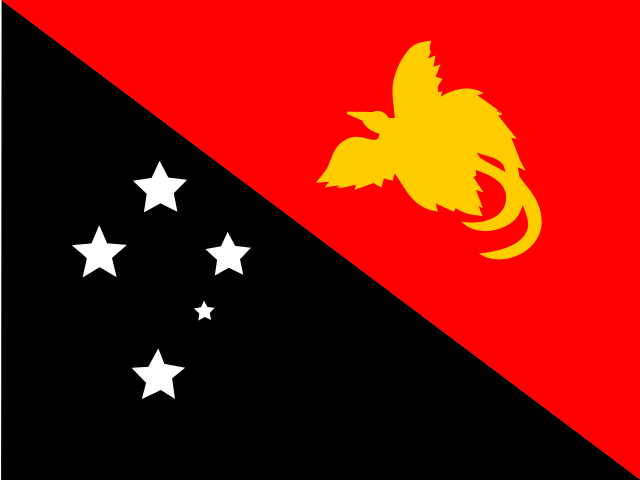
HighestPapua New Guinea
138.261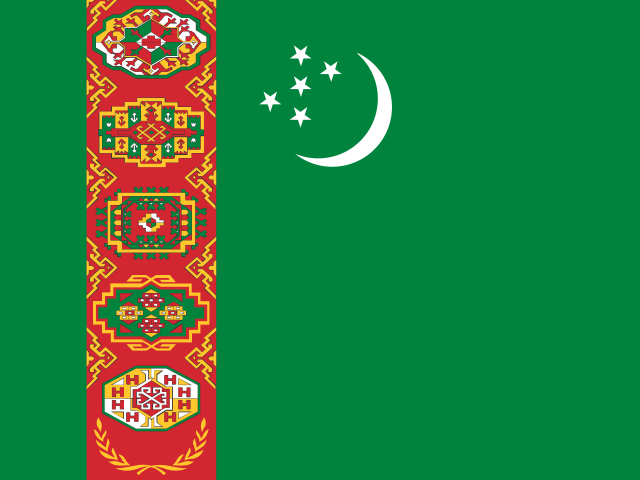
LowestTurkmenistan
0.000Shaded by value in five groups of equal size, darkest at the lowest end.
01Values only
The table
Every country and every column of Malaria Incidence (P. vivax), 2006, as published. The file carries values only, so no position is shown. “=” marks a shared position.
Showing 25 of 55 countries · select a heading to sort
Papua New GuineaPNGMelanesia | 138.261 | 114.343362 | 166.119 |
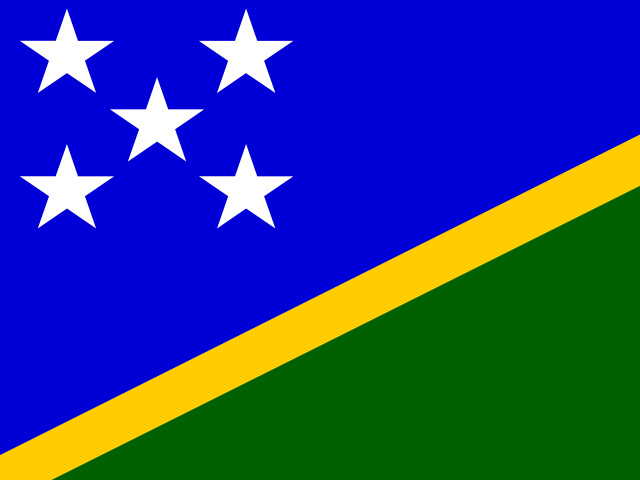 Solomon Islands SLBMelanesia | 112.131 | 29.118601 | 306.364 |
 Vanuatu VUTMelanesia | 86.938 | 75.006635 | 100.210 |
 Ethiopia ETHEastern Africa | 57.745 | 37.178275 | 85.566 |
 Timor-Leste TLSSouth-eastern Asia | 37.296 | 32.474097 | 42.467 |
 Guyana GUYSouth America | 33.745 | 27.905373 | 40.586 |
 Afghanistan AFGSouthern Asia | 25.766 | 19.782987 | 33.289 |
 Tajikistan TJKCentral Asia | 24.123 | 24.122890 | 24.123 |
 Bhutan BTNSouthern Asia | 11.367 | 8.430340 | 14.890 |
 Pakistan PAKSouthern Asia | 10.705 | 8.308117 | 13.496 |
 Sudan SDNNorthern Africa | 8.835 | 6.287881 | 12.482 |
 India INDSouthern Asia | 8.640 | 6.515123 | 11.241 |
 Madagascar MDGEastern Africa | 8.220 | 5.407758 | 11.954 |
 Cambodia KHMSouth-eastern Asia | 7.416 | 5.686392 | 9.544 |
 Belize BLZCentral America | 6.807 | 5.254182 | 8.640 |
 Myanmar MMRSouth-eastern Asia | 6.289 | 4.789055 | 7.996 |
 Guatemala GTMCentral America | 5.950 | 4.770677 | 7.307 |
 Bolivia BOLSouth America | 4.549 | 3.494508 | 5.633 |
 Brazil BRASouth America | 4.186 | 3.258900 | 5.295 |
 Colombia COLSouth America | 3.893 | 3.271446 | 4.659 |
 Peru PERSouth America | 3.877 | 3.207080 | 4.691 |
 Honduras HNDCentral America | 3.180 | 2.686076 | 3.732 |
 Indonesia IDNSouth-eastern Asia | 3.134 | 2.406529 | 3.984 |
 Suriname SURSouth America | 2.858 | 2.303388 | 3.452 |
 Venezuela VENSouth America | 2.540 | 2.150777 | 2.925 |
 Nepal NPLSouthern Asia | 1.874 | 1.455464 | 2.353 |
 North Korea PRKEastern Asia | 1.821 | 1.349783 | 2.373 |
 Ecuador ECUSouth America | 1.409 | 1.140009 | 1.731 |
 Costa Rica CRICentral America | 1.306 | 1.109413 | 1.528 |
 Nicaragua NICCentral America | 1.071 | 0.901891 | 1.291 |
 Panama PANCentral America | 1.003 | 0.825396 | 1.204 |
 Thailand THASouth-eastern Asia | 0.667 | 0.557692 | 0.801 |
 Bangladesh BGDSouthern Asia | 0.642 | 0.501216 | 0.798 |
 Iran IRNSouthern Asia | 0.459 | 0.321627 | 0.629 |
 Yemen YEMWestern Asia | 0.431 | 0.320898 | 0.558 |
 Eritrea ERIEastern Africa | 0.371 | 0.315339 | 0.433 |
 Philippines PHLSouth-eastern Asia | 0.361 | 0.000216 | 2.324 |
 Malaysia MYSSouth-eastern Asia | 0.357 | 0.302070 | 0.422 |
 Paraguay PRYSouth America | 0.306 | 0.257699 | 0.359 |
 Vietnam VNMSouth-eastern Asia | 0.163 | 0.132262 | 0.201 |
 South Korea KOREastern Asia | 0.160 | 0.119718 | 0.204 |
 Laos LAOSouth-eastern Asia | 0.127 | 0.096742 | 0.164 |
 Sri Lanka LKASouthern Asia | 0.081 | 0.065347 | 0.099 |
 Kyrgyzstan KGZCentral Asia | 0.059 | 0.059197 | 0.059 |
 Mexico MEXCentral America | 0.053 | 0.042521 | 0.065 |
 China CHNEastern Asia | 0.050 | 0.041358 | 0.062 |
 Azerbaijan AZEWestern Asia | 0.043 | 0.031324 | 0.056 |
 Georgia GEOWestern Asia | 0.035 | 0.026717 | 0.046 |
 El Salvador SLVCentral America | 0.026 | 0.020933 | 0.032 |
 Uzbekistan UZBCentral Asia | 0.011 | 0.007216 | 0.015 |
 Türkiye TURWestern Asia | 0.010 | 0.010347 | 0.010 |
 Argentina ARGSouth America | 0.005 | 0.005352 | 0.005 |
 Saudi Arabia SAUWestern Asia | 0.003 | 0.001905 | 0.003 |
 Iraq IRQWestern Asia | 0.001 | 0.000757 | 0.001 |
TurkmenistanTKMCentral Asia | 0.000 | 0.000219 | 0.000 |
02In 2006
At either end
The 5 countries at each end of the headline, then the highest and lowest on each other measure.
Highest
- Papua New Guinea138.261
- Solomon Islands112.131
- Vanuatu86.938
- Ethiopia57.745
- Timor-Leste37.296
Lowest
- Turkmenistan0.000
- Iraq0.001
- Saudi Arabia0.003
- Argentina0.005
- Türkiye0.010
A higher value is the worse result. The middle country reads 1.409. “Shared” marks a value another country also holds.
Each measure’s ends
Lower bound (uncertainty interval)
Highest
Papua New Guinea114.343362Lowest
Philippines0.000216Middle country: 1.140009
Upper bound (uncertainty interval)
Highest
Solomon Islands306.364Lowest
Turkmenistan0.000Middle country: 2.324
032005 → 2006
Since 2005
- +0 / −1countries joined / left
- 55values changed, of 55 in both
- 16 · 39rose · fell
- 0unchanged
Rose most
- Solomon Islands106.198 → 112.131+5.933
- Ethiopia54.396 → 57.745+3.348
- Bhutan9.852 → 11.367+1.515
- Myanmar5.052 → 6.289+1.237
- Timor-Leste36.293 → 37.296+1.004
Fell most
- Guyana64.371 → 33.745−30.626
- Afghanistan36.500 → 25.766−10.734
- Tajikistan29.833 → 24.123−5.710
- Belize11.561 → 6.807−4.754
- Vanuatu91.382 → 86.938−4.444
 − Armenia
04Caveats
Read before you use
One year of the 2026 release
Every year in this series comes from MAP’s 2026 release, recalculated on one method, so a change from one year to the next is not a revision. It can differ from what was first published for 2006.
Nothing missing
Every one of the 55 countries has every column.
05The files
Download and cite
- .csv
For a spreadsheet or code
55 rows · 4.9 KB · UTF-8, opens in Excel
Opens with 11 lines of source notes; the table starts on row 13.
Download vivax-malaria-incidence-2006-nations-inquiry.csv - ↗
The publisher’s original
MAP’s own file, on its own site.
mean
What this site changed: Reshaped to one row per country, with its ISO code; no value recalculated, rescaled or rounded. In full
Licence: CC BY 3.0 · what it allows, in plain words
Cite this edition
Malaria Atlas Project (MAP) (2006). Malaria Incidence (P. vivax), 2006 [data set], describing 2006. As held by Nations Inquiry, https://nationsinquiry.com/datasets/vivax-malaria-incidence/2006
0626 held
Other years
‹ The year before
Malaria Incidence (P. vivax), 200556 countries
The year after ›
Malaria Incidence (P. vivax), 200757 countries
All of them
Malaria Incidence (P. vivax): every year26 held, with the data dictionary, coverage and licence.
How it has moved, charted by country