
Photo: File: Robertgrafl derivative work: Jjtkk · Public domain · via Wikimedia Commons, shown in greyscale
Topic 05 of 18 · Country Index 2026

Chad: Health & Wellbeing
How long, and how well fed, do people live?
Chad is placed 195th of 200 countries on health & wellbeing in the Country Index 2026, from 4 of its 4 key statistics. Readings behind it: Life Expectancy at Birth 55.07 (2023); Under-Five Mortality Rate 97.26 (2024).
Share
Health & Wellbeing
195th
of 200 countries placed
Placed from 4 of 4 key statistics
- 55.07Life Expectancy at Birth, 2023Years a newborn would live at current death rates
- 97.26Under-Five Mortality Rate, 2024Deaths before age five (per 1,000 live births)
- 31.92Stunting Prevalence in Children Under Five, 2024Children under 5 who are stunted (%)
- 25.2Prevalence of Severe Food Insecurity, 2024Population in severe food insecurity (%)
01The evidence
The 4 key statistics that decide it
Only these place Chad on health & wellbeing — one vote each. Every value is the publisher’s own, read at the edition the Country Index 2026 used — or, for a survey-based key, each country’s latest reading; the grey ticks are every other country it was compared with, lowest on the left.
Key 1 of 4
Life Expectancy at Birth
UN DESA Population Division
2023 edition · data for 2023 · CC BY 3.0 IGO
55.07
Years a newborn would live at current death rates
Higher is better
Chad: 55.07. Across the 222 countries in this edition, values run from 54.46 (Nigeria) to 86.37 (Monaco); the world median is 74.63.
- World median
- 74.63
- Best in Middle Africa
- 69.72 São Tomé and Príncipe
- Land neighbours
- Central African Republic 57.41 · Cameroon 63.7 · Libya 69.34 · Niger 61.18 · Nigeria 54.46 · Sudan 66.33
Key 2 of 4
Under-Five Mortality Rate
UN Inter-agency Group for Child Mortality Estimation (UN IGME)
2024 edition · data for 2024 · CC BY 3.0 IGO
97.26
Deaths before age five (per 1,000 live births)
Lower is better
Chad: 97.26. Across the 200 countries in this edition, values run from 1.26 (San Marino) to 115.65 (Nigeria); the world median is 14.54.
- World median
- 14.54
- Best in Middle Africa
- 13.55 São Tomé and Príncipe
- Land neighbours
- Central African Republic 89.73 · Cameroon 64.84 · Libya 9.765 · Niger 110.72 · Nigeria 115.65 · Sudan 61.6
Key 3 of 4
Stunting Prevalence in Children Under Five
UNICEF, WHO and World Bank Group (Joint Malnutrition Estimates)
Latest reading per country, 2014–2024 · Chad’s is from 2022 · CC BY 3.0 IGO
31.92
Children under 5 who are stunted (%)
Lower is better
Chad: 31.92. Across the 162 countries at their latest reading, values run from 0.518 (Latvia) to 52.8 (Burundi); the world median is 13.8.
- World median
- 13.8
- Best in Middle Africa
- 11.74 São Tomé and Príncipe
- Land neighbours
- Central African Republic 37.9 · Cameroon 28.93 · Libya 7.948 · Niger 47.7 · Nigeria 33.8 · Sudan 38.24
Key 4 of 4
Prevalence of Severe Food Insecurity
Food and Agriculture Organization of the United Nations (FAO)
2024 edition · data for 2024 · CC BY 4.0
25.2
Population in severe food insecurity (%)
Lower is better
Chad: 25.2. Across the 125 countries in this edition, values run from 0.6 (Brazil) to 62.9 (South Sudan); the world median is 4.9.
- World median
- 4.9
- Best in Middle Africa
- 16.2 Angola
- Land neighbours
- Cameroon 23.9 · Libya 15.1 · Niger 7.4 · Nigeria 26.4
02Over time
Which way Chad is moving
Each key’s published value, edition by edition, beside the world median. The Country Index 2026 is the first edition of the standing, so the standing itself has no history to chart yet.
Life Expectancy at Birth
Years a newborn would live at current death rates · higher is better
ChadWorld median
Chad rose from 47.94 in 2000 to 55.07 in 2023; the world median went from 70.68 to 74.63.
Every year’s figures
Year Chad World median 2023 55.07 74.630 2022 54.53 74.313 2021 53.14 72.433 2020 53.08 73.063 2019 52.99 74.196 2018 52.45 74.081 2017 51.87 74.029 2016 51.60 74.013 2015 51.32 73.783 2014 51.14 73.330 2013 51.05 73.386 2012 50.77 73.210 2011 50.43 73.003 2010 50.11 72.827 2009 49.83 72.426 2008 49.50 72.264 2007 49.21 72.113 2006 48.75 72.027 2005 48.86 71.876 2004 48.69 71.477 2003 48.61 71.409 2002 48.36 71.173 2001 48.31 70.926 2000 47.94 70.678 Under-Five Mortality Rate
Deaths before age five (per 1,000 live births) · lower is better
ChadWorld median
Chad fell from 182.43 in 2000 to 97.26 in 2024; the world median went from 30.43 to 14.54.
Every year’s figures
Year Chad World median 2024 97 14.5 2023 101 15.2 2022 104 14.7 2021 107 15.1 2020 111 15.3 2019 114 15.7 2018 118 16.3 2017 121 16.8 2016 125 17.5 2015 129 17.9 2014 132 18.3 2013 136 18.7 2012 139 18.8 2011 143 19.0 2010 147 19.2 2009 151 20.8 2008 154 20.7 2007 158 21.8 2006 162 22.8 2005 165 24.0 2004 169 25.9 2003 172 26.9 2002 176 28.0 2001 179 29.1 2000 182 30.4 Prevalence of Severe Food Insecurity
Population in severe food insecurity (%) · lower is better
ChadWorld median
Chad fell from 32.4 in 2015 to 25.2 in 2024; the world median went from 3.4 to 4.9.
Every year’s figures
Year Chad World median 2024 25 4.9 2023 25 4.7 2022 25 5.4 2021 28 5.7 2020 33 5.6 2019 38 5.0 2018 40 4.2 2017 39 4.0 2016 35 3.4 2015 32 3.4
03In context
Chad beside its neighbours
A position reads best beside the countries around it. Every position below is a place among all 200 countries on health & wellbeing, never a place within the region.
Chad and the countries it borders
Standing among all 200; the key columns are the publishers’ own values.
| Country | Standing | Life Expectancy at BirthYears a newborn would live at current death rates | Under-Five Mortality RateDeaths before age five (per 1,000 live births) | Stunting Prevalence in Children Under FiveChildren under 5 who are stunted (%) | Prevalence of Severe Food InsecurityPopulation in severe food insecurity (%) |
|---|---|---|---|---|---|
 Libya | =110th | 69.34 | 9.765 | 7.948 | 15.1 |
 Cameroon | 180th | 63.7 | 64.84 | 28.93 | 23.9 |
 Niger | 184th | 61.18 | 110.72 | 47.7 | 7.4 |
 Sudan | 185th | 66.33 | 61.6 | 38.24 | — |
| Chad | 195th | 55.07 | 97.26 | 31.92 | 25.2 |
 Nigeria | 196th | 54.46 | 115.65 | 33.8 | 26.4 |
 Central African Republic | =197th | 57.41 | 89.73 | 37.9 | — |
“—”: no published reading in that edition. What a standing is
Across Middle Africa
Every country in the sub-region, by its place among all 200.





Placed either side on health & wellbeing
The countries immediately above and below Chad in the topic’s list.


04Context, no vote
Where Chad is ahead of the world, and behind
49 more statistics filed under health & wellbeing, published in full and deliberately given no vote in the standing. Select a row for the publisher, the rank and the links.
Ahead of the world median4
Statistics on which Chad does better than the middle country measured.
Overweight Prevalence in Children Under FiveUNICEF, WHO and World Bank Group (Joint Malnutrition Estimates) · 2024 · world median 5.52.4535.5▲ Improved since 2014
Chad: 2.453 · world median 5.5 · Children under 5 who are overweight (%). UNICEF, WHO and World Bank Group (Joint Malnutrition Estimates), 2024 edition, data for 2024.
Published values in that edition run from 0.623 to 26.43; lower is better.
Position 146th of 163 · derived, 1st = worst.
Agreement That Vaccines Are SafeWellcome Trust · 2018 · world median 77.6581.1477.65No earlier reading
Chad: 81.14 · world median 77.65 · People aged 15+ who agree that vaccines are safe (% of those who had heard of vaccines). Wellcome Trust, 2018 edition, data for 2018.
Published values in that edition run from 29.29 to 97.91; higher is better.
Position 60th of 144 · derived.
Global Report on Food CrisesFSIN · 2024 · world median 222022▲ Improved since 2016
Chad: 20 · world median 22 · In IPC Phase 3+ (% of analysed population). Food Security Information Network (FSIN), 2025 edition, data for 2024.
Published values in that edition run from 3 to 56; lower is better.
Position 25th of 44 · derived, 1st = worst.
Insecticide-Treated Net UseMAP · 2025 · world median 4546.8845▲ Improved since 2015
Chad: 46.88 · world median 45 · Population that slept under an insecticide-treated net (%). Malaria Atlas Project (MAP), 2025 edition, data for 2025.
Published values in that edition run from 8.586 to 88.58; higher is better.
Behind the world median36
Statistics on which Chad does worse than the middle country measured.
Minimum Dietary Diversity, Children Aged 6–23 MonthsUNICEF · 2025 · world median 37.5727.937.57No earlier reading
Chad: 27.9 · world median 37.57 · Children aged 6-23 months fed from at least 5 of 8 food groups (%). UNICEF, 2025 edition, data for 2025.
Published values in that edition run from 8.089 to 85.88; higher is better.
Position 70th of 115 · derived.
Early Initiation of BreastfeedingUNICEF · 2024 · world median 52.9547.1652.95No earlier reading
Chad: 47.16 · world median 52.95 · Newborns put to the breast within one hour of birth (%). UNICEF, 2024 edition, data for 2024.
Published values in that edition run from 7.749 to 93.1; higher is better.
Position 87th of 136 · derived.
Severe Child Food Poverty, Children Aged 6–23 MonthsUNICEF · 2024 · world median 21.2628.621.26No earlier reading
Chad: 28.6 · world median 21.26 · Children aged 6-23 months fed from at most 2 of 8 food groups (%). UNICEF, 2024 edition, data for 2024.
Published values in that edition run from 1.169 to 63.08; lower is better.
Position 37th of 113 · derived, 1st = worst.
Malaria Incidence (P. falciparum)MAP · 2025 · world median 52.47200.0252.47No real change since 2015
Chad: 200.02 · world median 52.47 · New P. falciparum malaria cases per 1,000 people per year. Malaria Atlas Project (MAP), 2025 edition, data for 2025.
Published values in that edition run from 0 to 334.75; lower is better.
Malaria Mortality (P. falciparum)MAP · 2024 · world median 8.10641.588.106No real change since 2014
Chad: 41.58 · world median 8.106 · Deaths from P. falciparum malaria per 100,000 people per year. Malaria Atlas Project (MAP), 2024 edition, data for 2024.
Published values in that edition run from 0 to 133.27; lower is better.
Violent Discipline of ChildrenUNICEF · 2025 · world median 75.885.375.8No earlier reading
Chad: 85.3 · world median 75.8 · Children aged 1-14 experiencing violent discipline (%). UNICEF, 2025 edition, data for 2025.
Published values in that edition run from 37.6 to 94; lower is better.
Position 21st of 90 · derived, 1st = worst.
INFORM Severity IndexACAPS · 2025 · world median 3.143.1▲ Improved since 2020
Chad: 4 · world median 3.1 · INFORM Severity (1–5, most severe crisis). ACAPS, 2025 edition, data for 2025.
Published values in that edition run from 1.3 to 4.7; lower is better.
Position 16th of 81 · derived, 1st = worst.
Wasting Prevalence in Children Under FiveUNICEF, WHO and World Bank Group (Joint Malnutrition Estimates) · 2024 · world median 3.5467.7713.546No earlier reading
Chad: 7.771 · world median 3.546 · Children under 5 who are wasted (%). UNICEF, WHO and World Bank Group (Joint Malnutrition Estimates), 2024 edition, data for 2024.
Published values in that edition run from 0.1 to 22.74; lower is better.
Position 32nd of 163 · derived, 1st = worst.
Coefficient of Variation of Habitual Caloric ConsumptionFAO · 2024 · world median 0.250.330.25▲ Improved since 2014
Chad: 0.33 · world median 0.25 · Coefficient of variation of habitual calorie consumption across the population (standard deviation ÷ mean). Food and Agriculture Organization of the United Nations (FAO), 2024 edition, data for 2024.
Published values in that edition run from 0.17 to 0.4; lower is better.
Share of Population Unable to Afford a Healthy DietFAO · 2025 · world median 26.466.626.4No real change since 2017
Chad: 66.6 · world median 26.4 · Share of the population unable to afford a healthy diet (%). Food and Agriculture Organization of the United Nations (FAO), 2025 edition, data for 2025.
Published values in that edition run from 0.6 to 93.9; lower is better.
Position 22nd of 145 · derived, 1st = worst.
Immunisation Coverage, Measles First Dose (MCV1)WUENIC · 2025 · world median 906890▲ Improved since 2015
Chad: 68 · world median 90 · Infants given a first dose of measles vaccine (%). WHO and UNICEF (WUENIC), 2025 edition, data for 2025.
Published values in that edition run from 13 to 99; higher is better.
Immunisation Coverage, DTP3WUENIC · 2025 · world median 917191▲ Improved since 2015
Chad: 71 · world median 91 · Infants given a third dose of DTP vaccine (%). WHO and UNICEF (WUENIC), 2025 edition, data for 2025.
Published values in that edition run from 39 to 99; higher is better.
Prevalence of Moderate or Severe Food InsecurityFAO · 2024 · world median 20.96520.9▲ Improved since 2015
Chad: 65 · world median 20.9 · Population in moderate or severe food insecurity (%). Food and Agriculture Organization of the United Nations (FAO), 2024 edition, data for 2024.
Published values in that edition run from 1 to 88.8; lower is better.
Position 16th of 135 · derived, 1st = worst.
PM2.5 Air Pollution ExposureAtmospheric Composition Analysis Group, Washington University in St. Louis · 2023 · world median 14.4541.614.45▼ Worsened since 2013
Chad: 41.6 · world median 14.45 · Population-weighted PM2.5 concentration (µg/m³). Atmospheric Composition Analysis Group, Washington University in St. Louis, 2023 edition, data for 2023.
Published values in that edition run from 2.5 to 68.2; lower is better.
Position 15th of 220 · derived, 1st = worst.
Oral Rehydration Salts for Children with DiarrhoeaUNICEF · 2024 · world median 41.517.441.5No earlier reading
Chad: 17.4 · world median 41.5 · Children under 5 with diarrhoea given oral rehydration salts (%). UNICEF, 2024 edition, data for 2024.
Published values in that edition run from 9.9 to 95.4; higher is better.
Position 120th of 127 · derived.
Postnatal Care for Newborns Within Two DaysUNICEF · 2025 · world median 82.92782.9No earlier reading
Chad: 27 · world median 82.9 · Newborns with a health check within 2 days of birth (%). UNICEF, 2025 edition, data for 2025.
Published values in that edition run from 7.3 to 99.9; higher is better.
Position 103rd of 109 · derived.
Infant Mortality RateUN IGME · 2024 · world median 12.2656.2612.26▲ Improved since 2014
Chad: 56.26 · world median 12.26 · Deaths before age one (per 1,000 live births). UN Inter-agency Group for Child Mortality Estimation (UN IGME), 2024 edition, data for 2024.
Published values in that edition run from 1.214 to 71.87; lower is better.
Position 11th of 200 · derived, 1st = worst.
Neonatal Mortality RateUN IGME · 2024 · world median 8.13430.398.134No real change since 2014
Chad: 30.39 · world median 8.134 · Deaths in the first 28 days (per 1,000 live births). UN Inter-agency Group for Child Mortality Estimation (UN IGME), 2024 edition, data for 2024.
Published values in that edition run from 0.544 to 39.47; lower is better.
Position 11th of 200 · derived, 1st = worst.
Prevalence of UndernourishmentFAO · 2023 · world median 5.2325.2▼ Worsened since 2013
Chad: 32 · world median 5.2 · Population undernourished (%). Food and Agriculture Organization of the United Nations (FAO), 2023 edition, data for 2023.
Published values in that edition run from 2.5 to 54.2; lower is better.
Position 9th of 104 · derived, 1st = worst.
Mortality Rate, Ages 5–14UN IGME · 2024 · world median 2.85820.312.858No real change since 2014
Chad: 20.31 · world median 2.858 · Deaths between ages 5 and 14 (per 1,000 children aged 5). UN Inter-agency Group for Child Mortality Estimation (UN IGME), 2024 edition, data for 2024.
Published values in that edition run from 0.392 to 59.04; lower is better.
Position 8th of 200 · derived, 1st = worst.
Dietary Energy SupplyFAO · 2024 · world median 2,9822,1212,982▼ Worsened since 2014
Chad: 2,121 · world median 2,982 · Dietary energy supply (kcal per person per day). Food and Agriculture Organization of the United Nations (FAO), 2024 edition, data for 2024.
Published values in that edition run from 1,757 to 3,962; higher is better.
Position 150th of 155 · derived.
Adolescent Birth Rate (Ages 15–19)UN DESA Population Division · 2023 · world median 27.46134.7427.46No real change since 2013
Chad: 134.74 · world median 27.46 · Live births per 1,000 women aged 15–19. UN DESA Population Division, 2023 edition, data for 2023.
Published values in that edition run from 0.465 to 163.09; lower is better.
Position 7th of 222 · derived, 1st = worst.
Stillbirth RateUN IGME · 2023 · world median 8.16328.448.163No real change since 2013
Chad: 28.44 · world median 8.163 · Stillbirths (per 1,000 total births). UN Inter-agency Group for Child Mortality Estimation (UN IGME), 2023 edition, data for 2023.
Published values in that edition run from 1.18 to 34.9; lower is better.
Position 6th of 200 · derived, 1st = worst.
Adult Mortality (Probability of Dying Between 15 and 60)UN DESA Population Division · 2023 · world median 133.7344.75133.7No real change since 2013
Chad: 344.75 · world median 133.7 · Deaths before age 60 per 1,000 people alive at 15, at that year's death rates. UN DESA Population Division, 2023 edition, data for 2023.
Published values in that edition run from 25.15 to 415.44; lower is better.
Position 5th of 222 · derived, 1st = worst.
Gender Inequality IndexUNDP Human Development Report Office · 2023 · world median 0.3510.670.351No real change since 2018
Chad: 0.67 · world median 0.351 · GII (0 = full equality, 1 = maximum inequality). UNDP Human Development Report Office, 2023 edition, data for 2023.
Published values in that edition run from 0.003 to 0.838; lower is better.
Ranked 169th of 172 by UNDP Human Development Report Office.
Antenatal Care Coverage, At Least Four VisitsUNICEF · 2025 · world median 813181No earlier reading
Chad: 31 · world median 81 · Women with a live birth who had 4+ antenatal visits (%). UNICEF, 2025 edition, data for 2025.
Published values in that edition run from 22.6 to 100; higher is better.
Position 150th of 153 · derived.
Human Development IndexUNDP Human Development Report Office · 2023 · world median 0.7620.4160.762No real change since 2013
Chad: 0.416 · world median 0.762 · HDI score (0–1). UNDP Human Development Report Office, 2023 edition, data for 2023.
Published values in that edition run from 0.388 to 0.972; higher is better.
Ranked 190th of 193 by UNDP Human Development Report Office.
Demand for Family Planning Satisfied by Modern MethodsUN DESA Population Division · 2023 · world median 71.2525.671.25No real change since 2013
Chad: 25.6 · world median 71.25 · Share of women aged 15–49 wanting to avoid pregnancy who use a modern method (%). UN DESA Population Division, 2023 edition, data for 2023.
Published values in that edition run from 8.4 to 92.4; higher is better.
Position 193rd of 196 · derived.
Exclusive Breastfeeding Under Six MonthsUNICEF · 2024 · world median 40.747.35340.74No earlier reading
Chad: 7.353 · world median 40.74 · Infants under 6 months exclusively breastfed (%). UNICEF, 2024 edition, data for 2024.
Published values in that edition run from 3.497 to 83.3; higher is better.
Position 134th of 136 · derived.
Days Above 35°CECMWF · 2025 · world median 3.48204.573.48No real change since 2015
Chad: 204.57 · world median 3.48 · Days a year with a maximum temperature above 35°C, averaged over the country’s land. World Bank Group (Climate Change Knowledge Portal), from Copernicus ERA5 (ECMWF), 2025 edition, data for 2025.
Published values in that edition run from 0 to 222.89; lower is better.
Institutional DeliveriesUNICEF · 2025 · world median 96.927.296.9No earlier reading
Chad: 27.2 · world median 96.9 · Live births delivered in a health facility (%). UNICEF, 2025 edition, data for 2025.
Published values in that edition run from 11.5 to 100; higher is better.
Life Expectancy at Age 65UN DESA Population Division · 2023 · world median 16.3912.2516.39▼ Worsened since 2013
Chad: 12.25 · world median 16.39 · Further years a 65-year-old would live at current death rates. UN DESA Population Division, 2023 edition, data for 2023.
Published values in that edition run from 12.13 to 23.21; higher is better.
Position 220th of 222 · derived.
Care-Seeking for Children with Symptoms of PneumoniaUNICEF · 2024 · world median 67.717.667.7No earlier reading
Chad: 17.6 · world median 67.7 · Children under 5 with pneumonia symptoms taken to a health provider (%). UNICEF, 2024 edition, data for 2024.
Published values in that edition run from 14 to 99.1; higher is better.
Position 126th of 127 · derived.
Human Capital IndexWorld Bank Group · 2020 · world median 0.5640.30.564No real change since 2010
Chad: 0.3 · world median 0.564 · HCI score (0–1). World Bank Group, 2020 edition, data for 2020.
Published values in that edition run from 0.292 to 0.879; higher is better.
Position 171st of 172 · derived.
Maternal Mortality RatioMMEIG · 2023 · world median 46.65747.5446.65No real change since 2013
Chad: 747.54 · world median 46.65 · Maternal deaths per 100,000 live births. UN Maternal Mortality Estimation Inter-Agency Group (MMEIG), 2023 edition, data for 2023.
Published values in that edition run from 0.11 to 992.83; lower is better.
Position 2nd of 195 · derived, 1st = worst.
Global Multidimensional Poverty IndexOPHI · 2025 · world median 0.0390.5170.039No real change since 2018
Chad: 0.517 · world median 0.039 · MPI (0–1). Oxford Poverty and Human Development Initiative (OPHI), 2025 edition, data for 2025.
Published values in that edition run from 0 to 0.517; lower is better.
Position 1st of 109 · derived, 1st = worst.
Level with the median, or no median to compare1
Female Genital Mutilation PrevalenceUNICEF · 2024 · world median 34.134.134.1No earlier reading
Chad: 34.1 · world median 34.1 · Women aged 15-49 who have undergone FGM (%). UNICEF, 2024 edition, data for 2024.
Published values in that edition run from 0.3 to 99.2; lower is better.
No better end8
These describe the shape of a country — more is not better or worse, only different — so they are never ahead or behind.
Children with Functional DifficultiesUNICEF · 2024 · world median 1328.713No earlier reading
Chad: 28.7 · world median 13 · Children aged 5-17 with a functional difficulty (%). UNICEF, 2024 edition, data for 2024.
Published values in that edition run from 0.9 to 35.2.
Catastrophic Out-of-Pocket Health SpendingWorld Bank Group · 2019 · world median 6.888.6876.88No earlier reading
Chad: 8.687 · world median 6.88 · Population in households spending more than 10% of their budget on health out of pocket (%). World Bank Group, 2019 edition, data for 2019.
Published values in that edition run from 0.133 to 31.21.
Cost of a Healthy DietFAO · 2025 · world median 4.554.074.55Moved since 2017
Chad: 4.07 · world median 4.55 · Cost of the cheapest locally available healthy diet, PPP dollars per person per day. Food and Agriculture Organization of the United Nations (FAO), 2025 edition, data for 2025.
Published values in that edition run from 2.66 to 8.27.
Average Weekly Hours WorkedILO · 2025 · world median 38.8930.5538.89Moved since 2015
Chad: 30.55 · world median 38.89 · Average weekly hours actually worked per employed person. International Labour Organization (ILO), 2025 edition, data for 2025.
Published values in that edition run from 23.64 to 54.7.
Position 168th of 182 · derived, counted from the highest value.
Pesticide Use per HectareFAO · 2024 · world median 1.730.011.73No real change since 2014
Chad: 0.01 · world median 1.73 · Pesticide use (kg per hectare of cropland). Food and Agriculture Organization of the United Nations (FAO), 2024 edition, data for 2024.
Published values in that edition run from 0 to 37.72.
Position 176th of 178 · derived, counted from the highest value.
Contraceptive Prevalence (Any Method)UN DESA Population Division · 2023 · world median 41.257.441.25No real change since 2013
Chad: 7.4 · world median 41.25 · Share of all women aged 15–49 using any contraceptive method (%). UN DESA Population Division, 2023 edition, data for 2023.
Published values in that edition run from 6.6 to 78.7.
Modern Contraceptive PrevalenceUN DESA Population Division · 2023 · world median 35.46.835.4No real change since 2013
Chad: 6.8 · world median 35.4 · Share of all women aged 15–49 using a modern contraceptive method (%). UN DESA Population Division, 2023 edition, data for 2023.
Published values in that edition run from 2 to 73.8.
Caesarean Section RateUNICEF · 2025 · world median 20.651.120.65No earlier reading
Chad: 1.1 · world median 20.65 · Live births delivered by caesarean section (%). UNICEF, 2025 edition, data for 2025.
Published values in that edition run from 0.6 to 72.2.
No current reading for Chad
Adults Who Have Been Too Anxious or Depressed to Carry On, Births Attended by Skilled Health Staff (last 2019), Excess Mortality During the COVID-19 Pandemic, Fatal Occupational Injuries, Fish and Seafood Supply per Person, Fruit Supply per Person, HPV Vaccination Coverage, Girls, Low Birthweight Prevalence, Malaria Incidence (P. vivax), Meat Supply per Person, Share of Dietary Energy Supply from Cereals, Roots and Tubers (last 2008) and Vegetable Supply per Person. Listed rather than hidden, so the page can be checked against it.
“Position · derived” is this site’s ordering of the published values, 1st = best unless the row says otherwise; the publisher ranks no country on it. Rank, position and standing
05Country Index 2026
Health & Wellbeing among Chad’s 15 topics
Health & Wellbeing is Chad’s 11th best-placed topic of 15. Strongest first, each marker at its share of that topic’s field.
- Environment & Sustainability13th of 1863/4 keys
- Work & Labourjoint 117th of 1824/4 keys
- Poverty & Inequality136th of 1593/3 keys
- Gender & Equality157th of 1834/4 keys
- Democracy & Civil Liberties173rd of 1984/4 keys
- Digital & Technology177th of 1984/4 keys
- Risk & Resilience173rd of 1934/4 keys
- Energy149th of 1653/3 keys
- Governance & Institutions178th of 1944/4 keys
- Education & Knowledge189th of 1984/4 keys
- Health & Wellbeing195th of 2004/4 keys
- Peace & Security174th of 1774/4 keys
- Development & Human Capitaljoint 194th of 1963/3 keys
- Economy & Innovation175th of 1764/4 keys
- Food & Agriculture183rd of 1844/4 keys
No standing on Mobility & Trade: too few of those topics’ key statistics are published for this country.
06The top of the list
Who leads on health & wellbeing
The three countries placed highest of 200, and the leaders Chad can most readily be measured against.
 1
 San Marino
Southern Europe
1st of 200 · 2 of 4 keys
Photo: Matl derivative work: Jjtkk · CC BY-SA 3.0, greyscale
 2
 Monaco
Western Europe
2nd of 200 · 2 of 4 keys
Photo: Martin Weber derivative work: Jjtkk · CC BY-SA 3.0, greyscale
 3
 Andorra
Southern Europe
3rd of 200 · 2 of 4 keys
Photo: Tiia Monto derivative work: Jjtkk · CC BY-SA 3.0, greyscale
Placed highest nearby
Highest placed on all 4 keys
 South Korea5th4/4 keys
Highest in Africa
 Cabo Verde80th4/4 keys
Highest in Middle Africa
 São Tomé and Príncipe=110th3/4 keys
This page
Chad195th4/4 keys
Positions out of 200 placed on the topic. A country needs readings on enough keys to be placed, and the top of the list is often held on fewer of them.
07Analysis
Charts and analysis about Chad and health & wellbeing
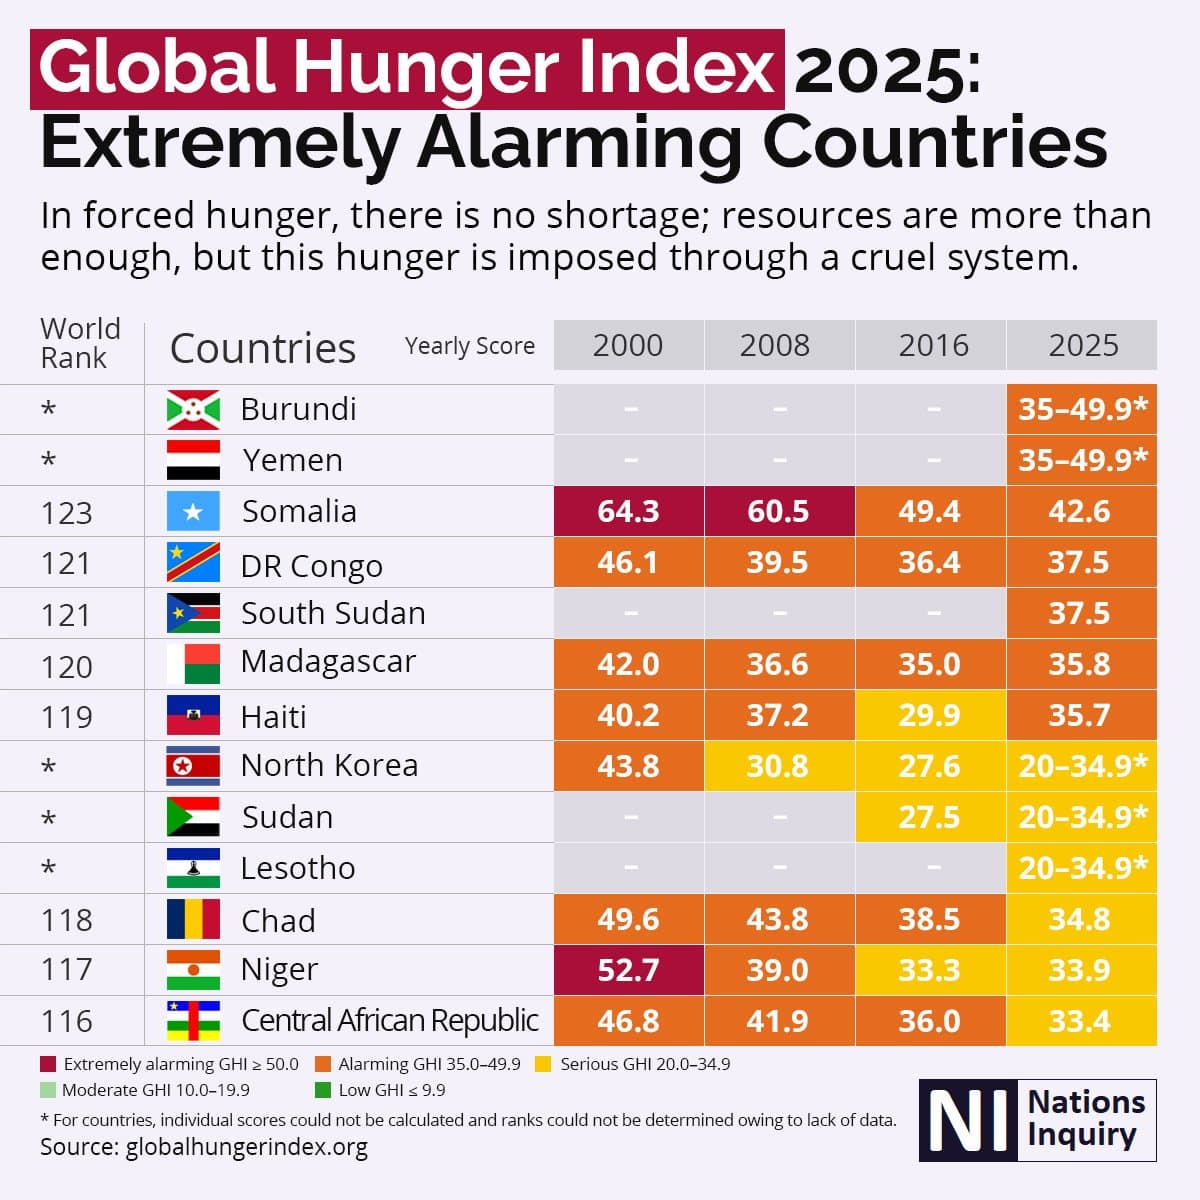
On health & wellbeing
Global Hunger Index 2025: Countries with the Most Alarming Hunger Crisis
Thirteen countries scored across four editions — 2000, 2008, 2016 and 2025 — and five the report could not score at all. DR Congo and South Sudan share 121st place on 37.5.
On health & wellbeing
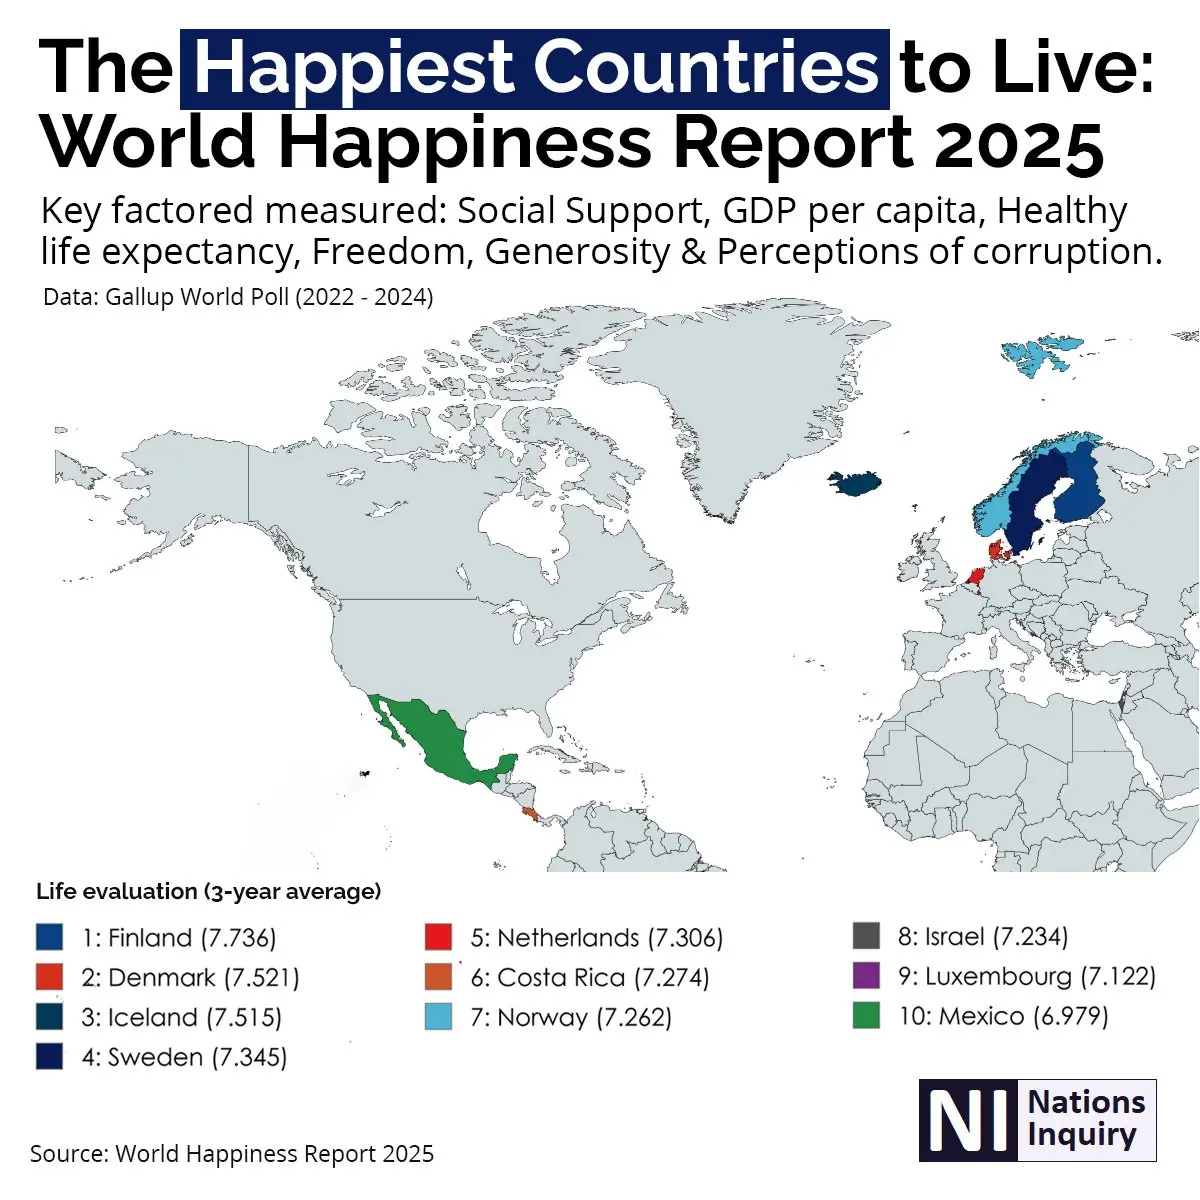
World Happiness Report 2025: Finland Leads Again as the US and UK Face Major Declines
The ten highest life evaluations of 2025, drawn on a world map, and the six things the report uses to explain them. Costa Rica and Mexico are the only two outside Europe and the Middle East.
08Questions
Chad on health & wellbeing: questions answered
Every answer is built from the numbers on this page, so none can say something the page does not.
How does Chad rank on health & wellbeing?
Chad is placed 195th of 200 countries on Health & Wellbeing in the Country Index 2026, from 4 of its 4 key statistics (Life Expectancy at Birth, Under-Five Mortality Rate, Stunting Prevalence in Children Under Five and Prevalence of Severe Food Insecurity). The position is this site’s ordering of published statistics, not a rank any publisher printed.
What is the latest Life Expectancy at Birth figure for Chad?
55.07 in 2023 (years a newborn would live at current death rates), according to UN DESA Population Division. The world median in the same edition was 74.63.
What is the latest Under-Five Mortality Rate figure for Chad?
97.26 in 2024 (deaths before age five (per 1,000 live births)), according to UN Inter-agency Group for Child Mortality Estimation (UN IGME). The world median in the same edition was 14.54.
How does Chad compare with Nigeria on health & wellbeing?
Nigeria is placed 196th of 200, and Chad 195th. Life Expectancy at Birth: Nigeria 54.46, Chad 55.07; Under-Five Mortality Rate: Nigeria 115.65, Chad 97.26; Stunting Prevalence in Children Under Five: Nigeria 33.8, Chad 31.92; Prevalence of Severe Food Insecurity: Nigeria 26.4, Chad 25.2.
How have Chad’s health & wellbeing figures changed?
Life Expectancy at Birth rose from 47.94 in 2000 to 55.07 in 2023; Under-Five Mortality Rate fell from 182.43 in 2000 to 97.26 in 2024; Prevalence of Severe Food Insecurity fell from 32.4 in 2015 to 25.2 in 2024.
Which health & wellbeing statistics are missing for Chad?
No current reading is published for Chad on Adults Who Have Been Too Anxious or Depressed to Carry On, Births Attended by Skilled Health Staff, Excess Mortality During the COVID-19 Pandemic, Fatal Occupational Injuries, Fish and Seafood Supply per Person, Fruit Supply per Person, HPV Vaccination Coverage, Girls, Low Birthweight Prevalence, Malaria Incidence (P. vivax), Meat Supply per Person, Share of Dietary Energy Supply from Cereals, Roots and Tubers and Vegetable Supply per Person. They are listed rather than hidden, so the evidence on the page can be checked against it.
09Method
Method, sources and how to cite
What this topic does not measure
Health spending, hospital beds and doctors per person are not measured, because more of any of them does not guarantee better outcomes. Mental health and self-reported happiness are not part of this topic. Food supply per person is measured under Food & Agriculture. Maternal mortality and many other indicators are published here as context; maternal mortality is a key in Development & Human Capital instead.
How the Health & Wellbeing standing is decided
A standing is this site’s ordering, named with its edition — never a publisher’s rank. 4 key statistics vote, one vote each; every country’s published value becomes a place within that key’s own field, the places are averaged, and the average is never published. A country needs 2 of the 4 keys to be placed.
The health & wellbeing method, step by stepHow every standing on this site is built
The key statistics and their licences
- Life Expectancy at Birth — UN DESA Population Division, CC BY 3.0 IGO
- Under-Five Mortality Rate — UN Inter-agency Group for Child Mortality Estimation (UN IGME), CC BY 3.0 IGO
- Stunting Prevalence in Children Under Five — UNICEF, WHO and World Bank Group (Joint Malnutrition Estimates), CC BY 3.0 IGO
- Prevalence of Severe Food Insecurity — Food and Agriculture Organization of the United Nations (FAO), CC BY 4.0
The other 49 statistics on this page come from 17 publishers, each named beside its numbers, with every edition and licence on the datasets pages.
The standing itself is part of the Country Index 2026, published under CC BY-SA 4.0.
Photographs
Chad’s banner and the countries placed highest, from their profiles: Wikimedia Commons, shown in greyscale, each used under the licence named.
- Chad (banner) — File: Robertgrafl derivative work: Jjtkk, Public domain
- San Marino — Matl derivative work: Jjtkk, CC BY-SA 3.0
- Monaco — Martin Weber derivative work: Jjtkk, CC BY-SA 3.0
- Andorra — Tiia Monto derivative work: Jjtkk, CC BY-SA 3.0
Cite this page
Nations Inquiry (2026). Chad: Health & Wellbeing — standing and statistics, Country Index 2026. https://nationsinquiry.com/countries/chad/health