Latest available · compiled 2024
Severe Child Food Poverty, Children Aged 6–23 Months, 2024 compilation
Each country’s newest reading as of 2024; every row carries its own year · stored as published, never rewritten
This is the share of children aged 6 to 23 months who ate from no more than two of eight food groups the previous day — what UNICEF calls severe child food poverty. A child fed this narrowly, often on little more than a starchy staple or milk, is far more likely to become malnourished.
Severe Child Food Poverty, Children Aged 6–23 Months, 2024 compilation covers 113 countries. Somalia is highest, at 63.081; Belarus is lowest, at 1.169. The middle country reads 21.381. 4 readings are more than ten years older than the file and are listed but not compared.
Severe Child Food Poverty, Children Aged 6–23 Months · Latest available · compiled 2024
HighestSomalia
63.081
LowestBelarus
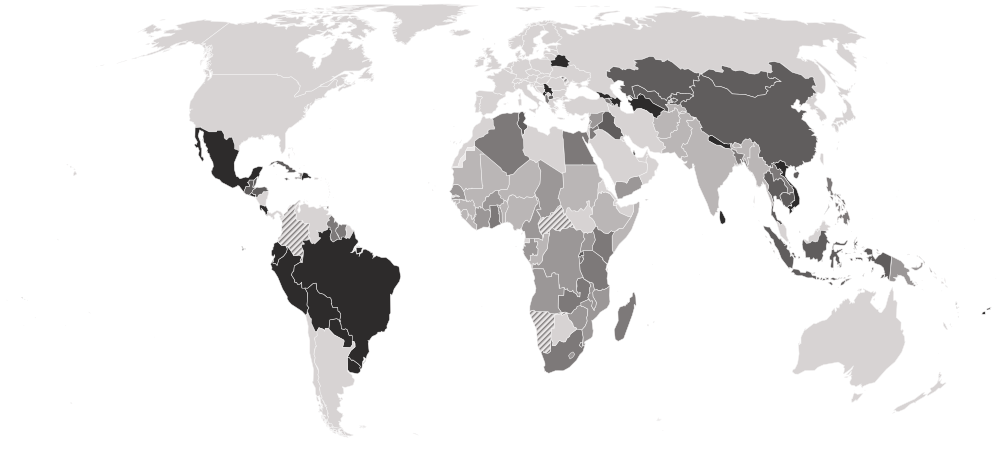
1.169Shaded by value in five groups of equal size, darkest at the lowest end.
01Position · derived
The table
Every country and every column of Severe Child Food Poverty, Children Aged 6–23 Months, 2024 compilation, as published. UNICEF ranks nobody on this measure; the position is derived here by ordering the published values. “=” marks a shared position.
Showing 25 of 113 countries · select a heading to sort
| derived | ||||
|---|---|---|---|---|
| 1 | SomaliaSOMEastern Africa · 2018 reading | 2018 | 63.081 | Reanalysed |
| 2 |  Guinea GINWestern Africa · 2018 reading | 2018 | 54.312 | Reanalysed |
| 3 |  Guinea-Bissau GNBWestern Africa · 2019 reading | 2019 | 52.781 | Reanalysed |
| 4 |  Afghanistan AFGSouthern Asia · 2022 reading | 2022 | 48.725 | Reanalysed |
| 5 |  Bhutan BTNSouthern Asia · 2015 reading | 2015 | 47.343 | Reanalysed |
| 6 |  Sierra Leone SLEWestern Africa · 2021 reading | 2021 | 46.495 | Reanalysed |
| 7 |  Ethiopia ETHEastern Africa · 2019 reading | 2019 | 46.011 | Reanalysed |
| 8 |  Nigeria NGAWestern Africa · 2024 reading | 2024 | 43.926 | Reanalysed |
| 9 |  Liberia LBRWestern Africa · 2019 reading | 2019 | 42.530 | Reanalysed |
| 10 |  Mali MLIWestern Africa · 2024 reading | 2024 | 41.853 | Reanalysed |
| 11 |  Namibia NAMSouthern Africa · 2013 reading, too old to compare | 2013 | 40.468 | Reanalysed |
| 12 |  India INDSouthern Asia · 2020 reading | 2020 | 40.254 | Reanalysed |
| 13 |  Pakistan PAKSouthern Asia · 2018 reading | 2018 | 38.422 | Reanalysed |
| 14 |  Mauritania MRTWestern Africa · 2020 reading | 2020 | 38.246 | Reanalysed |
| 15 |  Benin BENWestern Africa · 2021 reading | 2021 | 36.107 | Reanalysed |
| 16 |  Comoros COMEastern Africa · 2022 reading | 2022 | 34.847 | Reanalysed |
| 17 |  Republic of the Congo COGMiddle Africa · 2014 reading | 2014 | 34.708 | Reanalysed |
| 18 |  Myanmar MMRSouth-eastern Asia · 2016 reading | 2016 | 34.520 | Reanalysed |
| 19 |  Kiribati KIRMicronesia · 2018 reading | 2018 | 34.474 | Reanalysed |
| 20 |  Sudan SDNNorthern Africa · 2014 reading | 2014 | 33.786 | Reanalysed |
| 21 |  Gambia GMBWestern Africa · 2020 reading | 2020 | 33.381 | Reanalysed |
| 22 |  Niger NERWestern Africa · 2022 reading | 2022 | 32.425 | Reanalysed |
| 23 |  Tajikistan TJKCentral Asia · 2023 reading | 2023 | 32.219 | Reanalysed |
| 24 |  Burkina Faso BFAWestern Africa · 2021 reading | 2021 | 31.766 | Reanalysed |
| 25 |  Haiti HTICaribbean · 2017 reading | 2017 | 31.576 | Reanalysed |
| 26 |  Senegal SENWestern Africa · 2023 reading | 2023 | 31.532 | Reanalysed |
| 27 |  Lesotho LSOSouthern Africa · 2024 reading | 2024 | 31.290 | Reanalysed |
| 28 |  Côte d’Ivoire CIVWestern Africa · 2021 reading | 2021 | 31.019 | Reanalysed |
| 29 |  Mozambique MOZEastern Africa · 2022 reading | 2022 | 30.946 | Reanalysed |
| 30 |  Togo TGOWestern Africa · 2017 reading | 2017 | 30.497 | Reanalysed |
| 31 |  Syria SYRWestern Asia · 2019 reading | 2019 | 30.400 | External Reanalysis |
| 32 |  Lebanon LBNWestern Asia · 2023 reading | 2023 | 30.200 | Reported |
| 33 |  Timor-Leste TLSSouth-eastern Asia · 2020 reading | 2020 | 30.195 | Reanalysed |
| 34 |  Angola AGOMiddle Africa · 2015 reading | 2015 | 29.874 | Reanalysed |
| 35 |  Marshall Islands MHLMicronesia · 2017 reading | 2017 | 29.409 | Reanalysed |
| 36 |  DR Congo CODMiddle Africa · 2023 reading | 2023 | 29.113 | Reanalysed |
| 37 |  Chad TCDMiddle Africa · 2024 reading | 2024 | 28.600 | Reported |
| 38 |  Cameroon CMRMiddle Africa · 2018 reading | 2018 | 27.697 | Reanalysed |
| 39 |  Yemen YEMWestern Asia · 2021 reading | 2021 | 27.400 | Reported |
| 40 |  Gabon GABMiddle Africa · 2020 reading | 2020 | 27.246 | Reanalysed |
| 41 |  Papua New Guinea PNGMelanesia · 2017 reading | 2017 | 25.971 | Reanalysed |
| 42 |  Malawi MWIEastern Africa · 2020 reading | 2020 | 25.521 | Reanalysed |
| 43 |  Vanuatu VUTMelanesia · 2023 reading | 2023 | 25.472 | Reanalysed |
| 44 |  Zimbabwe ZWEEastern Africa · 2019 reading | 2019 | 25.063 | Reanalysed |
| 45 |  Uganda UGAEastern Africa · 2020 reading | 2020 | 24.291 | Reanalysed |
| 46 |  Madagascar MDGEastern Africa · 2024 reading | 2024 | 23.700 | Reported |
| 47 |  Zambia ZMBEastern Africa · 2018 reading | 2018 | 23.584 | Reanalysed |
| 48 |  Suriname SURSouth America · 2018 reading | 2018 | 23.444 | Reanalysed |
| 49 |  South Africa ZAFSouthern Africa · 2016 reading | 2016 | 22.792 | Reanalysed |
| 50 |  Samoa WSMPolynesia · 2019 reading | 2019 | 22.646 | Reanalysed |
| 51 |  São Tomé and Príncipe STPMiddle Africa · 2019 reading | 2019 | 22.321 | Reanalysed |
| 52 |  Laos LAOSouth-eastern Asia · 2023 reading | 2023 | 22.320 | Reanalysed |
| 53 |  Egypt EGYNorthern Africa · 2021 reading | 2021 | 22.258 | Reanalysed |
| 54 |  Tanzania TZAEastern Africa · 2022 reading | 2022 | 21.790 | Reanalysed |
| 55 |  Turks and Caicos Islands TCACaribbean · 2020 reading | 2020 | 21.469 | Reanalysed |
| 56 |  Ghana GHAWestern Africa · 2022 reading | 2022 | 21.381 | Reanalysed |
| 57 |  Bangladesh BGDSouthern Asia · 2022 reading | 2022 | 21.255 | Reanalysed |
| 58 |  Jordan JORWestern Asia · 2023 reading | 2023 | 19.651 | Reanalysed |
| 59 |  Guyana GUYSouth America · 2019 reading | 2019 | 19.522 | Reanalysed |
| 60 |  Central African Republic CAFMiddle Africa · 2010 reading, too old to compare | 2010 | 19.031 | Reanalysed |
| 61 |  Eswatini SWZSouthern Africa · 2021 reading | 2021 | 18.763 | Reanalysed |
| 62 |  Albania ALBSouthern Europe · 2017 reading | 2017 | 18.178 | Reanalysed |
| 63 |  Philippines PHLSouth-eastern Asia · 2022 reading | 2022 | 18.100 | Reanalysed |
| 64 |  Burundi BDIEastern Africa · 2016 reading | 2016 | 17.938 | Reanalysed |
| 65 |  Algeria DZANorthern Africa · 2019 reading | 2019 | 16.809 | Reanalysed |
| 66 |  Kenya KENEastern Africa · 2022 reading | 2022 | 16.203 | Reanalysed |
| 67 |  Trinidad and Tobago TTOCaribbean · 2022 reading | 2022 | 14.655 | Reanalysed |
| 68 |  Armenia ARMWestern Asia · 2016 reading | 2016 | 14.403 | Reanalysed |
| 69 |  Iraq IRQWestern Asia · 2018 reading | 2018 | 14.347 | Reanalysed |
| 70 |  Tuvalu TUVPolynesia · 2019 reading | 2019 | 13.995 | Reanalysed |
| 71 |  Cambodia KHMSouth-eastern Asia · 2021 reading | 2021 | 13.666 | Reanalysed |
| 72 |  Palestine PSEWestern Asia · 2020 reading | 2020 | 12.893 | Reanalysed |
| 73 |  Tonga TONPolynesia · 2019 reading | 2019 | 12.756 | Reanalysed |
| 74 |  Rwanda RWAEastern Africa · 2020 reading | 2020 | 12.399 | Reanalysed |
| 75 |  Indonesia IDNSouth-eastern Asia · 2017 reading | 2017 | 12.194 | Reanalysed |
| 76 |  Nauru NRUMicronesia · 2023 reading | 2023 | 12.174 | Reanalysed |
| 77 |  Kazakhstan KAZCentral Asia · 2015 reading | 2015 | 11.476 | Reanalysed |
| 78 |  Qatar QATWestern Asia · 2023 reading | 2023 | 11.288 | Reanalysed |
| 79 |  Uzbekistan UZBCentral Asia · 2021 reading | 2021 | 11.073 | Reanalysed |
| 80 |  North Macedonia MKDSouthern Europe · 2019 reading | 2019 | 10.933 | Reanalysed |
| 81 |  China CHNEastern Asia · 2017 reading | 2017 | 10.200 | External Reanalysis |
| 82 |  Honduras HNDCentral America · 2019 reading | 2019 | 9.930 | Reanalysed |
| 83 |  Belize BLZCentral America · 2015 reading | 2015 | 9.890 | Reanalysed |
| 84 |  Thailand THASouth-eastern Asia · 2022 reading | 2022 | 9.766 | Reanalysed |
| 85 |  Mongolia MNGEastern Asia · 2018 reading | 2018 | 9.712 | Reanalysed |
| 86 |  Tunisia TUNNorthern Africa · 2023 reading | 2023 | 9.452 | Reanalysed |
| 87 |  Cuba CUBCaribbean · 2019 reading | 2019 | 9.427 | Reanalysed |
| 88 |  Guatemala GTMCentral America · 2015 reading | 2015 | 9.352 | Reanalysed |
| 89 |  Jamaica JAMCaribbean · 2022 reading | 2022 | 9.231 | Reanalysed |
| 90 |  Kyrgyzstan KGZCentral Asia · 2023 reading | 2023 | 8.937 | Reanalysed |
| 91 |  Bolivia BOLSouth America · 2023 reading | 2023 | 8.847 | Reanalysed |
| 92 |  Mexico MEXCentral America · 2015 reading | 2015 | 8.735 | Reanalysed |
| 93 |  Vietnam VNMSouth-eastern Asia · 2020 reading | 2020 | 8.522 | Reanalysed |
| 94 |  Brazil BRASouth America · 2019 reading | 2019 | 8.400 | External Reanalysis |
| 95 |  Turkmenistan TKMCentral Asia · 2024 reading | 2024 | 8.386 | Reanalysed |
| 96 |  Azerbaijan AZEWestern Asia · 2023 reading | 2023 | 8.252 | Reanalysed |
| 97 |  Nepal NPLSouthern Asia · 2022 reading | 2022 | 7.911 | Reanalysed |
| 98 |  Montenegro MNESouthern Europe · 2018 reading | 2018 | 7.906 | Reanalysed |
| 99 |  Colombia COLSouth America · 2010 reading, too old to compare | 2010 | 7.885 | Reanalysed |
| 100 |  Fiji FJIMelanesia · 2021 reading | 2021 | 7.822 | Reanalysed |
| 101 |  Dominican Republic DOMCaribbean · 2019 reading | 2019 | 7.810 | Reanalysed |
| 102 |  Georgia GEOWestern Asia · 2018 reading | 2018 | 7.601 | Reanalysed |
| 103 |  Moldova MDAEastern Europe · 2005 reading, too old to compare | 2005 | 6.165 | Reanalysed |
| 104 |  Maldives MDVSouthern Asia · 2017 reading | 2017 | 5.648 | Reanalysed |
| 105 |  Paraguay PRYSouth America · 2016 reading | 2016 | 5.589 | Reanalysed |
| 106 |  El Salvador SLVCentral America · 2014 reading | 2014 | 4.798 | Reanalysed |
| 107 |  Sri Lanka LKASouthern Asia · 2016 reading | 2016 | 4.795 | Reanalysed |
| 108 |  Uruguay URYSouth America · 2023 reading | 2023 | 4.090 | Reanalysed |
| 109 |  Costa Rica CRICentral America · 2018 reading | 2018 | 3.004 | Reanalysed |
| 110 |  Ecuador ECUSouth America · 2024 reading | 2024 | 2.722 | Reanalysed |
| 111 |  Peru PERSouth America · 2024 reading | 2024 | 2.255 | Reanalysed |
| 112 |  Serbia SRBSouthern Europe · 2019 reading | 2019 | 1.606 | Reanalysed |
| 113 | BelarusBLREastern Europe · 2019 reading | 2019 | 1.169 | Reanalysed |
02In Severe Child Food Poverty, Children Aged 6–23 Months, 2024 compilation
At either end
The 5 countries at each end of the headline. Readings too old to compare take no part.
Highest
- 1Somalia63.081
- 2Guinea54.312
- 3Guinea-Bissau52.781
- 4Afghanistan48.725
- 5Bhutan47.343
Lowest
- 113Belarus1.169
- 112Serbia1.606
- 111Peru2.255
- 110Ecuador2.722
- 109Costa Rica3.004
A higher value is the worse result. The middle country reads 21.381. “Shared” marks a value another country also holds.
03Caveats
Read before you use
Readings from many years
Each country’s newest reading as of 2024, from 2005 to 2024. 4 are more than ten years older than the file: listed and marked, but left out of the ends and the changes.
Nothing missing
Every one of the 113 countries has every column.
Some readings carry a flag
UNICEF marks readings it considers estimates or provisional. The flags in this file: Reanalysed, External Reanalysis, Reported.
04The files
Download and cite
- .csv
For a spreadsheet or code
113 rows · 5.5 KB · UTF-8, opens in Excel
Opens with 11 lines of source notes; the table starts on row 13.
Download severe-child-food-poverty-2024-nations-inquiry.csv - ↗
The publisher’s original
UNICEF’s own file, on its own site.
.NT_CF_FG_0_T_2
What this site changed: Reshaped to one row per country, with its ISO code; no value recalculated, rescaled or rounded. In full
Licence: CC BY 3.0 IGO · what it allows, in plain words
Cite this edition
UNICEF (2024). Severe Child Food Poverty, Children Aged 6–23 Months, 2024 compilation [data set]. As held by Nations Inquiry, https://nationsinquiry.com/datasets/severe-child-food-poverty/2024
051 held
Other editions
‹ The edition before
This is the first edition held here.
The edition after ›
This is the newest edition; the next will get a page of its own.
All of them
Severe Child Food Poverty, Children Aged 6–23 Months: every edition1 held, with the data dictionary, coverage and licence.
How it has moved, charted by country