Dataset · GGDC
Historical GDP per Capita (Maddison)
112 years, 1820–2022 · 166 countries
Historical GDP per capita follows each country's output per person back to 1820, in 2011 international dollars, from the Maddison Project Database. It joins economic historians' reconstructions of old national accounts onto modern statistics, so that incomes two centuries apart can be set on one scale.
This site holds every year from 1820 to 2022, read from GGDC’s own data and stored exactly as published.
Historical GDP per Capita (Maddison) · the file
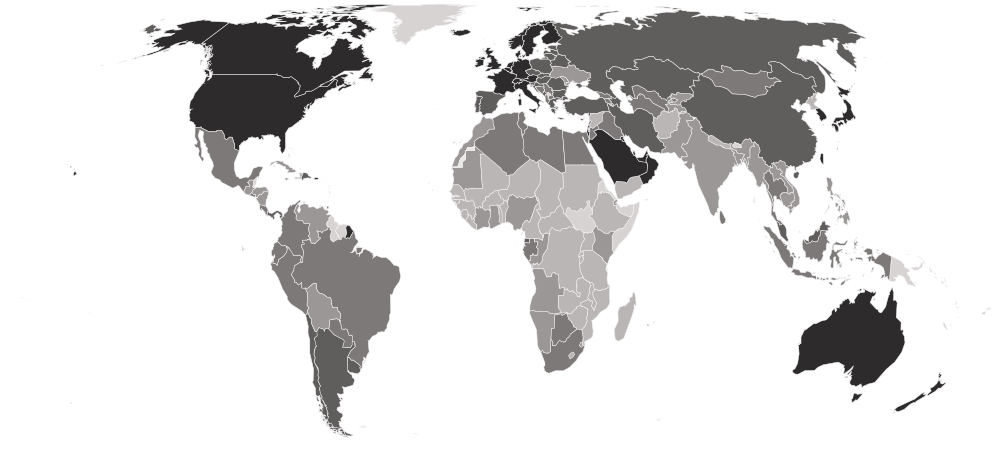
- Newest
- Historical GDP per Capita (Maddison), 2022
- Held
- 112 years · 13,912 rows
- Licence
- CC BY 4.0
01112 years
Every year
Every year comes from GGDC’s 2023 release, recalculated on one method. Each opens the full table for that year; each downloads as a CSV.
| Year | Countries | Change | Read | Download |
|---|---|---|---|---|
| Historical GDP per Capita (Maddison), 2022Newest | 166 | ±0 | September 29, 2026 | CSV |
| Historical GDP per Capita (Maddison), 2021 | 166 | ±0 | September 29, 2026 | CSV |
| Historical GDP per Capita (Maddison), 2020 | 166 | ±0 | September 29, 2026 | CSV |
| Historical GDP per Capita (Maddison), 2019 | 166 | ±0 | September 29, 2026 | CSV |
| Historical GDP per Capita (Maddison), 2018 | 166 | ±0 | September 29, 2026 | CSV |
| Historical GDP per Capita (Maddison), 2017 | 166 | ±0 | September 29, 2026 | CSV |
| Historical GDP per Capita (Maddison), 2016 | 166 | ±0 | September 29, 2026 | CSV |
| Historical GDP per Capita (Maddison), 2015 | 166 | ±0 | September 29, 2026 | CSV |
| Historical GDP per Capita (Maddison), 2014 | 166 | ±0 | September 29, 2026 | CSV |
| Historical GDP per Capita (Maddison), 2013 | 166 | ±0 | September 29, 2026 | CSV |
| Historical GDP per Capita (Maddison), 2012 | 166 | ±0 | September 29, 2026 | CSV |
| Historical GDP per Capita (Maddison), 2011 | 166 | ±0 | September 29, 2026 | CSV |
Show all 112 years
Every year in one file, one row per country per year: historical-gdp-per-capita-all-editions-nations-inquiry.csv
023 columns
What’s in the file
Every column, what it holds, how it is stored and what its values look like — what a reader needs before opening the file.
| Column | What it holds | Stored as | Range, 2022 | Distinct | Empty | Spread |
|---|---|---|---|---|---|---|
CountrycountryName | The country’s name, as this file spells it. | Text | — | 166 | 0 | |
ISO Codecountry_codeIdentifier | The ISO 3166-1 alpha-3 code, added by this site. Every table here joins on it. | Text · 3 letters | — | 166 | 0 | |
GDP per capita (2011 international $)gdp_per_capitaHeadline | The headline figure: GDP per capita (2011 international $). | Number · up to 13 decimals | 596 Central African Republic149,171 Central African Republic149,171 Qatarmiddle 12,890 Qatarmiddle 12,890 | 166 | 0 |
Profiled from the newest file. Range: the lowest and highest value, with the country holding it when only one does. Spread: countries in ten equal steps from lowest to highest. A higher value is the better result.
03166 countries across every year
Who is covered
How many countries each year holds, continent by continent, who joined and who left, and which places this site covers that the dataset never has.
| 2011 | 2012 | 2013 | 2014 | 2015 | 2016 | 2017 | 2018 | 2019 | 2020 | 2021 | 2022 | |
|---|---|---|---|---|---|---|---|---|---|---|---|---|
| Africa | 51 | 51 | 51 | 51 | 51 | 51 | 51 | 51 | 51 | 51 | 51 | 51 |
| Americas | 28 | 28 | 28 | 28 | 28 | 28 | 28 | 28 | 28 | 28 | 28 | 28 |
| Asia | 46 | 46 | 46 | 46 | 46 | 46 | 46 | 46 | 46 | 46 | 46 | 46 |
| Europe | 39 | 39 | 39 | 39 | 39 | 39 | 39 | 39 | 39 | 39 | 39 | 39 |
| Oceania | 2 | 2 | 2 | 2 | 2 | 2 | 2 | 2 | 2 | 2 | 2 | 2 |
| All | 166 | 166 | 166 | 166 | 166 | 166 | 166 | 166 | 166 | 166 | 166 | 166 |
The newest 12 of 112 years.
Who joined and who left
- 1993
 + United Arab Emirates
 - 1991− United Arab Emirates
- 1990
 + North Korea
 - 1985
 + Slovakia
 - 1980
 + Armenia
 + Azerbaijan
 + Belarus
 + Estonia
 + Georgia
 + Kazakhstan
 + Kyrgyzstan
 + Lithuania
 + Latvia
 + Moldova
 + Tajikistan
 + Turkmenistan
 + Ukraine
 + Uzbekistan
 - 1974− Armenia− Azerbaijan− Belarus− Estonia− Georgia− Kazakhstan− Kyrgyzstan− Lithuania− Latvia− Moldova− Tajikistan− Turkmenistan− Ukraine− Uzbekistan
- 1973+ Armenia+ Azerbaijan+ Belarus+ Estonia+ Georgia+ Kazakhstan+ Kyrgyzstan+ Lithuania+ Latvia+ Moldova+ Tajikistan+ Turkmenistan+ Ukraine+ Uzbekistan
- 1970
 + Czechia
Not in this dataset · 59 places this site covers
GGDC gives no figure for these in any year held here. It is the publisher’s choice of scope, and each place’s profile shows what is measured.
 American Samoa
 Andorra
 Anguilla
 Antigua and Barbuda
 Aruba
Aruba Bahamas
 Belize
 Bermuda
 Bhutan
 British Virgin Islands
 Brunei
 Cayman IslandsChannel Islands
 Cook Islands
 Curaçao
 Eritrea
 Faroe Islands
 Fiji
Fiji French Polynesia
 Gibraltar
 Greenland
 Grenada
 Guam
Guam Guyana
 Isle of Man
 Kiribati
 Kosovo
 Liechtenstein
 Macau
Macau Maldives
 Marshall Islands
 Micronesia
 Monaco
 Montserrat
 Nauru
Nauru New Caledonia
 NiueNorthern Cyprus
 Northern Mariana Islands
 Palau
Palau Papua New Guinea
 Saint Kitts and Nevis
 Saint Martin
 Saint Vincent and the Grenadines
 Samoa
Samoa San Marino
 Sint Maarten
 Solomon Islands
 SomaliaSomaliland
 South Sudan
 Suriname
 Timor-Leste
 Tonga
Tonga Turks and Caicos Islands
 Tuvalu
 United States Virgin Islands
 Vanuatu
 Vatican City
04Provenance
Where it comes from
The path from the publisher to this page, and what was checked and changed on the way.
1 · Publisher
Maddison Project, Groningen Growth and Development Centre (GGDC)
2 · Their file
Maddison Project Database 2023 — GDP per capita, 2022
3 · Read by this site
September 29, 2026
Imported by a script that parses each figure and writes it down unrounded.4 · Stored as
112 files, one per year
Each downloads as a CSV, or every year together as historical-gdp-per-capita-all-editions-nations-inquiry.csv5 · Used on
Its statistic page, and every profile it measures
Precision
The headline is stored to 13 decimals, as published.
Rounded by this site
Never. Tables on screen may show fewer decimals; the files never do.
Changed by this site
Reshaped into one row per country: regional and income-group totals are left out, only the columns listed are kept, each row gets its ISO 3166 code, and some country names are brought to one spelling. No value is recalculated, rescaled or rounded.
From the Maddison Project Database 2023, published by the Groningen Growth and Development Centre. Czechoslovakia, the Soviet Union and Yugoslavia are left out because their successor states are included for every year. The database names the historians behind each country's figures on the Sources sheet of its workbook.
05Reuse
Licence and credit
What the publisher’s licence lets you do, what it asks of you, and a credit line and citation ready to copy.
Licence · checked September 29, 2026
- Share and redistribute it
- Adapt it and build on it
- Use it commercially
- Credit the publisher
- Say what you changed
Share, adapt and use commercially. Credit the publisher and say if you changed anything.
In plain words
Free to reuse, commercially too, with credit to the Maddison Project. The project also asks that the historians behind a country’s figures be cited when the data are charted; they are listed on the Sources sheet of its workbook.
A credit line
Source: Maddison Project, Groningen Growth and Development Centre (GGDC), Historical GDP per Capita (Maddison), via Nations Inquiry.
Cite this dataset
Maddison Project, Groningen Growth and Development Centre (GGDC). Historical GDP per Capita (Maddison), 1820–2022 [data set]. As held by Nations Inquiry, https://nationsinquiry.com/datasets/historical-gdp-per-capita
The publisher’s own citation: Bolt, Jutta and Jan Luiten van Zanden (2024). Maddison style estimates of the evolution of the world economy: A new 2023 update. Journal of Economic Surveys, 1–41. https://doi.org/10.1111/joes.12618 (Maddison Project Database, version 2023).
Plain-language summary, not legal advice. The licence text is what binds.
06Where it is used
Around the site
Where these numbers appear on this site, and the datasets nearest to it.
Charted
Historical GDP per Capita (Maddison) by countryWho is highest, the map, the spread, who rose and fell, and the records.
Subjects
Near neighbours
- GDP per Capita (PPP)World Bank Group · 36 held · 1990–2025
- Economic Complexity IndexGrowth Lab at Harvard University · 30 held · 1995–2024
- Liner Shipping Connectivity IndexUNCTAD · 21 held · 2006–2026
07Questions
Historical GDP per Capita (Maddison): questions and answers
What is the Historical GDP per Capita (Maddison)?
Historical GDP per capita follows each country's output per person back to 1820, in 2011 international dollars, from the Maddison Project Database. It joins economic historians' reconstructions of old national accounts onto modern statistics, so that incomes two centuries apart can be set on one scale.
Which years of the Historical GDP per Capita (Maddison) can I download?
All 112, from 1820 to 2022, each as a CSV file, or every year together in one CSV.
Does GGDC rank countries on it?
No. GGDC publishes values only. The positions shown on this site are derived by ordering the published values, and are labelled as ours.
Can I use it commercially?
Yes, under CC BY 4.0, with credit to GGDC. The licence text is linked on this page.